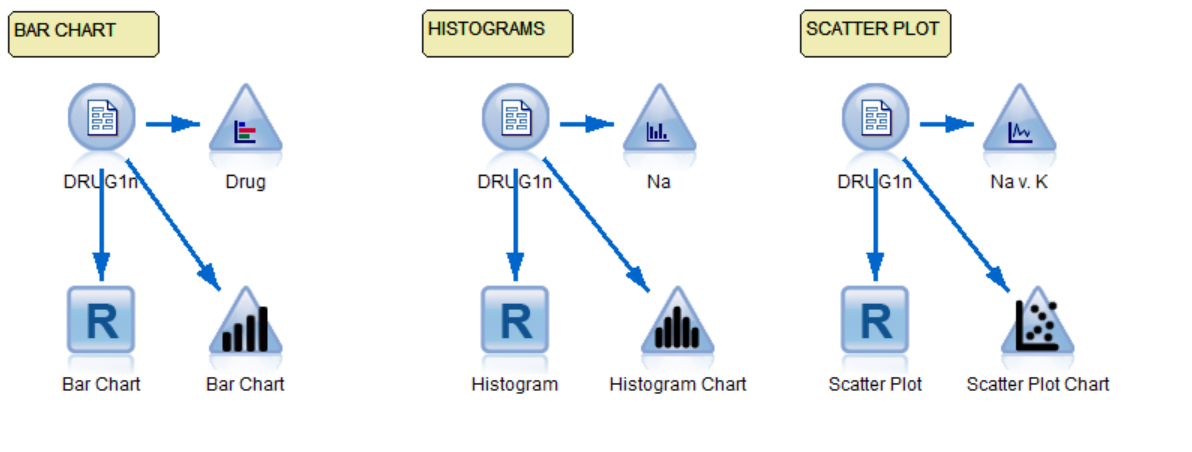
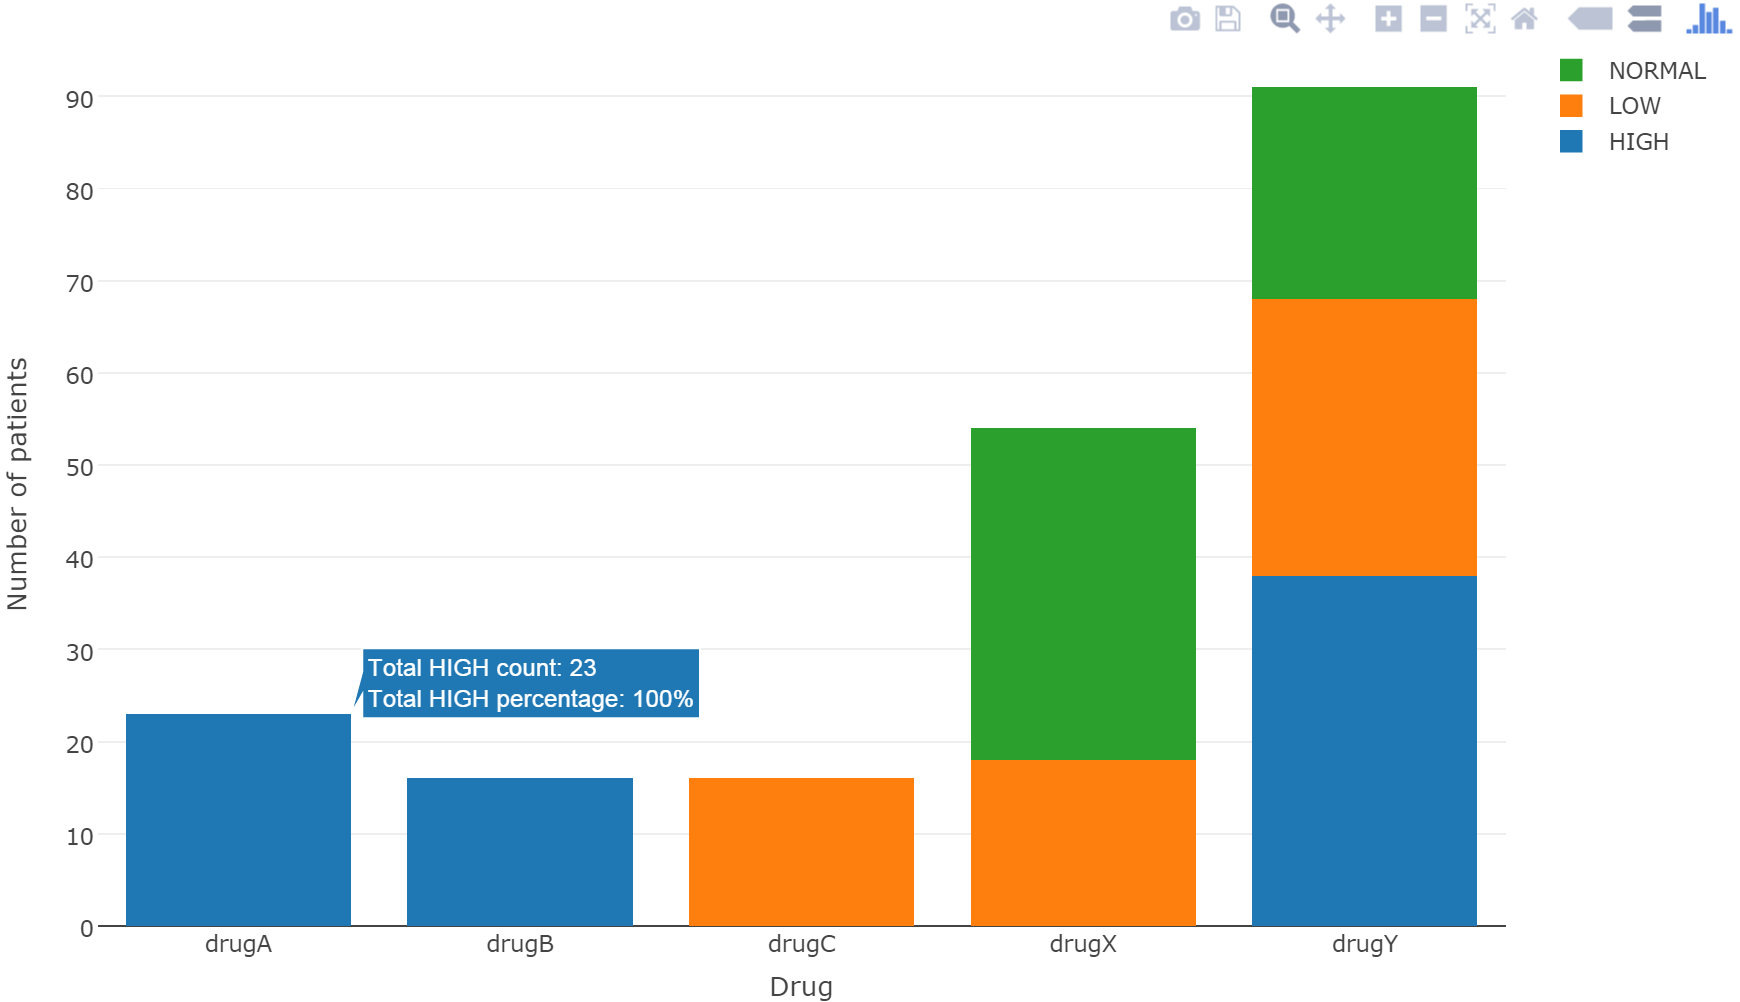
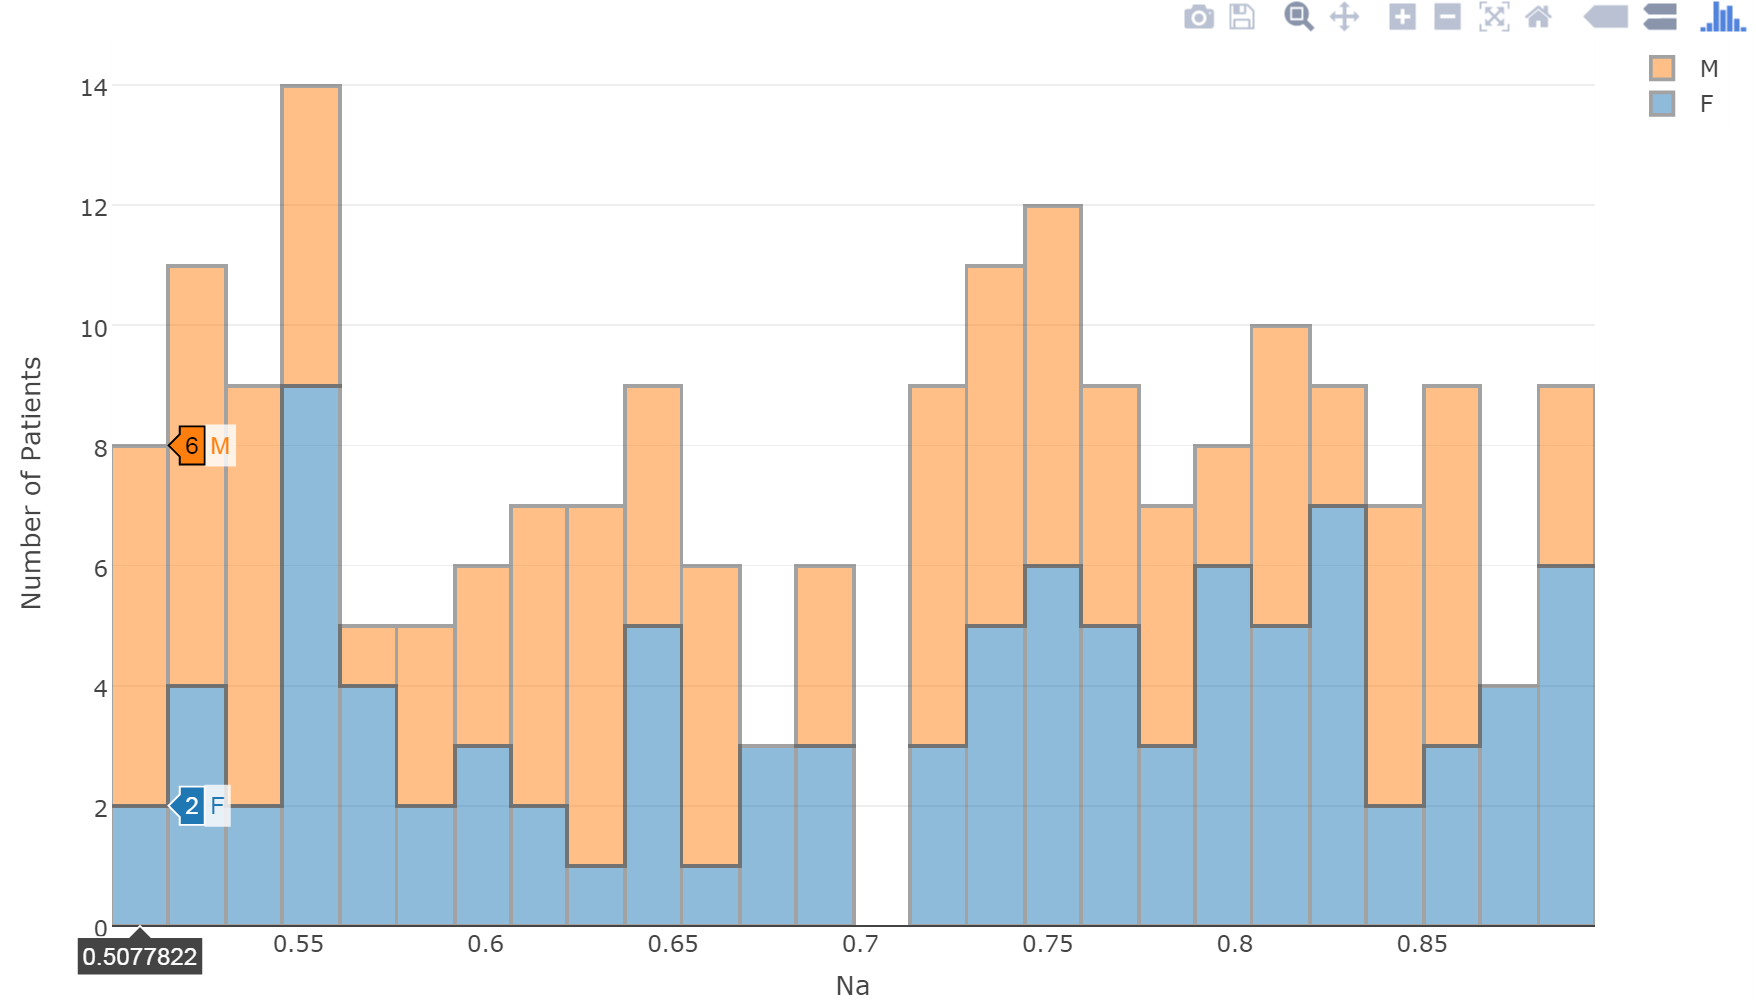
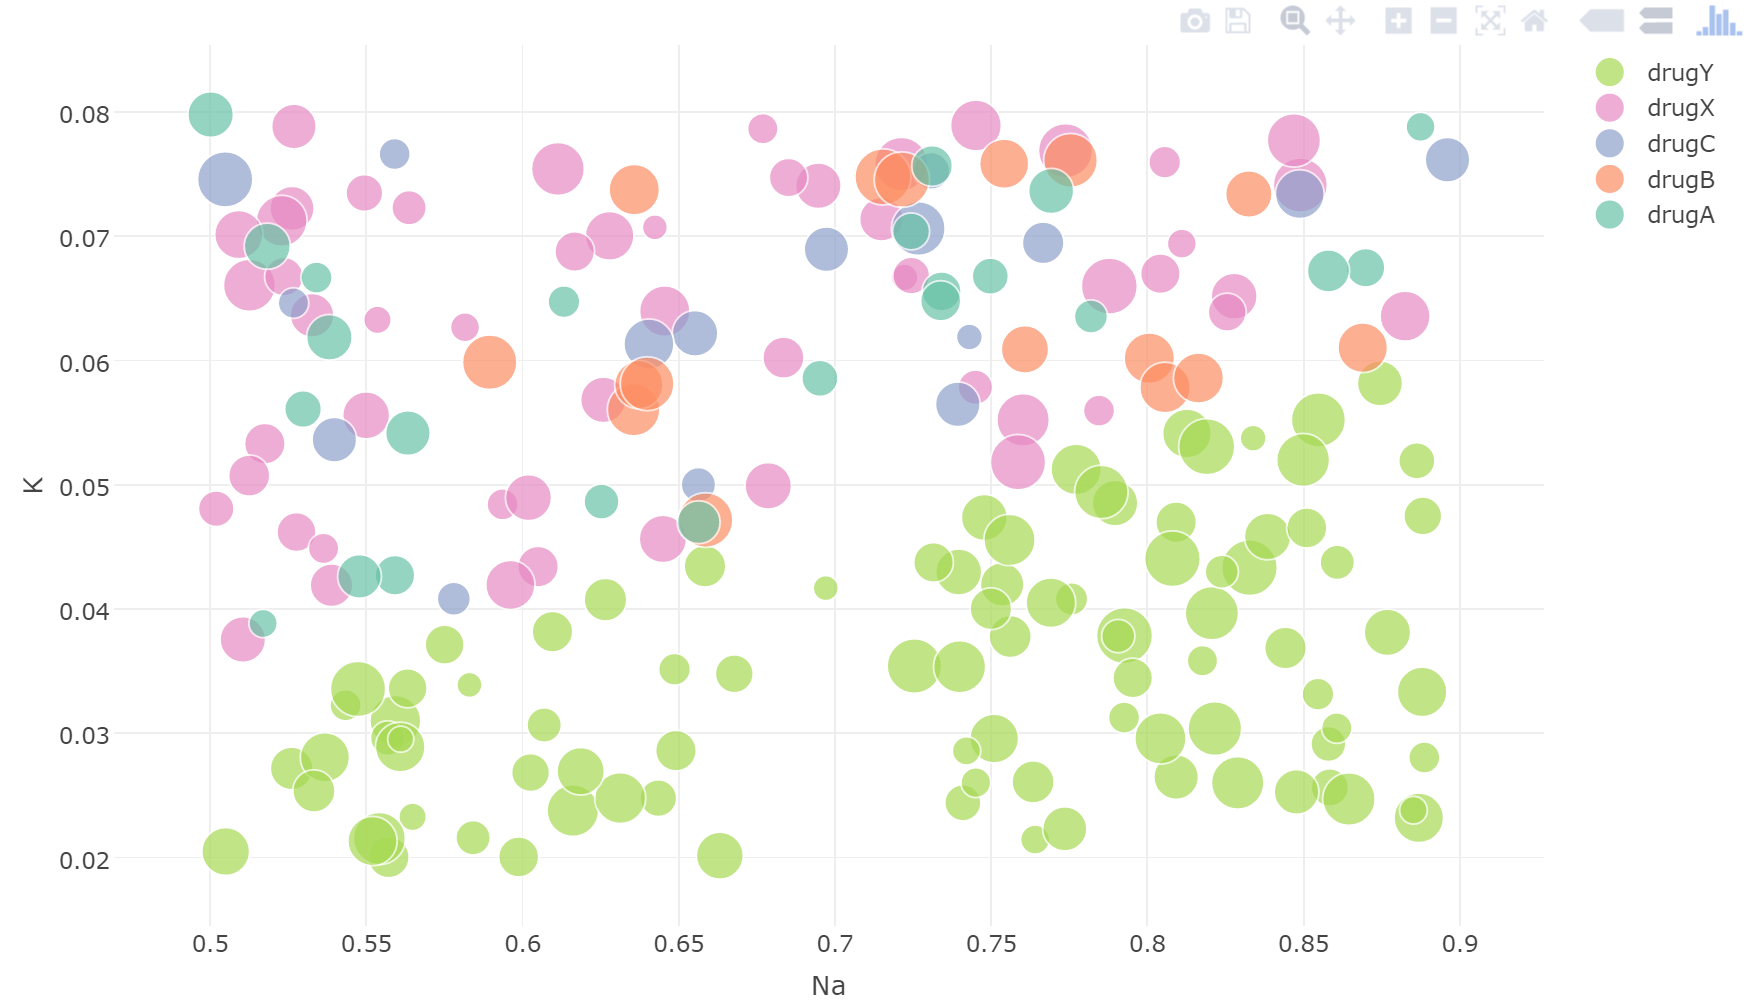
This extention allows you to create good looking offline (no need pass data or library queries through internet) interactive D3.js charts, which are generated by Plotly R library. Generated graphs are fully interactive and can be shown in any web browser. The main advantage of these graphs is that you can plot additinal information, which can not be done with standard SPSS graphs nodes. In addition you can zoom charts and slide them.

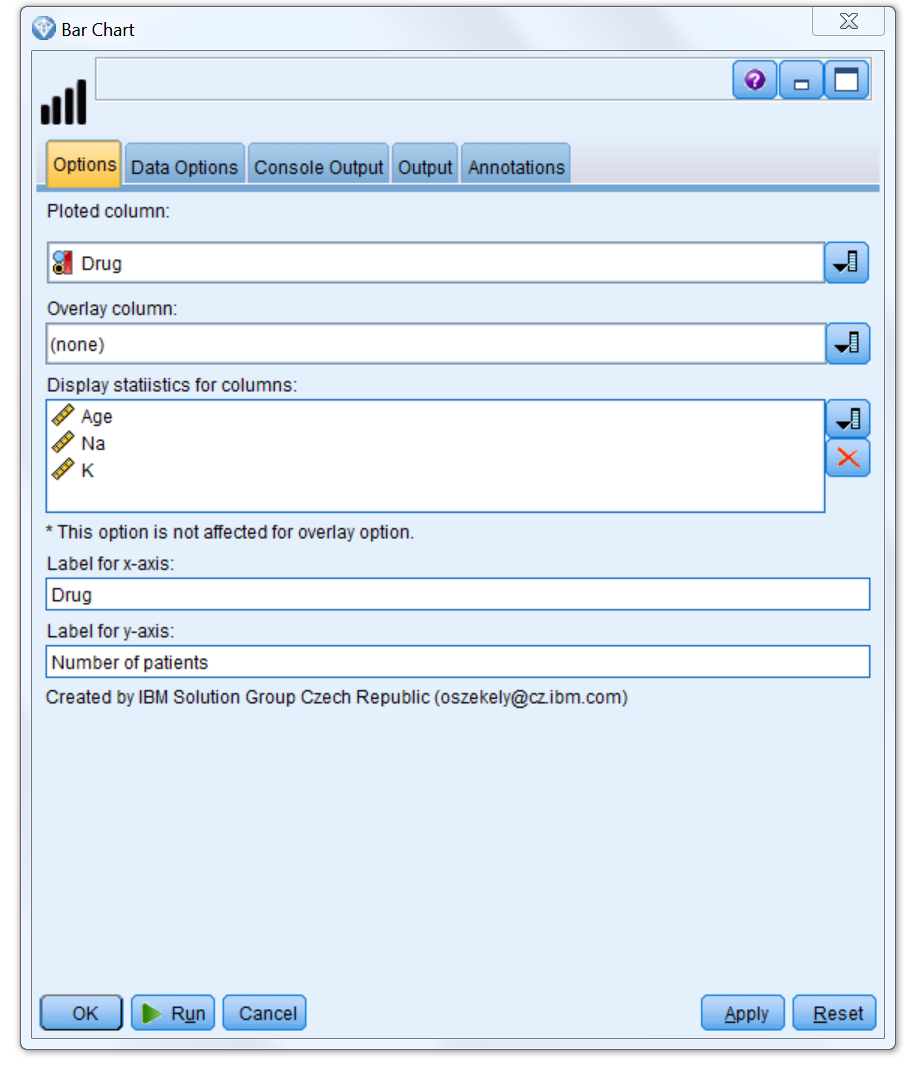
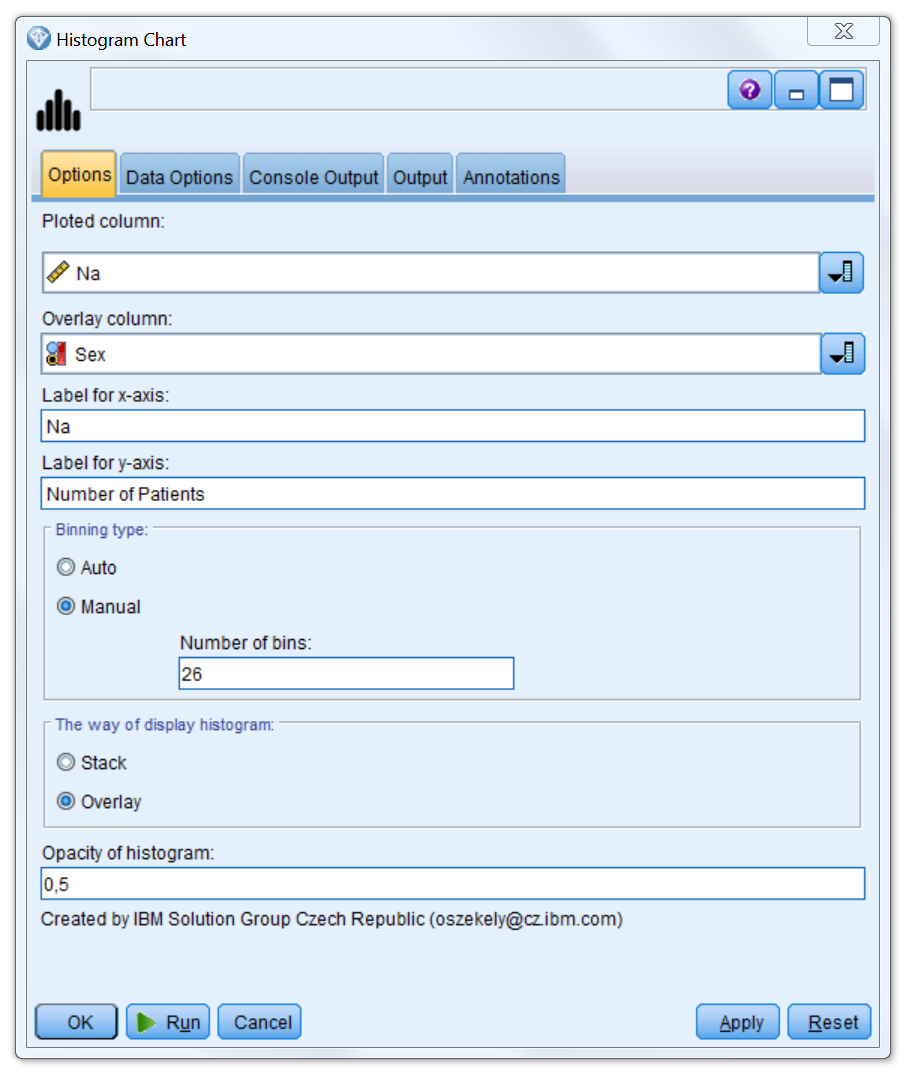
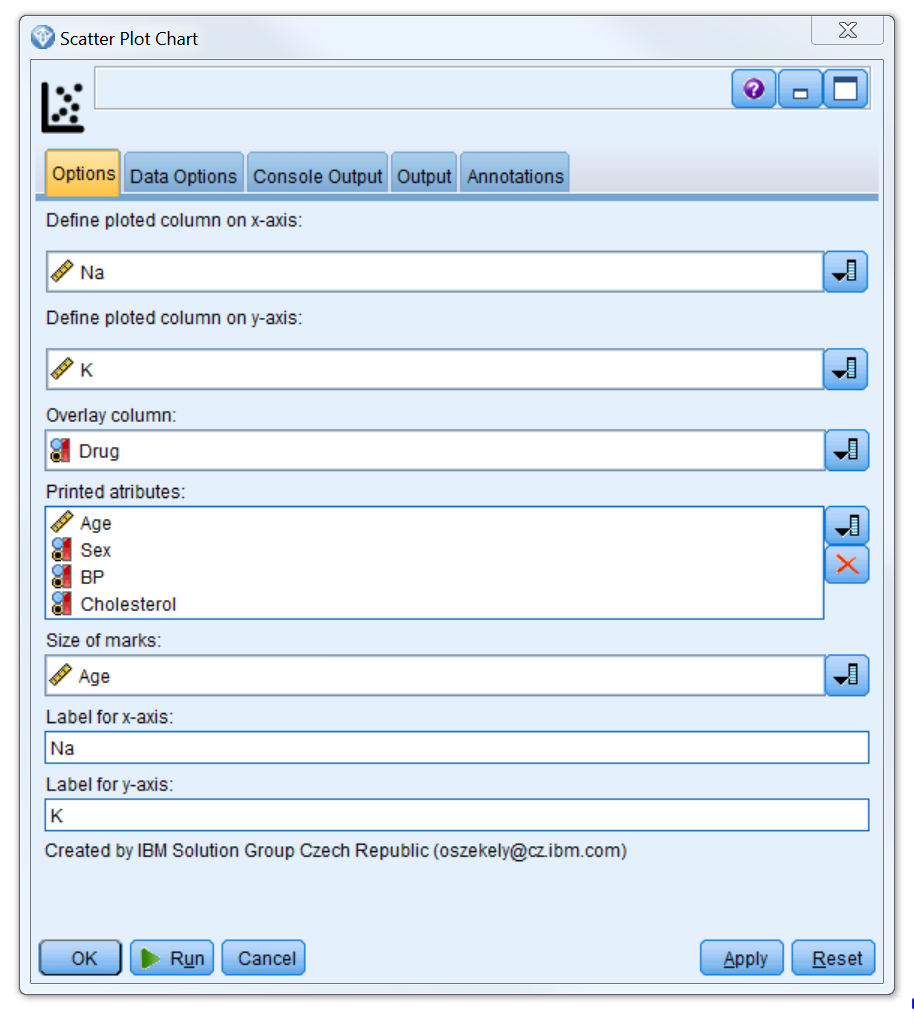
Option tab of these nodes is described in documment protocol_en.pdf stored in docs folder. Documentation
- Download the extension: Download
- Close SPSS Modeler. Save the .cfe files in the CDB folder of the IBM SPSS Modeler. The default location of the CDB folder on Windows 7 is ”C:\ProgramData\IBM\SPSS\Modeler\17\CDB”. If the ProgramData folder is hidden type the path manually. All needed R packages are downloaded and installed automatically when SPSS stream is launched.
- Restart IBM SPSS Modeler, the node will now appear in the Output palette.
The R packages will be installed the first time the node is used as long as an Internet connection is available.
- Find a PDF with the documentation of this extension in the Documentation directory
- There is a sample available in the Example directory
- Ondrej Szekely (email)
- Problems with overlay option are fixed (Histogram, Bar Chart).