See also: https://github.com/Identity-numbers/identity-generator
I was playing around with some business cards and got wondering about the pattern of shuffling those cards badly. The example case has 8 cards in a stack, let's call them 1 through to 8, even though 0-indexing is obviously superior.
I then shuffle the cards consistently and badly:
- I take the pile of cards in my right hand and remove the top and bottom card with my left
- I put those two cards, in the same order in my left
- I repeat step one, each time putting the top and bottom card on top of the left hand pile
After one 'go', the pile went from
[1, 2, 3, 4, 5, 6, 7, 8]to[1, 8, 2, 7, 3, 6, 4, 5]
If I shuffle the cards a couple of times, I will arrive back at the initial order. I wanted to know how many for an arbitrary amount of cards, so I wrote some code. This is the result for shuffling 8 cards.
0: [1, 2, 3, 4, 5, 6, 7, 8]
1: [1, 8, 2, 7, 3, 6, 4, 5]
2: [1, 5, 8, 4, 2, 6, 7, 3]
3: [1, 3, 5, 7, 8, 6, 4, 2]
4: [1, 2, 3, 4, 5, 6, 7, 8]
Now the interesting (I hope) bit: I assumed the shuffles would be something like: floor({amount of cards} / 2) But I looked at the shuffles for different numbers of cards and I can't find a pattern at all.
Cards: 3 - Shuffles: 2
Cards: 4 - Shuffles: 3
Cards: 5 - Shuffles: 3
Cards: 6 - Shuffles: 5
Cards: 7 - Shuffles: 6
Cards: 8 - Shuffles: 4
Cards: 9 - Shuffles: 4
Cards: 10 - Shuffles: 9
Cards: 11 - Shuffles: 6
Cards: 12 - Shuffles: 11
Cards: 13 - Shuffles: 10
Cards: 14 - Shuffles: 9
Cards: 15 - Shuffles: 14
It seems to me some of them are kind of: shuffles = amount of cards / 2 Others seem more: amount of cards = 1
Here is a longer list of just the number of shuffles (3 up to 99 cards):
2 3 3 5 6 4 4 9 6 11 10 9 14 5 5 12 18 12 10 7 12 23 21 8 26 20 9 29 30 6 6 33 22 35 9 20 30 39 27 41 8 28 11 12 10 36 24 15 50 51 12 53 18 36 14 44 12 24 55 20 50 7 7 65 18 36 34 69 46 60 14 42 74 15 24 20 26 52 33 81 20 83 78 9 86 60 29 89 90 60 18 40 18 95 48 12 98 99
The min and max of shuffles in 3-2000 cards is:
- Cards: 3 - Shuffles: 2
- Cards: 1995 - Shuffles: 1994
Apparently this sequence is already claimed on OEIS: A003558. (Thanks u/EspadaV8) I still don't get it though.
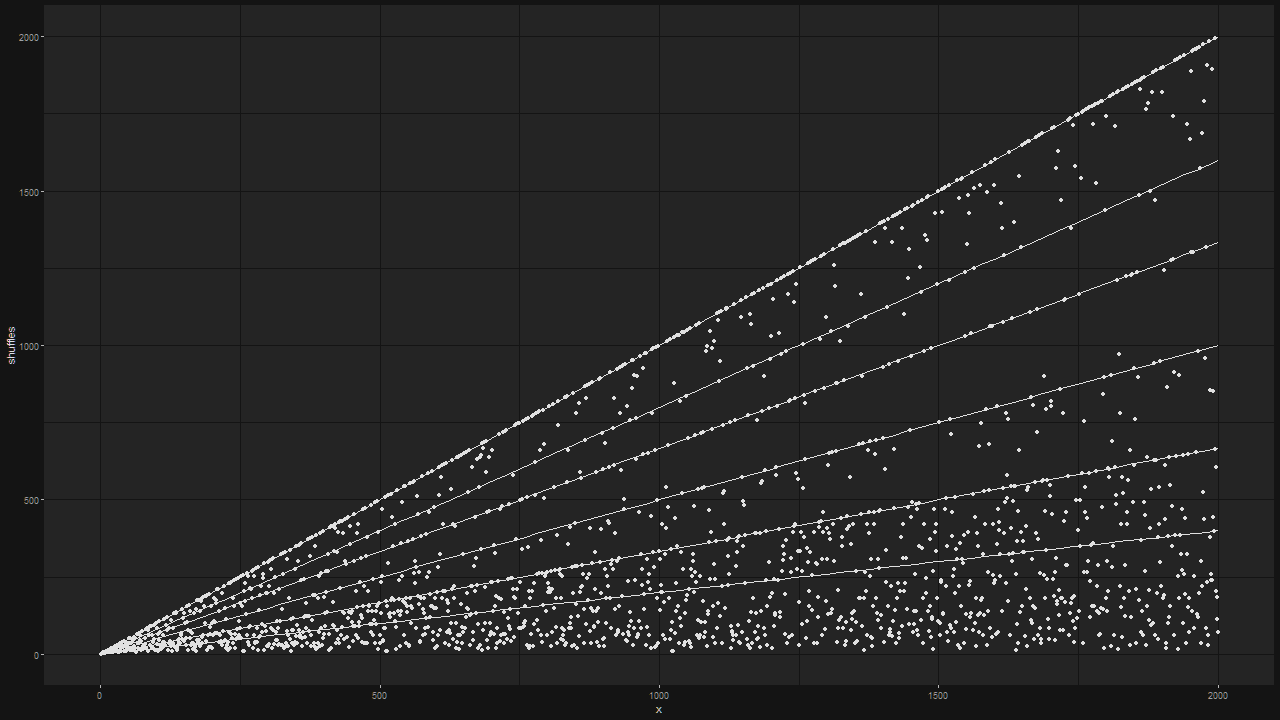
The min and max of the shuffles seems pretty close to the min and max of the range. This can be seen in the interactive graph at this link. Made by the code found in the Rplot directory.
Non-interactive graph is right here:
Here is one with some lines added:
Lines added:
fun.0 <- function(x) x
fun.1 <- function(x) 2 * x / 3
fun.2 <- function(x) 4 * x / 5
fun.3 <- function(x) x / 2
fun.4 <- function(x) x / 3
fun.5 <- function(x) x / 5
It's insane to me that 98 cards takes 12 shuffles and 99 cards take 98 shuffles. Some examples of weird results:
- Cards: 4973 - Shuffles: 24
- Cards: 4984 - Shuffles: 4983
