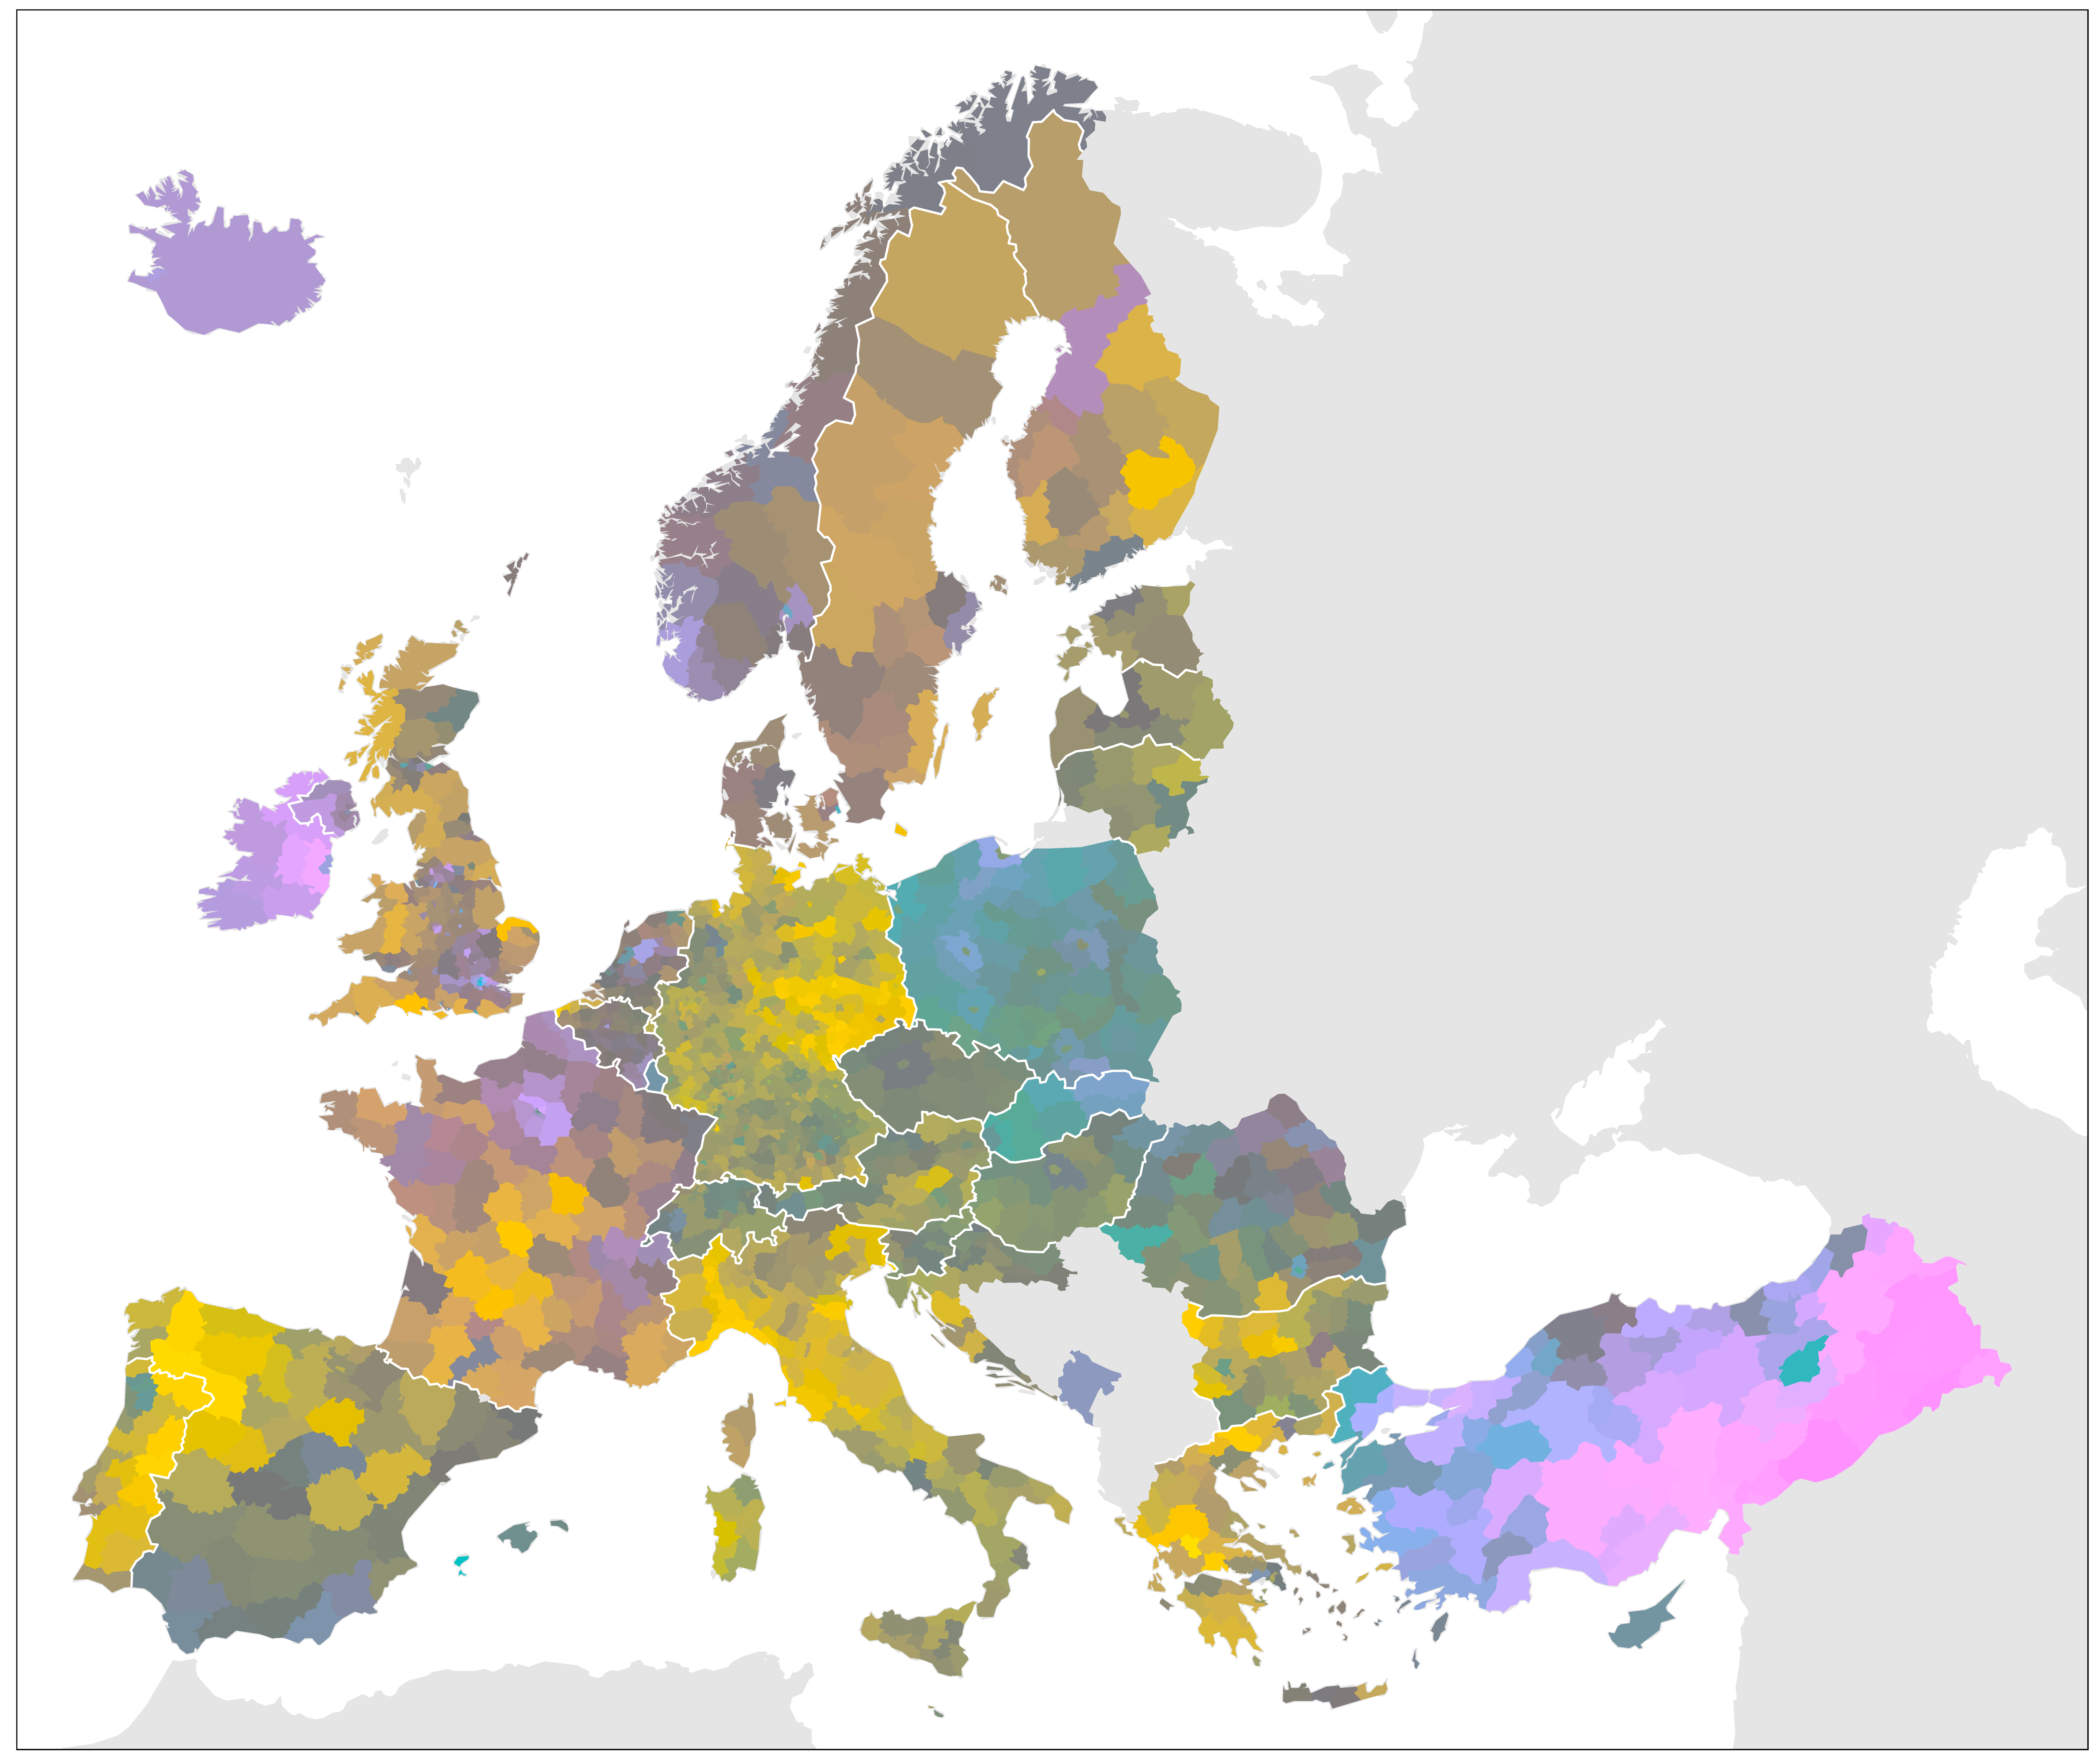
This repository provides a heatmap of European patent applications. A "region" is defined in terms of the NUTS3 definition. The objective is to render a set of heatmaps that show patent application activity.
The data used in this project was collected from the Worldwide Patent Statistical Database, otherwise known as PATSTAT. This dataset contains bibliographical and legal status patent data from leading industrialised and developing countries. This is extracted from the European Patent Office's databases. The database therefore contains all patents applied for and granted from the 18th Century to the current day.
Although it was impossible to add all data to this repository (in total it is about 400GB), some data was added to the data directory.
We use R as the primary language for performing econometric and statistical analysis. To reproduce the figures and analysis, base R needs to be installed. Moreover, a small number of R packages are required to run the analysis. These can be installed by running the requirements.R script, which can be found at the root of the PatentMap directory. Therefore, from the terminal:
cd <path/to/PatentMap>
Rscript requirements.R
Note that this installation script is written for Ubuntu.
You can run the full analysis and generate the figures using the main.R script. This can be run within the R enviornment itself, or alternatively can be run from the terminal with the following commands:
cd <path/to/PatentMap>
Rscript main.R
The objective of this repository is to produce a set of images that highlight the activity of patent applications in each region of Europe over time. The resulting images can be found in the images directory. For example:
The best way to troubleshoot or ask for a new feature or enhancement is to create a Github issue. However, if you have any further questions you can contact me directly.
