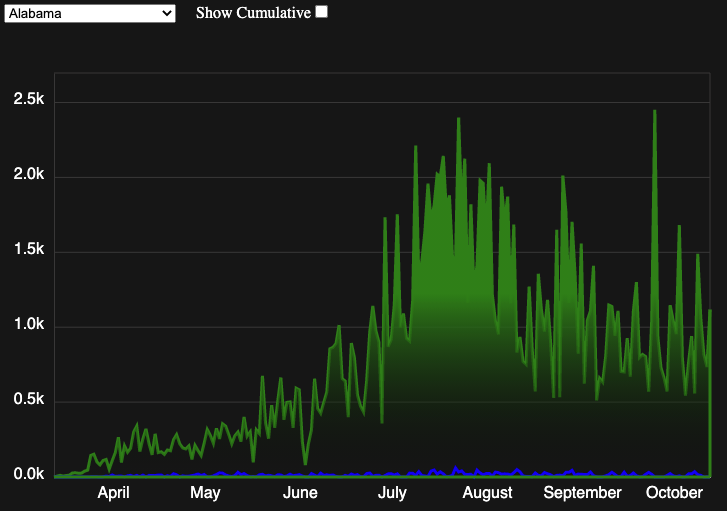
Easily fork this project on CodeSandbox
D3 Examples using real life data
NY Times Live Dataset: https://github.com/nytimes/covid-19-data/tree/master/live
NOTE: Please update this picutre if you make changes to the ui/ add anything to the page
HACKTOBER FEST Issues:
1.  Update this Readme with information found in the codebase
    - Something like how to create a chart
    - How to custom style a chart
2.  Write a test
3.  Add date range selector
4.  Update styles
5.  Add some more data sets
6.  Create a chart
    - Heatmap of us
7.  Add tool tips
8.  Add more documentation or helpful information to the comments in the code
9.  Make a global styles file and move styles in the index.js into that file
HINT: Look through code. There are some notes on things that might help you get started Hacking.
Fork this project on CodeSandbox which is by far the easiest way to get started
Run npm i && npm run start
If you've ever wanted to contribute to open source, and a great cause, now is your chance!
See these contributing how to docs for more information
If you create a PR Ill add you as a Hacktoberfest Contributer to the readme using a bot;
Thanks goes to these wonderful people (emoji key):
Matt Howa 💻 |
Irina Chernik 💻 |
Nouval Kurnia Firdaus 💻 |
This project follows the all-contributors specification. Contributions of any kind welcome!
Created with CodeSandbox

