NOTE: this README does not cover all the details in the paper, though it does serve as a summary of the final product of the project.
Third Year Project Screencast (Summary of the project)
- 🗺️ Overview
- 📷 Image Dataset for Mask R-CNN
- 🖼️ Mask R-CNN for Hold Detection
- ⬇️ Scaling Adjustments
- 🎯 Route Detection
- 🧗 Route Sequencing and Route Dataset
- 🔄 Bidirectional RNN Classifier
- 📊 Results
- ✍️ Improvements for future work
A third year project that uses image processing techniques and deep learning methods in an attempt to classify the grade of indoor bouldering routes on the Hueco 'V' scale based on a single image of the route (which can be taken from a phone camera).
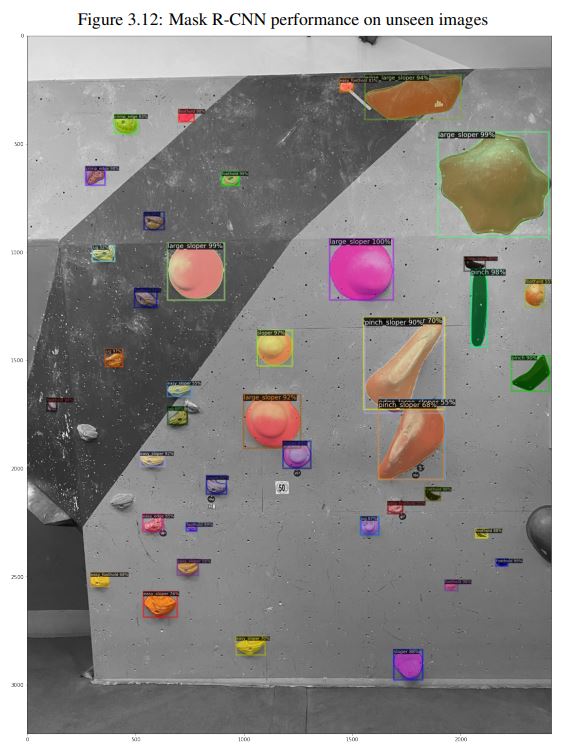
I used the Detectron2 API to train a Mask R-CNN model that allows for the detection of holds on a climbing wall through object segmentation. The model is able to extract the following key information:
- Type of hold
- Pixel area of hold
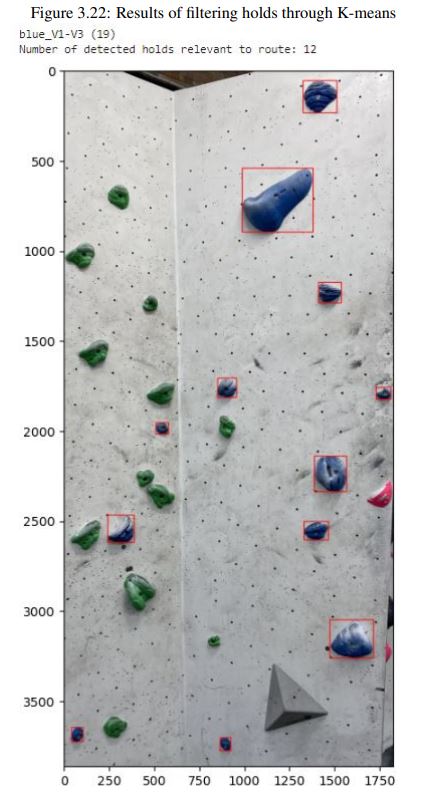
RGB K-means clustering is used to group detected holds into their respective routes. This allows for further information to be extracted from the image of the route such as:
- Distance between holds in sequence
- Direction between holds in sequence
- Number of holds in the route
Normalisation of the dataset involves scaling down area and distance values based on the pixel distance between T-nut holes on the climbing wall. The holes on the wall are detected using adaptive thresholding. All of this information is passed onto a bidirectional GRU RNN which classifies the route. The RNN is compared to an MLP to conclude the utility of RNNs with sequential data.
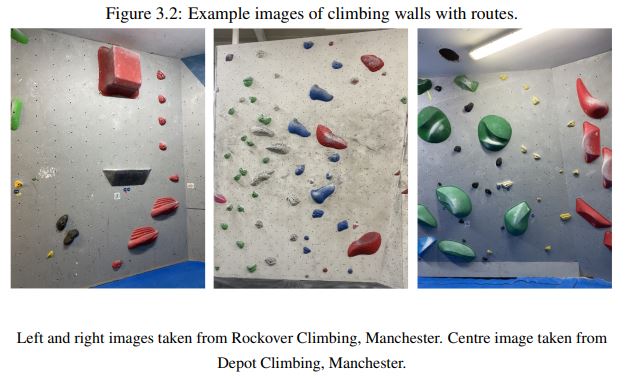
A total of 100 photos of indoor climbing routes from two climbing centres in Manchester were collected from my iPhone 11 camera. Only 'slab routes', i.e. completely vertical.
In order to prepare the images for training on a Mask R-CNN model, I used Labelme to carefully draw and label holds in images of climbing walls. I decided to label only 40 images given the timeframe that I had left for the project, but this luckily was not a problem as there were a total of 1060 labelled objects. These labelled images were also passed through an image augmentation pipeline to produce similar images of holds but in different orientation and lighting in order to artificially increase the number of training samples.
I used Facebook's Detectron 2 API to access and fine-tune a pre-trained Mask R-CNN model to the task of detecting climbing holds. A low batch size of 2 with a low learning rate of 0.00025 is chosen in order to maximise test accuracy whilst compensating for a relatively small dataset. The low learning rate is good for fine-tuning pre-trained models.
I found that setting the number of iterations to 5000 was suitable to bring the classification loss to < 0.1. I created a custom Trainer class that inherits Detectron2’s DefaultTrainer class. which includes random brightness, contrast, saturation, horizontal flip, vertical flip and lighting transformations in order to account for variations in hold orientations and variations in lighting in the training pipeline. All images are resized to 1300x800pixels for faster training.
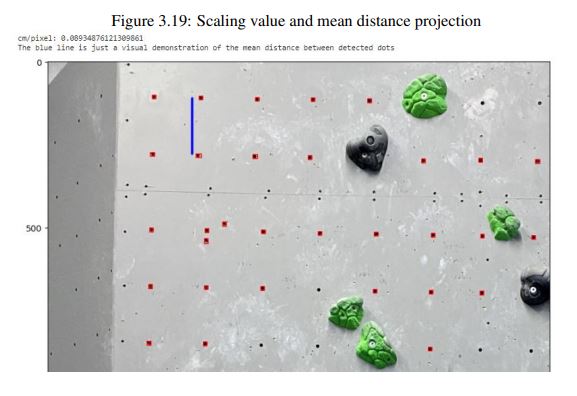
The pixel area of the detected holds from the Mask R-CNN model can be retrieved using the Green formula as Mask R-CNN outputs contours of object segmentations. However, photos of climbing walls are taken from different distances so the areas have to be normalised. Climbing walls have T-nut holes which are typically 15cm apart in the climbing centres that I took the photos in.
These were detected using adaptive thresholding and then the pixel distances between them were retrieved and averaged. Dividing 15cm by the pixel distance gives a ratio of cm/pixel which can be multipied to each climbing hold area (and also distance between holds) to normalise these values.
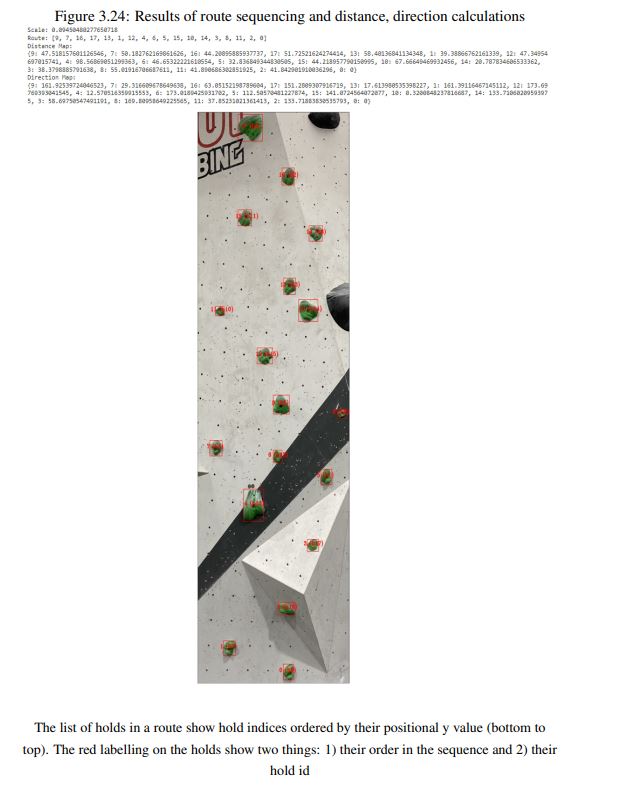
Each photo in the image dataset can contain multiple routes, a hold has a specific colour which assigns them to their respective route. To retrieve all holds of a single route, RGB K-means clustering is used first to check for black or white holds - if the holds are not black or white then their colour can be retrieved through their hue.
Holds are ordered by their height, where hold 0 is the first hold in the route and hold n is the highest hold in the route. This provides a sequence to the data which can be passed to an RNN. The assumption made is that a person climbs from the bottom to the top, so this happens to only work for my image dataset because there are no images with routes that involve a horizontal climb throughout the entire route.
Since there is a sequence to each route, information can be retrieved between consecutive holds. The distance and direction between hold can be calculated - the distance is normalised through scaling adjustments.
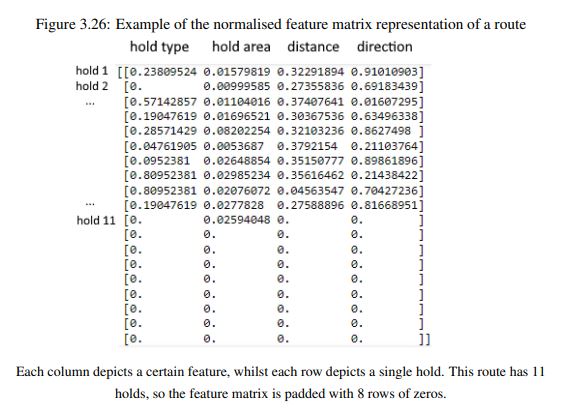
The route dataset consists of 149 samples, each representing a route (some images in the image dataset contain multiple routes). Each sample in the dataset is a 2D structure, where each row represents a hold in the route (ordered such that row n is hold n), and each column is a feature of the hold (hold type, normalised area, distance to the next hold, direction to the next hold).
A bidirectional GRU layer allows the model to receive further information about ’future’ and ’previous’ holds within a sequence, whilst it’s processing the ’current’ hold.
Each layer (excluding the output layer) consists of only 32 units because of the limited dataset. The goal is to not overcomplicate the model in order to prevent overfitting to the training data. Moreover, the input features are more or less explicitly defined so the relationship between them is not overly complex.
Dropout rates of 0.2 are placed to further prevent overfitting, whilst also accounting for noise in the data. The two major examples of noise are:
- the Mask R-CNN model being unable to detect every hold in an image so some holds are missing from the route and
- the Mask R-CNN model incorrectly classifying holds.
The output layer for the binary model has a sigmoid activation function as we wish to output predictions of 0 or 1, whilst the output layer for the multi-class model has a softmax function as we wish to output probability distributions for each of the 6 classes.
I compared an RNN architecture to an MLP architecture that I created with similar settings. Both of the models were trained and tested using 5-fold cross validation - k was chosen as 5 in order to get an 80/20 training and testing split for each training iteration
The RNN classifier is able to achieve 0.882 F1 score and 90.17% test accuracy on a binary classification task between 'Easy' and 'Hard' routes, whilst it is able to achieve a 0.424 F1 score and 63.24% in a 6-class classification task. Compared to the MLP, the F1 score is 0.015 higher, whilst the accuracy was 3.21% higher in the binary classification task. In the multi-class task, F1 score was 0.115 higher and the accuracy was 11.05% higher. The RNN proved to be a stronger performer throughout.
- Need to properly evaluate the Mask R-CNN model next time (evaluation data was lost unfortunately in the project)
- Create a larger dataset of images and routes, there was a severe imbalance in the dataset
- Consider automation of hold labelling with image processing techniques

