Given resistance costs for a raster of geo locations, the goal is to compute the optimal power line layout from a given start point to a given end point. The approach is to represent raster cells as vertices in a graph, place edges between them based on the minimal and maximal distance of the power towers, and define edge costs based on the underlying cost surface.
This repo contains all code of my master thesis on power infrastructure planning. A much more usable version of the framework is available on PyPI or in this repo as a package called LION. LION provides an interface to all main algorithms and has fewer dependencies (no GUI etc like in this repo). However, this repo here provide more functions than LION, including a GUI, baseline algorithms, visualization functions, etc, so install this repo if you are interested in any of those functions.
The library itself has few major dependencies (see setup.py).
kivyis required for the GUInumpyandmatplotlib
If wanted, create a virtual environment and activate it:
python3 -m venv env
source env/bin/activate
Install the repository in editable mode:
git clone https://github.com/NinaWie/PowerPlanner
cd PowerPlanner
pip install -e .Unfortunately, there is a major clash between the kivy and the graph-tool package. graph-tool is not used in the angle-constrained shortest path algorithms, but in the baseline algorithms which use a normal Bellman Ford algorithm. If you want to install graph-tool, you need Anaconda and you can install from the provided yaml file:
conda env create -f environment.yml
source activate penv
Note: If this environment is active, then the UI can not be used as kivy is not installed.
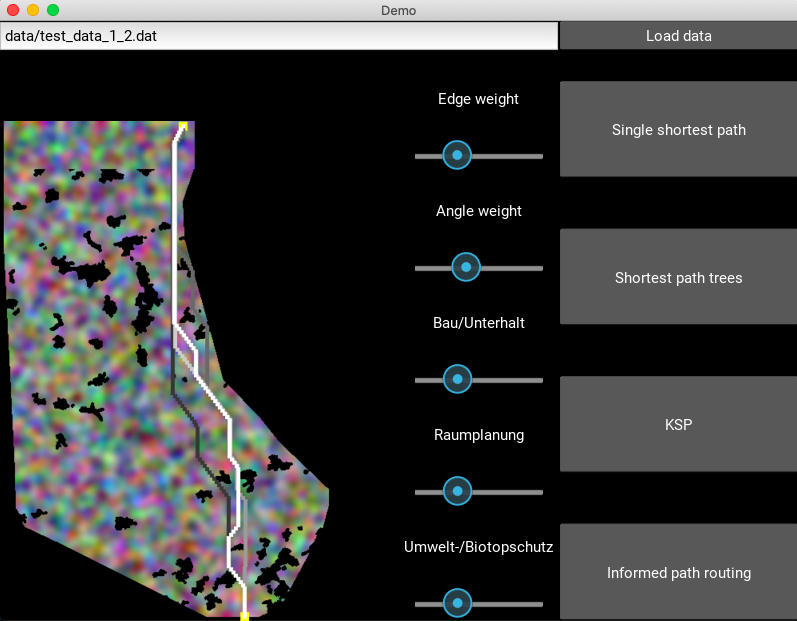
A small python GUI serves as a demo app for the toolbox. Start the UI by running
python ui.pyIn the demo notebook, the most important functions are explained and visualizations show the input data and outputs for each processing step.
If you want to run one instance without UI, execute
python main.py [-h] [-cluster] [-i INSTANCE] [-s SCALE]Optional arguments: -h, --help: -cluster: -i INSTANCE: the id of the instance to use (here one of ch, de, belgium) -s SCALE: the resolution: 1 for 10m, 2 for 20m, 5 for 50m resolution
Specify other hyperparameters in the config file of the instance (example will be added soon).
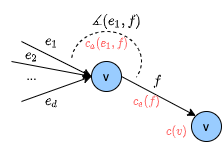
Different types of costs are considered and weighted: Angle costs, edge costs (cost for putting a cable above a particular position), and vertex costs (cost to place a pylon).
An algorithm was developed to deal with angle costs, which is not possible with normal shortest path algorithms (e.g. Dijkstra). The code can be found as sp_dag or sp_bf dependent whether it is a directed acyclic graph or not, and is implemented in numba for efficiency.
If you use this code in a publication, please cite the following paper:
@article{wiedemann2021optimization,
  title={An Optimization Framework for Power Infrastructure Planning},
  author={Wiedemann, Nina and Adjiashvili, David},
  journal={arXiv preprint arXiv:2101.03388},
  year={2021}
}

