You can find out code and examples in colab notebook.
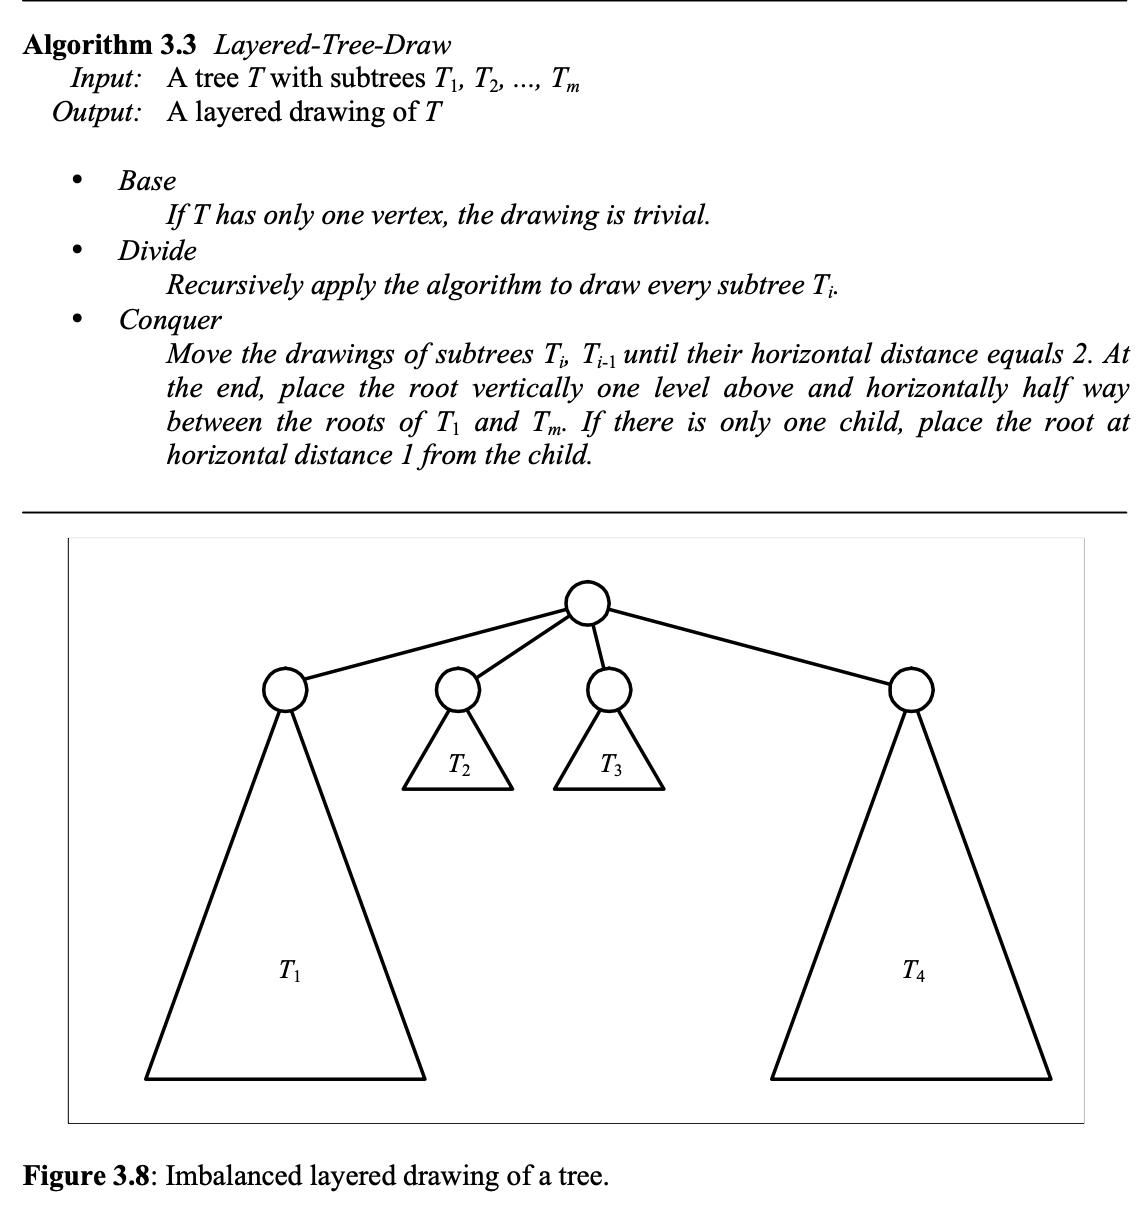
We use Layered-Tree-Draw algorithm to visualize our trees. You can see its pseudocode on the sreenshot below.
This screenshot was taken from this doc where you can find some more interesting algorithms of tree visualization.
In our implementation we use matplotlib for visualization and also networkx lib for loading and parsing graphs in GraphML format.
You can find out code and examples in colab notebook.
There are two algorithms implemented for DAG visualization:
- Coffman-Graham algorithm for DAG visualization with
max_width - Algorithm for minimizing dummy vertecies
Also algorithm for minimizing crossings count executes after layout algorithm for minimizing dummy vertecies.
You can find out code and examples in colab notebook.
We get all possible variants of label placements for each point and corresponding bound rectagles.
After that we consider each rectangle and corresponding clauses on positions surrounding rectangles.
These clauses in fact are implications. For example, rectangle with id = 1 can not be placed with rectangle
with id = 2, so it means implication: x_1 -> not(x_2). In this way we compute all clauses and convert them to
SAT problem (x_1 -> x_2 => not(x_1) or x_2). We try to solve this problem with SAT-solver. If solution exists, we get
filtered list of rectangles which we can draw.
- PySAT python SAT solver lib
- 2-SAT problem solution
- Boolean satisfiability problem
You can find out code and examples in colab notebook.
- Paper t-SNE implementation
- How to use t-SNE effectively
- MNIST dataset
- Binary search
