This is a Natural Language Processing project which focuses on sentiment analysis of tweets relating to the COVID-19 Vaccines.
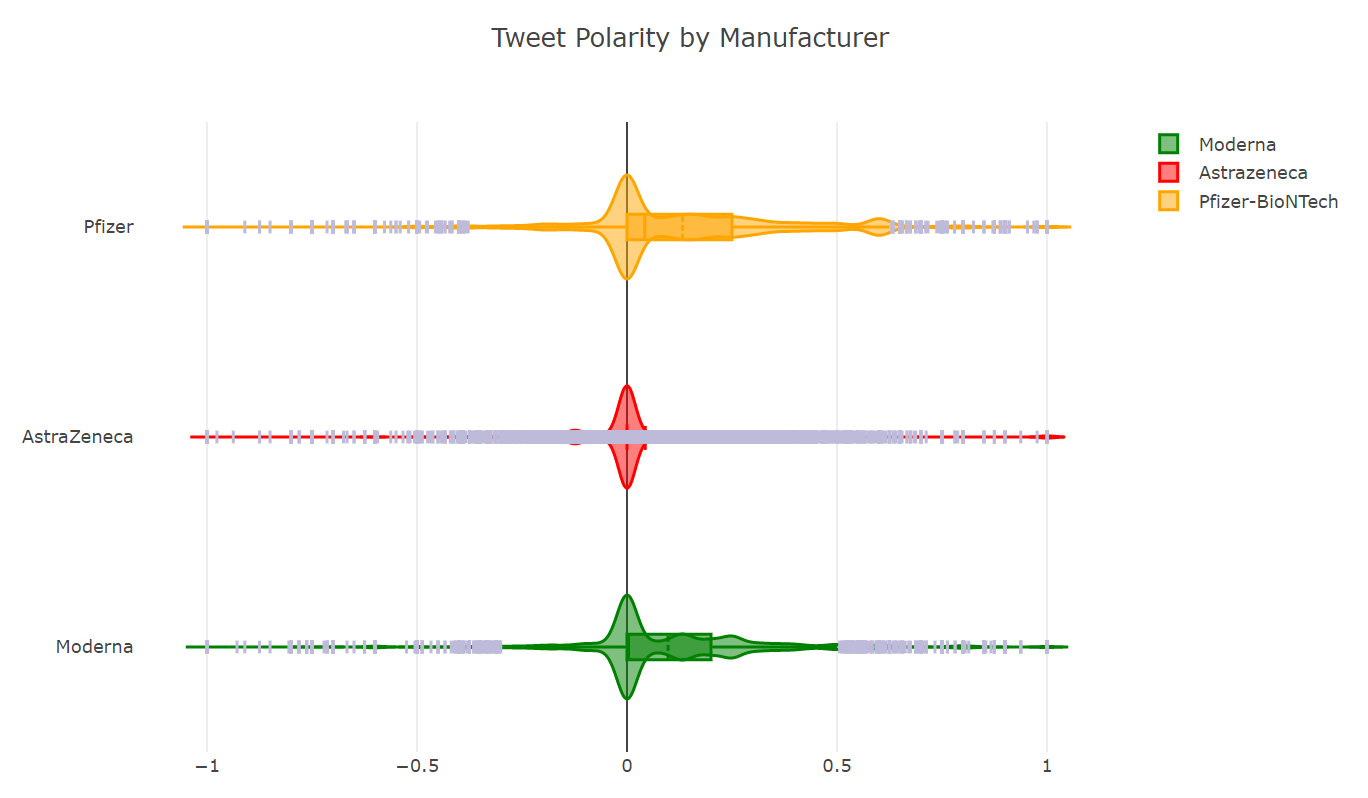
Tweets are analyzed according the the drug company that is mentioned in the tweet(if any) to compare the overall sentiment in tweets about Pfizer-BioNTech, Moderna and AstraZeneca.
These sentiments will be used along with geographical data to highlight areas of positive and negative sentiment across Canada. Retweets and likes will be analyzed to compare the popularity of positive vs negative tweets between Canada and the USA
This data will be stored to an online database and deployed as a Flask app using Heroku. The current Heroku app version can be viewed here. This will allow you to interact with visualizations that show:
- Which Company is being mentioned
- Tweet sentiments (positive, negative and neutral)
- Popularity (based on likes and retweets)
- Where tweets are comming from (as soon as I can find a free service to geoparse what users enter in the location data - any suggestions, feel free to message me)
There will be more tweets with a positive than negative sentiment.
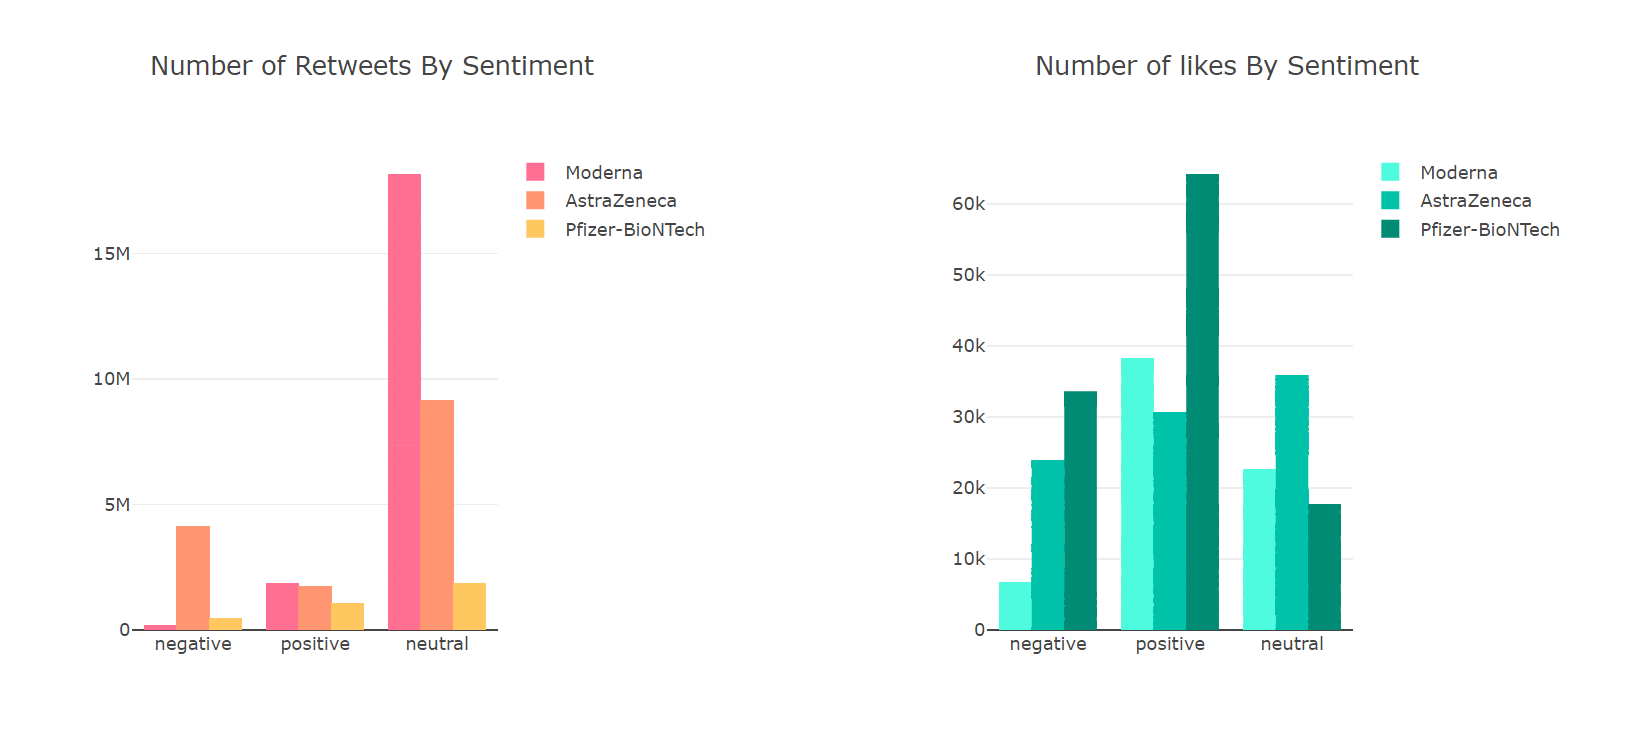
Positive tweets will be liked and retweeted more often than negative tweets.
Positive tweets will outweigh negative tweets regardless of company mention.
Twitter API version 1.1
Heroku
- Python
- Pandas - for data cleaning
- Tweepy - Library for accessing Twitter's API
- TextBlob - For polarity and subjectivity scores
- Scipy - ttests of means of retweets and likes across positve and negative tweets
- SQLAlchemy - for CRUD
- Flask
- Flask SQLAlchemy - to load cleaned and analyzed data into flask app using various API routes
- JavaScript and D3.js
- Plotly.js - To visualize positive vs negative tweet popularity acorss time and country
- Leaflet.js and Mapbox - To create interactive maps for data visualization
- HTML5
- Bootstrap - because it's awesome
Tweets which meet the following criteria will be gathered:
- Posted in English
- Mention the following: Covid Vaccine, Covid-19 Vaccine, Pfizer, Pfizer-BioNTech, Moderna or Astra Zeneca
- Are not themselves retweets
The Twitter API will be accessed using the Tweepy Module
# Tweepy search parameters
search_terms = ['covid+vaccine OR covid-19+vaccine\
              OR pfizer OR pfizer-biontech OR pfizerbiontech\
              OR moderna \
              OR astrazeneca OR astra+zeneca \
              -filter:retweets']

# Tweet collection
tweets = tweepy.Cursor(api.search, max_id = max_id, lang ='en', q=search_terms, tweet_mode='extended').items(limit)Text section of the tweet will be cleaned to remove @, # and hyperlinks
def CleanTweets(txt):
    # remove @ from username
    txt = txt.replace('@','')

    # remove RT
    txt = re.sub(r'RT[\s]+','',txt)

    # remove # but leave txt
    txt = re.sub(r'#','', txt)

    # remove hyperlinks
    txt = re.sub(r'https?:\/\/\S+', '', txt)
    return txt
The text will then be rated in terms of subjectivity and polarity using the TextBlob module
# to get subjectivity
def RateSubjectivity(txt):
    return TextBlob(txt).sentiment.subjectivity

# to get polarity
def RatePolarity(txt):
    return TextBlob(txt).sentiment.polarity

# add worded sentiment based on polarity score
def GetSentiment(num):
    if num < 0:
        return 'negative'
    elif num == 0:
        return 'neutral'
    else:
        return 'positive'

# Create Columns
def RateTweets(df):
    df['Subjectivity'] = df['text'].apply(RateSubjectivity)
    df['Polarity'] = df['text'].apply(RatePolarity)
    df['Sentiment'] = df['Polarity'].apply(GetSentiment)
    return df
Section of analyzed dataset
# Create an engine for the database
# ------------------------------------------------------------------------------

engine = create_engine(conn, echo=False)

# Reflect Database into ORM classes
# ------------------------------------------------------------------------------
Base = automap_base()
Base.prepare(engine, reflect=True)@app.route('/popularity')
def popularity():
tweets = Base.classes.tweets
session = Session(engine)
lines = session.query(tweets.id_str, tweets.date, airlines.Sentiment, tweets.retweet_count, tweets.tweet_favourite_count).all()
lined = {'timeline':[{
'id_str': [col[0] for col in lines],
'date': [col[1] for col in lines],
'sentiment': [col[2] for col in lines],
'retweets': [col[3] for col in lines],
'likes': [col[4] for col in lines]
}]}
session.close()
return jsonify(lined)
Likes and Retweets by Sentiment

😸 Nikita Case


