This app can be used to create control charts for data uploaded as a .csv file.
The charts are generated using the
qicharts2 package.
Use the Upload Data box to upload your dataset. The file must be a flat comma separated (.csv) file with headers.
Here is an example using the gtt dataset in from the qicharts2 package.
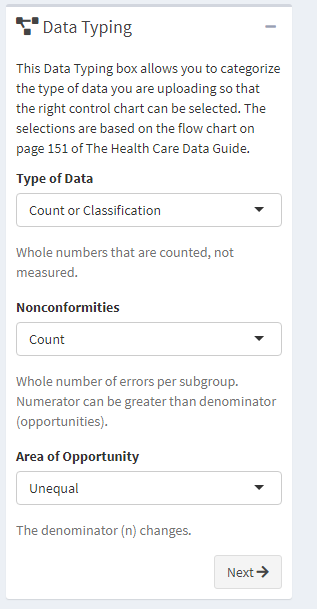
The Data Typing box allows you to categorize the type of data you are uploading so that the right control chart can be selected. The selections are based on the flow chart on page 151 of The Health Care Data Guide.
The gtt dataset contains information about adverse events during
hospitalization using the Global Trigger Tool. These are counts of adverse
effects where the denominator changes over time.
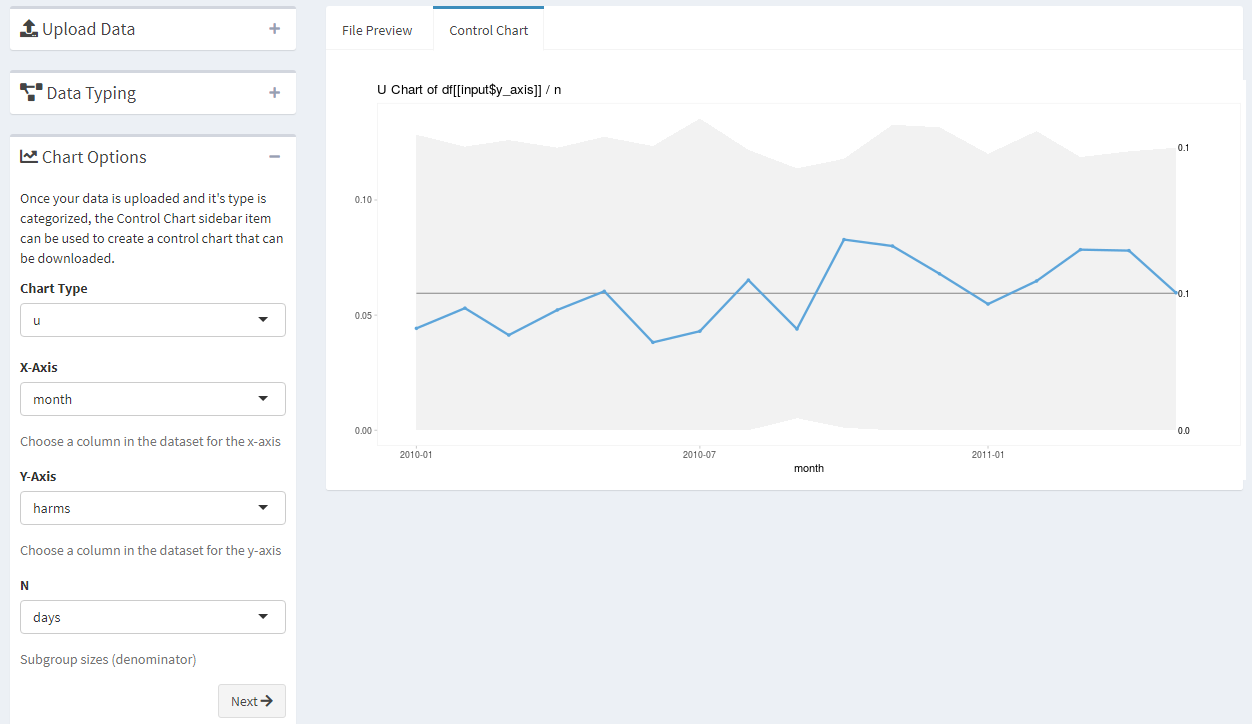
The Chart Options box lets you choose the chart type, the column in the data set for the axes, and the column for the denominator.
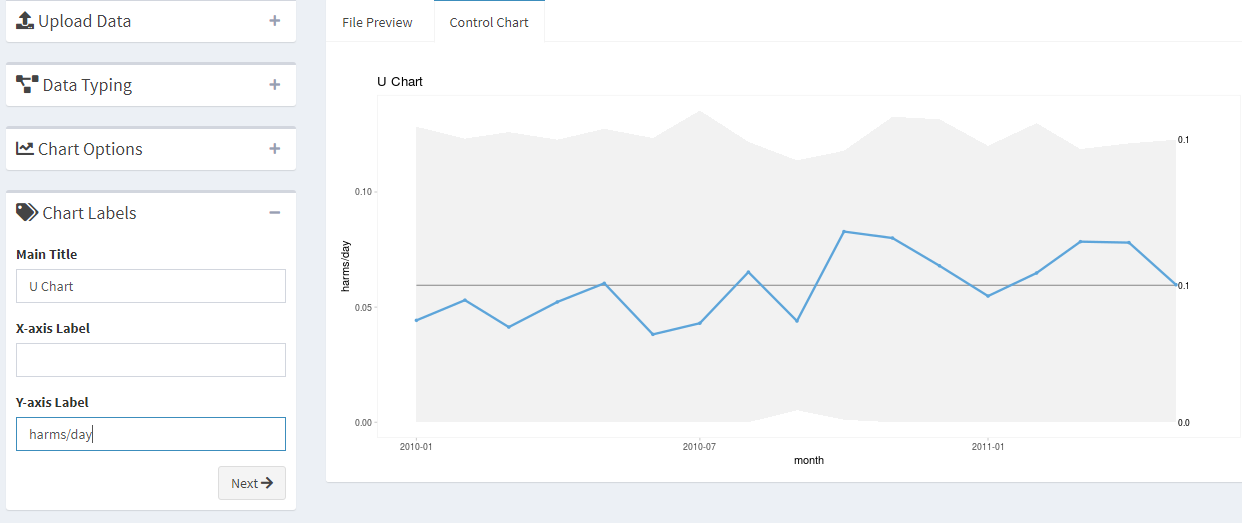
You can change the main title and axis labels in the Chart Labels box.
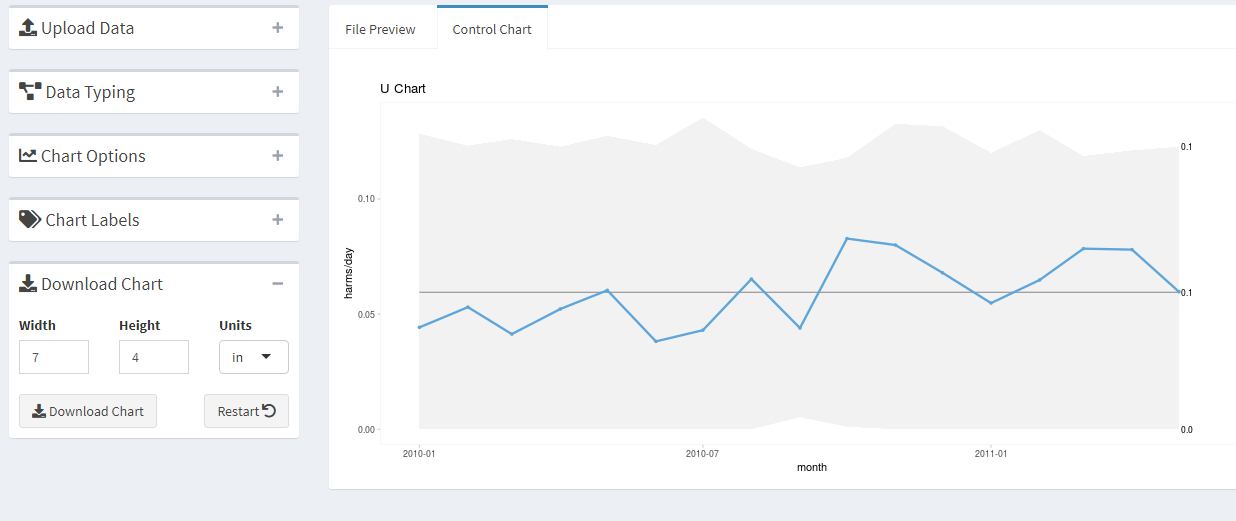
The chart can then be downloaded.


