Modeling choice and confidence in reinforcement learning (restless bandits) with Gaussian-distributed payoffs.
This code was tested in Matlab versions 2017b and 2018b. Parts of it require Matlab's statistics toolbox and optimization toolbox. Bayesian model comparison requires VBA toolbox.
The data are those used by Hertz et al (2018) in experiment 1.
The experiment consists on a non-stationary two-armed bandit task. At each trial, participants are presented with two doors, and are asked to choose one of them to sample a reward from and indicate their level of confidence (1 to 6) as below:
The options give rewards sampled from Gaussian distributions that change without warning over the experiment (every 25 to 37 trials). One option is often better than the other (M = 65 vs M = 35). An option can have low or high SD (10 or 25 respectively), giving 4 possible conditions based on the combinations:
Main analysis scripts:
- modelFitMap : fits parameters for each model to each participant and saves results
- modelComparison: does Bayesian model comparison to test which model accounts best for the data. It estimates the best model for each participant, and compares the model frequncies.
- modelComparisonConfidence: fits confidence on the probability of correct choice expected by each model for each participant, and calculates the model likelihood. then does Bayesian model comparison based on this.
- modelAnalysis: gets model predicted accuracy based on the trial by trial probabilty of choosing the right option (but using the actual subject actions for learning). -plotModelPatterns: Plots each model predicted average accuracy and confidence per condition compared with real data (results of the previous script).
- modelSimulations: simulate behavior with random parameters for each model, and do model fitting, resulting in crossed goodness-of-fit measures between models.
- modelConfusion: does bayesian model comparison on the simulations, producing a confusion matrix for the models (showing the frequency with which each model is deemed best for each generative model).
I test different biases to analyse their ability to replicate human behavior (choice and confidence reports). At the learning stage, I test variations of an optimistic bias (i.e., updating the subjective values more for positive than for negative prediction errors), and at the action/confidence selection stage, I test a satisficing criterion (as seen on Hertz et al (2018), softmax function over the difference in probability of a “good enough” outcome for each option) versus random exploration (softmax function over learnt means), and Thompson sampling (Thompson, 1933)(i.e. the probability of choosing option A matches the probability that A it gives a higher reward than B).
I test 8 different models, varying whether they learn about the outcome variance, the type of learning bias (none, mean, and variance; more details below) and the action selection:
The model updates the subjective value ("expected outcome") of the chosen option based on the prediction error (difference between obtained and expected outcome) and a learning rate parameter (alpha).
Where Q is the trial-by-treal belief about the mean of each option
Action selection is then done according to a softmax choice:
Where beta can be considered an "exploration rate" parameter. The probability of choosing option A will be higher the higher the difference in the Q values, and beta scales this increase.
This model works as Q1, only it uses a different learning rate depending on the sign of the prediction error term (), similar to Lefebvre et al.(2017).
This model learns about the mean outcome of the options like Q1, but it also learns about their variances:
To make use of the learnt variance for choice, this model uses Thompson sampling (Thompson, 1933), which would be equivalent to sampling a random number from each value distribution and compare them, choosing whichever is highest.
Same as Q1V1, but with two learning rates for the means (as Q2)
Same as Q1V1, but with two learning rates for the variances of the outcomes. This is inspired by the idea that the value of more pleasant stimuli is encoded with more precision (Polania, Woodford, and Ruff,2019).
These are versions of Q1V1, Q2V1, and Q1V2 with a "satisficing" choice rule, which calculates the probability that the oputcome of each option is bigger than a threshold (T), (cummulative density function of T given the learnt distribution mean and sd). Then these probabilities are input into a softmax function. Additionally, there is some decay in the learnt value of the unchosen option, such that it drifts towards the treshold:
Notice the drift happens according to the learning rate of the mean. For Q2V1,there are two learning rates (for positive and negative prediction errors). I (somewhat arbitrarily) used the one for positive prediction errors.
Each model parameters are fitted to maximize the likelihood of the observed choices for each participant. Based on the likelihood, I calculated the BIC for each participant and model, and then input this matrix into Bayesian model comparison to output estimated model frequencies:
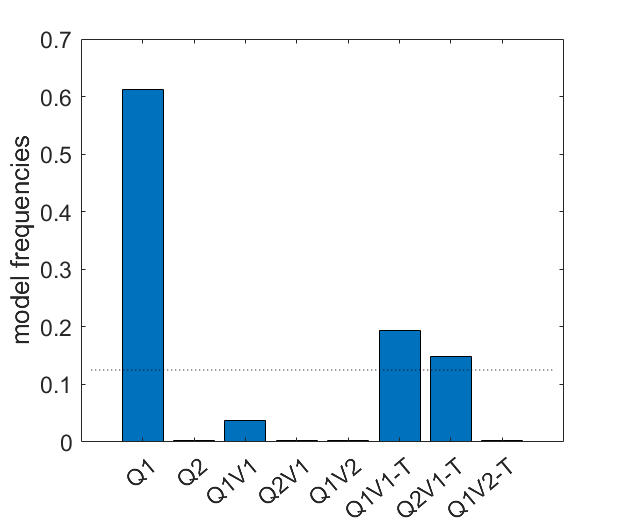 The model that predicts choice best accross participants is Q1, with a protected exceedance probability >.99. That is, it would seem tha participants do not take outcome variance into account, and learn equally well from possitive and negative surprises.
For doing Bayesian model comparison on confidence, I regressed each subject's trial-by-trial confidence reports on each model's time-course of the probability of correct choice, and obtained the BIC from these regressions.
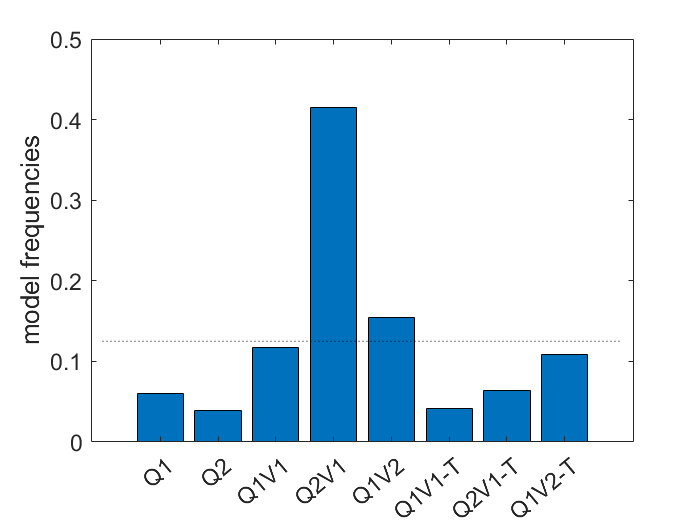
The model that predicts confidence best accross participants seems to be Q2V1 (protected exceedance probability >.99), that is, a model that learns the outcome means optimistically and that uses information about the outcome variance.We have seen that models Q1 and Q2V1 offer the best explanation of choice and confidence respectively, but two different models could produce the same output if the conditions in which they are tested are limited. What if the task is not suited to unbiasedly distinguish well between the models? To test that, one can run simulations for each model, fit all models on the simulated behaviors, and count how many times the correct generative model would be deemed the best by model comparison (Wyart, Palminteri and Koechlin,2017). This allows to create a matrix like this:
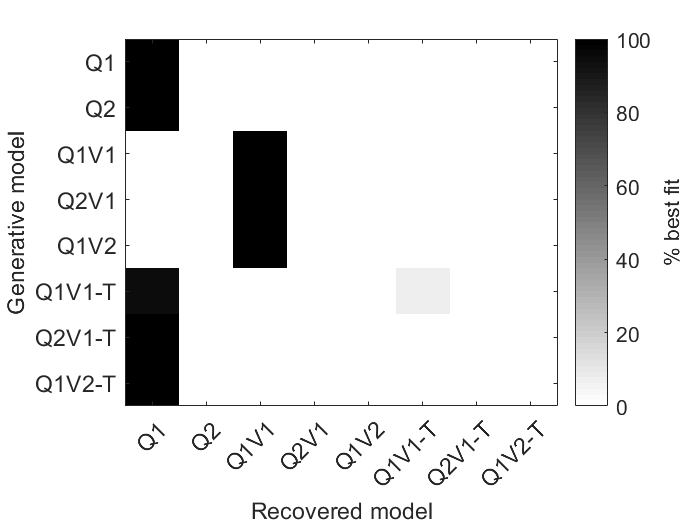 Where the desirable scenario is to have a "very diagonal" matrix. Unfortunately, it is not the case here, it seems there is a strong bias towards models with fewer parameters, such that Q1 is considered the best when Q2 is the real underlying model. A similar thing happens for Q2V1 and Q1V2, which are confused with Q1V1. The models using the "satisficing choice rule" are also confused with Q1. Therefore, regardless of the model comparison done above, we cannot say with precision that Q2V1 is better at explaining confidence than Q1V1, since the task is not suited to distiniguish between both. The only possible distinction seems to be between models that use variance to guide choice (Q1V1,Q2V1,Q1V2) and models that do not (Q1,Q2).
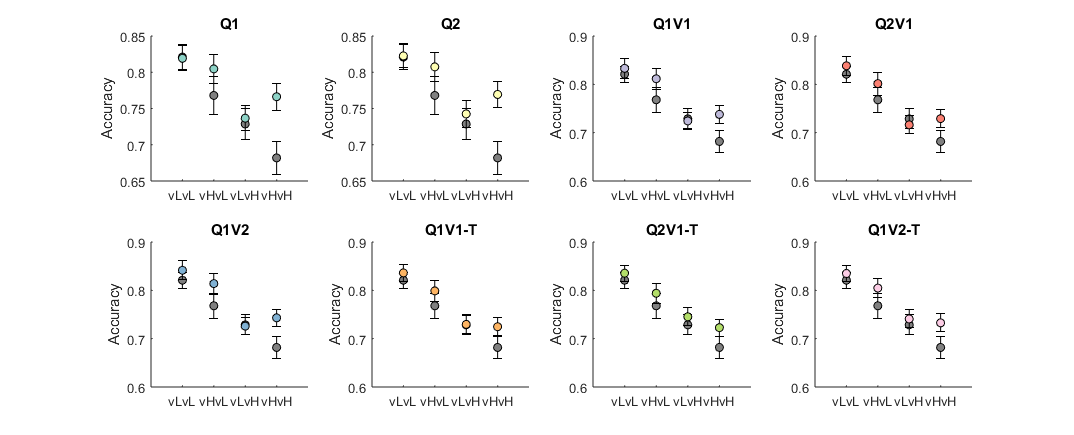
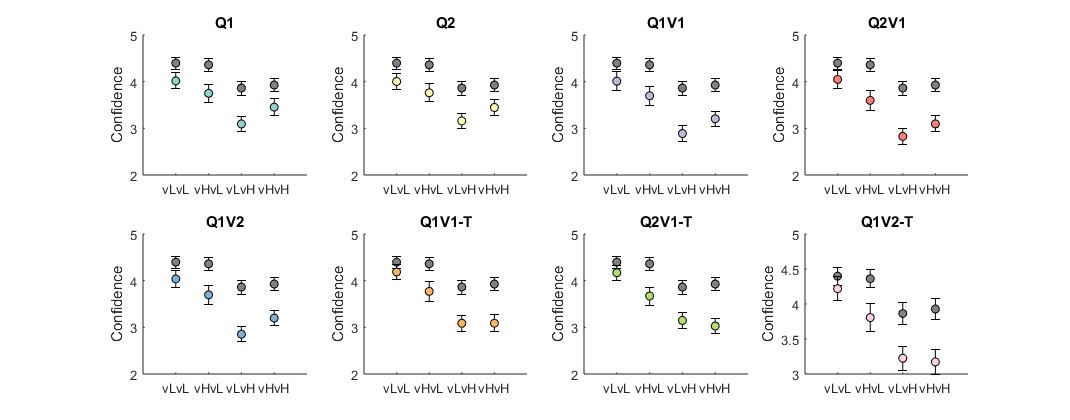
Expected accuracy and confidence (based on each subject's actual choice,reward history, and estimated parameters) compared against subject reports. Grey circles represent real data, and colored circles the model predictions.
None of the models tested recovers the qualitative pattern of confidence across conditions (confidence higher for low variance of good option, without an effect for variance of the bad option).Results suggest that human choices do not use a learnt representation of the outcome variance (as indexed by quantitative model comparison), in line with Hertz et al. (2018). Simulations with relatively broad parameters show both types of models (variance-ignoring and variance-informed) can be accurately identified. However, it is possible people do use a representation of variance, but in a way not computationally tested here. Optimistic learning is not seen here, but the simulations suggest it is not possible to identify optimistic models in these data.
As for confidence, quantitative model comparison points towards an optimistic, variance-informed model. The use of outcome variance replicates Hertz et al. (2018), whereas the optimistic bias is in line with some unpublished data (Salem-Garcia et al, in preparation). However, none of the models tested recovers the qualitative pattern of confidence across conditions (confidence higher for low variance of good option). Besides model misspecifications (models lacking some important feature for replicating human behavior), there are two other important limitations. First, the model parameters are fitted solely based on choices. Directly fitting on confidence (be it jointly with choice or separately) could provide different results. Second, model identifiability was not directly assessed for confidence, leaving some uncertainty as to whether the task and model comparison procedure can identify the underlying confidence model. Future work will address both of these limitations by specifying a generative model of confidence (e.g. Flemming and Daw, 2017), so that one can estimate the trial-by-trial probabilities of the given confidence reports.
