English | 中文
React Version: react-giojs
Wechat minigame: wechat usage
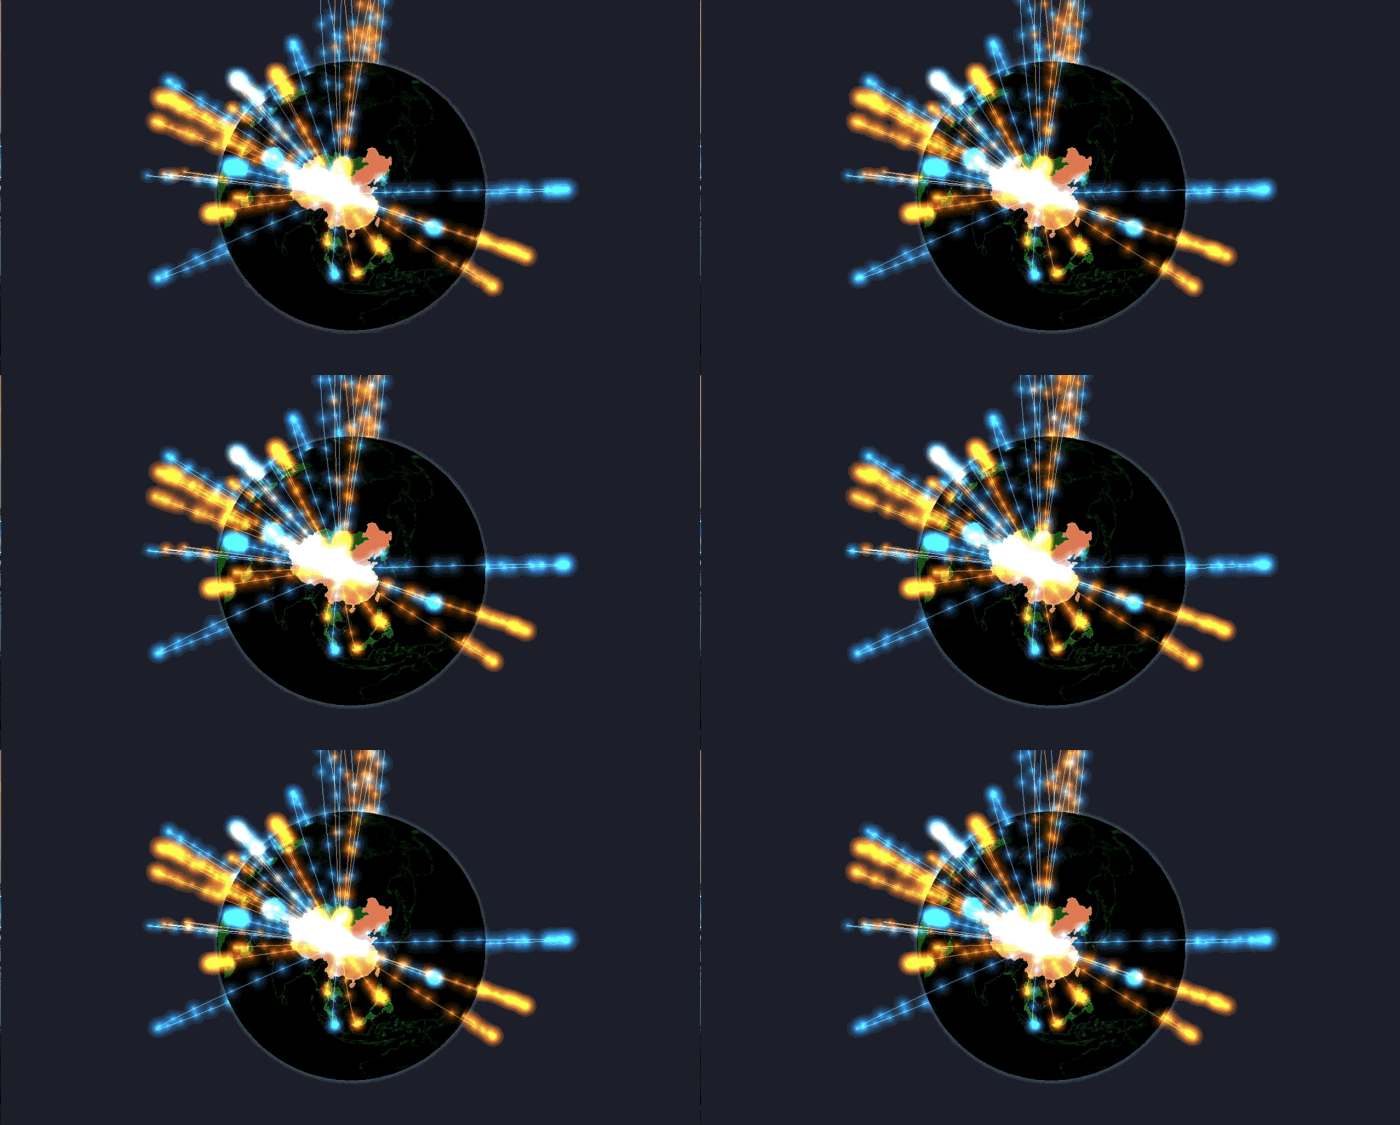
Gio.js is an open source library for web 3D globe data visualization built with Three.js. What makes Gio.js different is that it is simple to use Gio.js to customize a 3D data visualization model in a declarative way, add your own data, and integrate it into your own modern web application.
- Motivation
- Getting Started
- Gio.js 2.0 Introduction
- Examples
- API List
- Documentation
- Contributors
- License
Gio.js is an open source library for web 3D globe data visualization built with Three.js. What makes Gio.js different is that it is simple to use Gio.js to customize a 3D data visualization model in a declarative way, add your own data, and integrate it into your own modern web application.
This library is inspired by the Arms Trade Visualization project developed by Michael Chang and presented during Google Ideas INFO 2012. See original post. With Gio.js, it is easy to reproduce this fantastic data visualization model, and integrate it into web application.
- Simplicity -- Create a 3D global data visualization model with your own data in just four lines of javascript code
- Customization -- Design your own globe style with easy to use APIs in Gio.js
- Modernization -- Build a responsible, fully interactive, rich 3D frontend application using Gio.js
- Option 1: <script> tag
Include Three.js dependency:
<script src="three.min.js"></script>Include local Gio.js library
<script src="gio.min.js"></script>or through CDN
<script src="https://threejs.org/build/three.min.js"></script>
<script src="https://cdn.jsdelivr.net/npm/giojs@2.2.1/build/gio.min.js"></script>- Option 2: npm
npm install giojs --save- Option 3: yarn
yarn add giojsAfter including "three.min.js" and "gio.min.js" in your html, create a div to render the 3D Gio globe: (the usage of Gio.js is a little bit different in WeChat mini game, checkout this demo to know more about it)
<!DOCTYPE HTML>
<html>
<head>

  <!-- include three.min.js library-->
  <script src="three.min.js"></script>

  <!-- include gio.min.js library-->
  <script src="gio.min.js"></script>

</head>
<body>

  <!-- container to draw 3D Gio globe-->
  <div id="globalArea"></div>

</body>
</html>
To initialize and render the 3D Gio globe:
<script>

    // get the container to hold the IO globe
    var container = document.getElementById( "globalArea" );

    // create controller for the IO globe, input the container as the parameter
    var controller = new GIO.Controller( container );

    /**
    * use addData() API to add the the data to the controller
    * know more about data format, check out documentation about data: http://giojs.org/html/docs/dataIntro.html
    * we provide sample data for test, get sample data from: https://github.com/syt123450/giojs/blob/master/examples/data/sampleData.json
    */
    controller.addData( data );

    // call the init() API to show the IO globe in the browser
    controller.init();

</script>
If everything goes well, you shall see this. For more fancier usage of Gio.js, check out Gio.js API document
Click the codepen logo to try it in Codepen:
After Gio.js 1.0 released, developers propose many cool and constructive advise. Gio.js implements most of these features. Gio.js 2.0 comes with many big features such as:
-
Data group and switchDataSets API to switch between different data sets [introduction]
-
Provide Three.js programming interface [introduction]
-
Provide Stats.js programming interface [introduction]
-
Support export data to continent [introduction]
-
Provide input data check [issue]
-
Support WeChat mini program [demo]
-
New clearData [introduction]
-
New closeLiveLoader [introduction]
-
Transparent Background [introduction]
-
Auto Rotation [introduction]
Gio.js has many representative demos to show how to work with Gio.js, there are mainly three example resources:
- Resource 1: Gio.js Playground
There is a Playground ( playground link ) for developers to play with Gio.js and export Gio.js parameter.
- Resource 2: Github "examples" folder
Gio.js has many API demos, and these demos are gathered in examples folder. clone the Gio.js repo, try them in your own environment ~
- Resource 3: Live demos on Codepen
Gio.js has a Codepen collection which contains many live demos about Gio.js, click the codepen logo and try to edit them!
Configure the controller.
➡ setInitCountry(ISOCode, default: 'CN')
Set the country initially selected.
➡ lightenMentioned(boolean, default: 'false')
Makes the mentioned country brighter than those not mentioned in the input dataset.
➡ disableUnmentioned(boolean, default: 'false')
Disables an unmentioned country and makes it unselectable.
➡ showInOnly(boolean, default: 'false')
Displays only the line with data flowing into the selected country.
➡ showOutOnly(boolean, default: 'false')
Displays only the line with data flowing out of the selected country.
Enables the halo around the earth. When enabling halo, the color of halo also can be specified.
Disables the halo around the earth.
Displays stats on the upper-left corner of the scene.
Hides stats on the upper-left corner of the scene.
Make default background transparent.
Make globe rotate automatically.
Sets the color scheme of the 3D globe by name.
➡ setSurfaceColor(string, default: '#ffffff')
Sets the color of the surface the 3D globe.
➡ setSelectedColor(string, default: '#ffffff')
Sets color of the country in selected state.
➡ setExportColor(string, default: '#DD380C')
Sets the color of out line.
➡ setImportColor(string, default: '#154492')
Sets the color of in line.
➡ setHaloColor(string, default: '#ffffff')
Sets the color of the Halo.
➡ setBackgroundColor(string, default: '#000000')
Sets the color of the background.
➡ adjustOceanBrightness(float, default: 0.5)
Sets the brightness of the ocean.
➡ adjustRelatedBrightness(float, default: 0.5)
Sets the brightness of the related country.
➡ adjustMentionedBrightness(float, default: 0.5)
Sets the brightness of the mentioned country.
Loads data to the controller of Gio and overrides previous data synchronously.
Clear data in the globe, and remove spline system and moving particle.
switch data set when a data group is added.
Loads data to the controller of Gio and overrides previous data asynchronously.
➡ liveLoad(url, callback, duration)
Loads data to the controller periodically.
Close live load function.
Get the reference of three.js scene object.
Get the reference of Stats.js panel object.
Fired when selected country changes.
Change currently selected country.
- For quick start, checkout Getting Started
- To learn more about the Basic Elements
- To see the full API document in Markdown format, checkout APIs
- To contribute to Gio.js's code base, read Developer Guide
- Checkout Gio's official website giojs.org for everything above and plus lots of live examples
Thanks goes to these wonderful people (emoji key):
syt123450 💻 📖 💡 |
Botime 💻 📖 |
Mutian Wang 💻 📦 🎨 👀 |
Chenhua Zhu 💻 🚇 🤔 👀 |
Qi(Nora) 💻 🎨 📖 ✅ |
bouyuc 📖 ✅ |
Xiaoran Lin 💻 🎨 💡 👀 |
|---|---|---|---|---|---|---|
Leon 💻 🎨 💡 |
Alexis 💻 🐛 |
This project follows the all-contributors specification. Contributions of any kind welcome!


