Introductory tutorial on graphical display of geographical information in R, to contribute to teaching material. For the context of this tutorial and a video introduction, please see here: http://robinlovelace.net/r/2014/01/30/spatial-data-with-R-tutorial.html
All of the information needed to run the tutorial is contained in a single pdf document that is kept updated: see github.com/Robinlovelace/Creating-maps-in-R/raw/master/intro-spatial-rl.pdf.
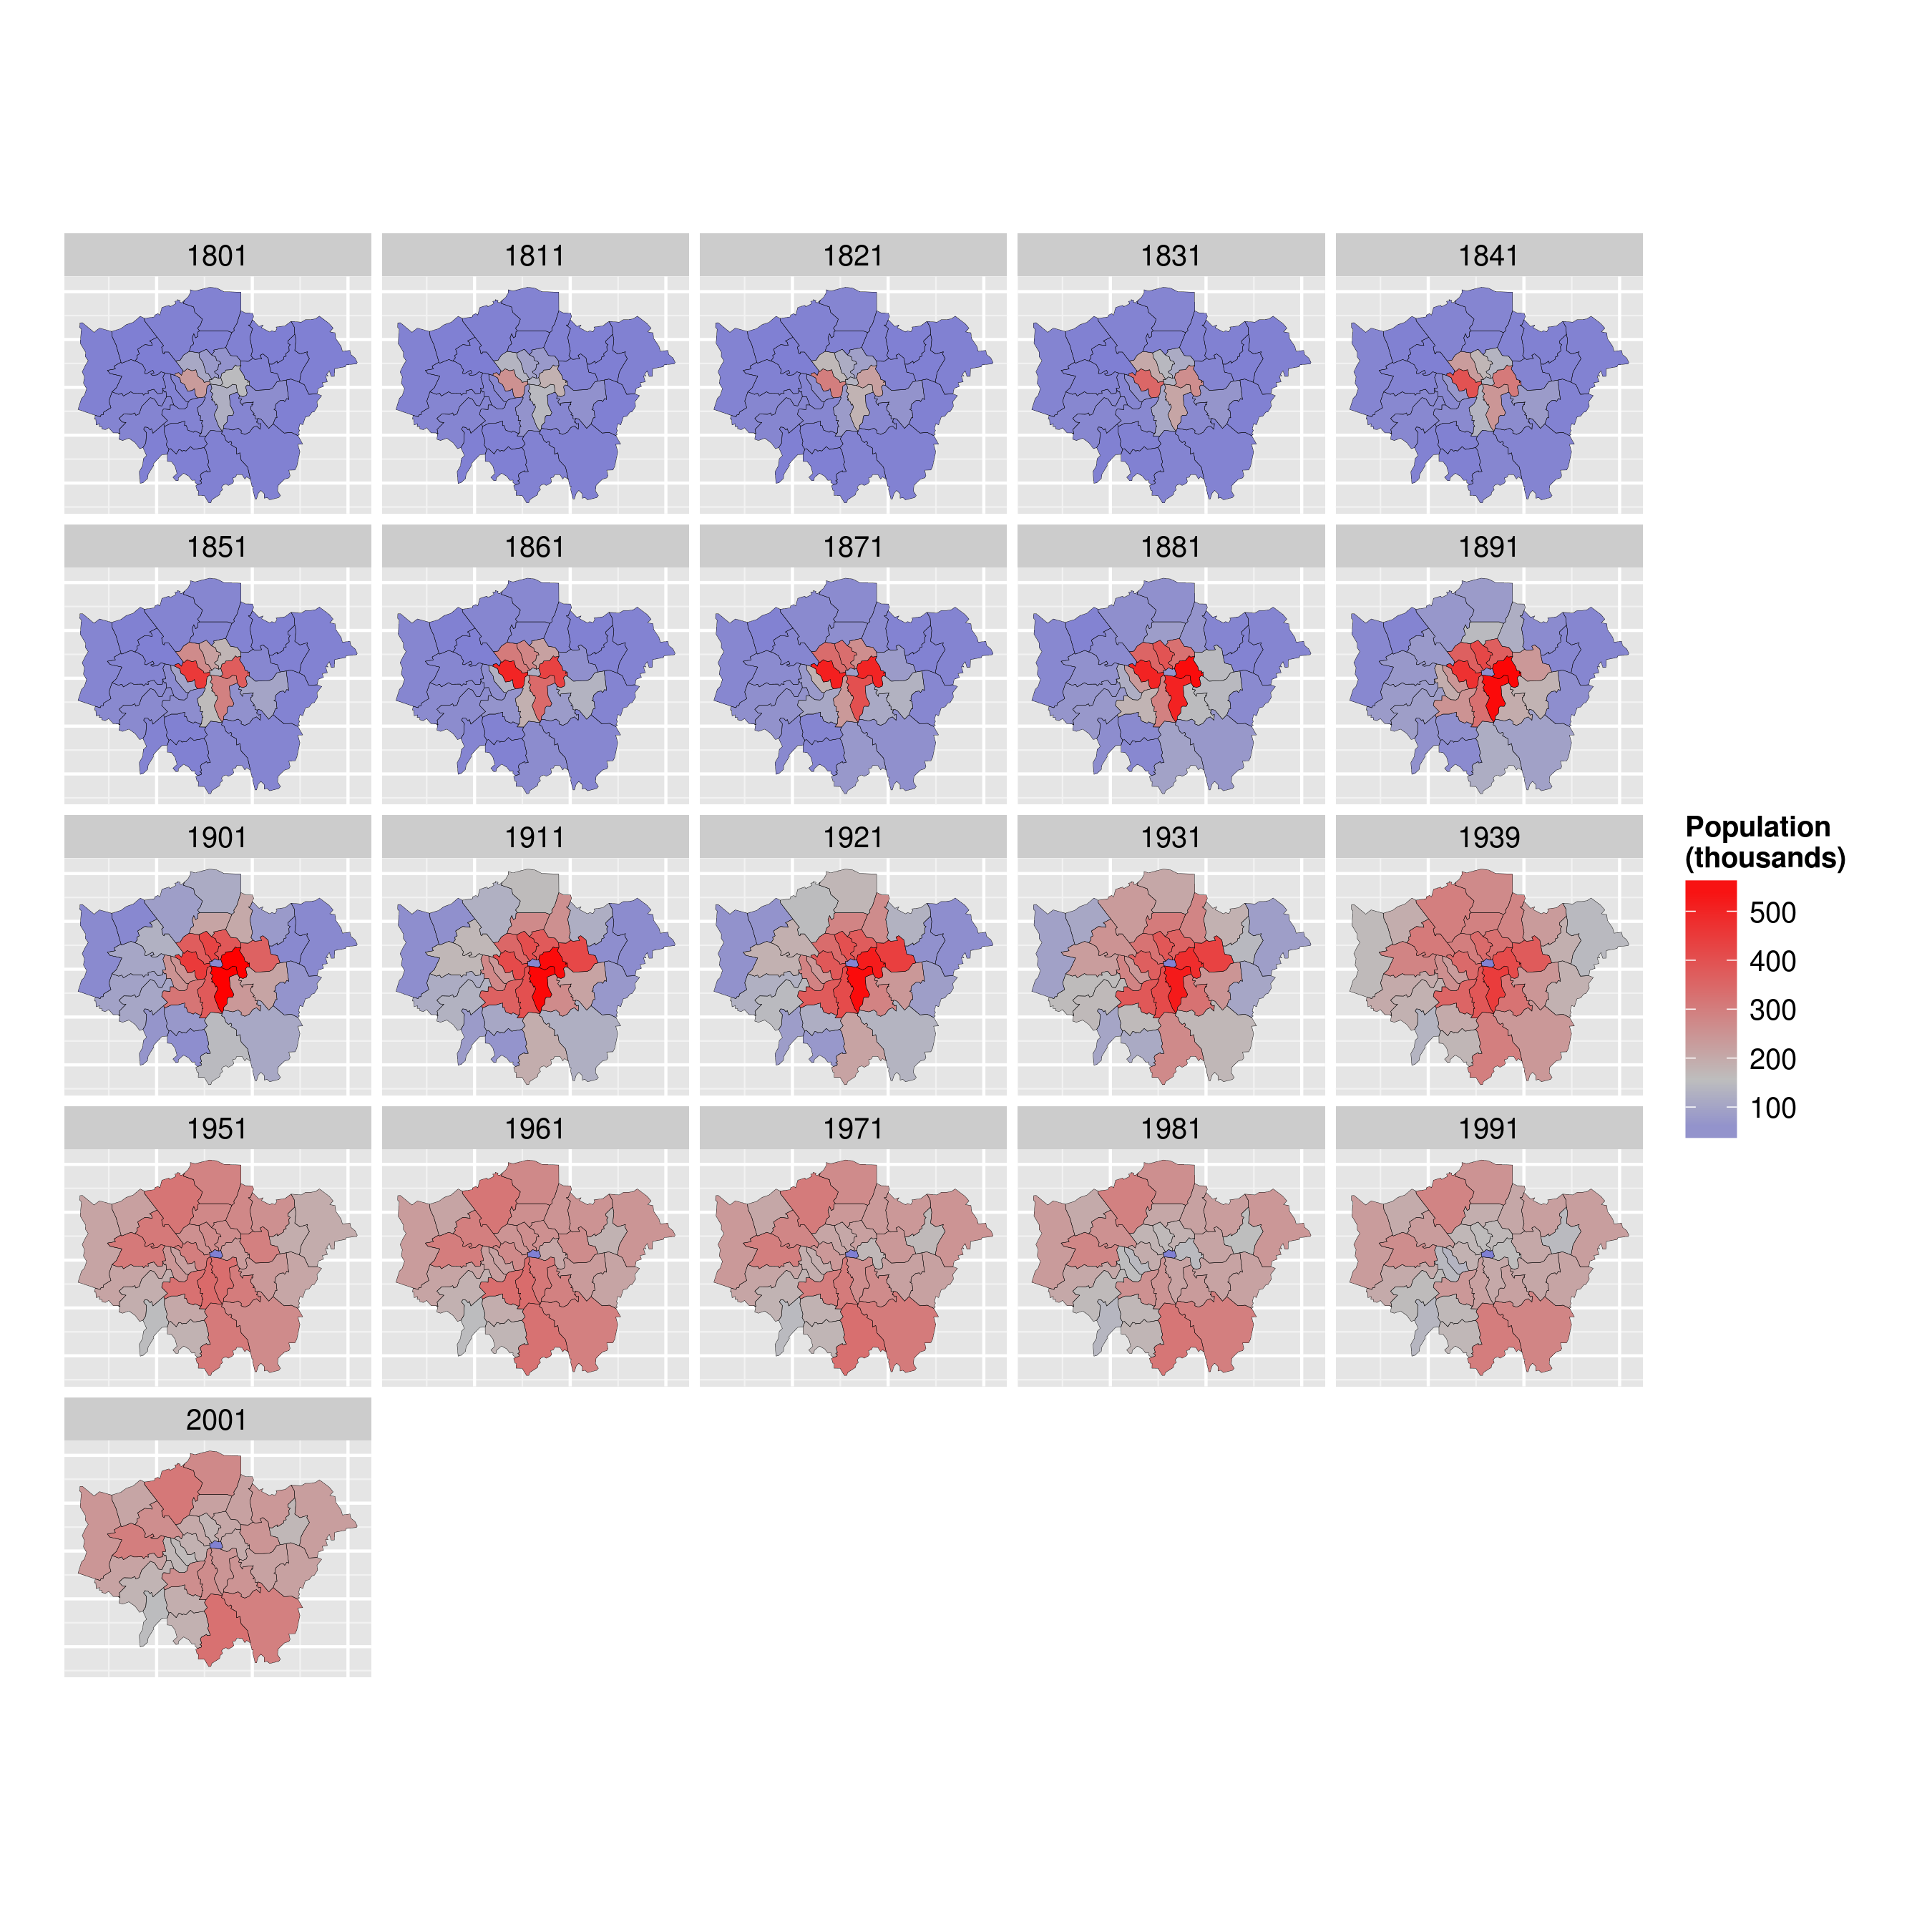
By the end of the tutorial you should have the confidence and skills needed to convert a diverse range of geographical and non-geographical datasets into meaningful analyses and visualisations. Using data and code provided in this repository all of the results are reproducible, culminating in publication-quality maps such as the faceted map of London's population below:
If you have any feedback on this tutorial please let us know via email or via this repository. Contibutions to the .Rmd file (intro-spatial.Rmd) are welcome. Happy mapping!