This repository contains reproducible python source code for the final project of the team Do not miss your value at Skoltech Machine Learning course. Team members:
- Vladislav Molodtsov
- Irina Shushpannikova
- Stepan Vasilev
- Kelvin Kutsukutsa
- Zhadyraiym Akunova
All the experiments are issued in the form of pretty self-explanatory jupyter notebooks. For convenience, raw and processed datasets used in the experiments are placed in this repository as well. The structure of the repository should be preserved in order to run all code in notebooks without changing relative paths to the files. Obtained results are included into repository as .csv files and .png graphs and diagrams. For proper display of the pictures in this README, we recommend to switch to the Light theme in GitHub settings.
Data preprocessing.ipynb-- preprocessing of raw datasets: drop missing values and useless columns, rename target asTarget;Experiments.ipynb-- main code for the pipelines of experiments; contains all implemented functions for adding noise, introducing missing values, imputing missing values, evaluating models and so on;Results processing.ipynb-- notebook for processing obtained results and building graphs and diagrams;
We used Python 3.7.9 and the following versions of the libraries:
numpy 1.21.5pandas 1.3.3scipy 1.7.3sklearn 1.0.2matplotlib 3.3.2lightgbm 3.3.2miceforest 5.3.0
/Raw datasets-- raw datasets for both regression and classification problems with links to the sources;/Datasets-- processed datasets for both regression and classification problems; for convenience, the directory is divided into two parts:Classificationwith datasets for classification problem andRegressionwith datasets for regression problem; in total, there are 2 datasets for classification and 3 datasets for classification.
| # | Dataset name | Problem | Description | Shape | Target |
|---|---|---|---|---|---|
| 1 | Air temperatures | Regression | Predict air temperature by external data | (7588, 23) | Min value 17.4 Max value 38.9 |
| 2 | Air quality | Regression | Identify air quality by sensors data | (827, 13) | Min value 0.4 Max value 1.5 |
| 3 | Parkinson disease | Regression | Predict Parkinson disease by voice measurements | (5875, 22) | Min value 7 Max value 55 |
| 4 | Wine quality | Classification | Identify wine quality by physicochemical tests | (4898, 12) | 7 classes, from 5 to 2198 elements |
| 5 | Robot's sensors | Classification | Predict action by sensors data | (5455, 25) | 4 classes, from 328 to 2205 elements |
/Results--.csvfiles with the results of carried out experiments; contains 3 files:results_noise_only.csvfor experiments with noise only,results_drop_only.csvfor experiments with missing values only, andresults_noise_and_drop.csvfor experiments with both noise and missing values;/Graphs--.pngfiles with graphs and diagrams reflecting the results of the experiments; there are 4 families of pictures:
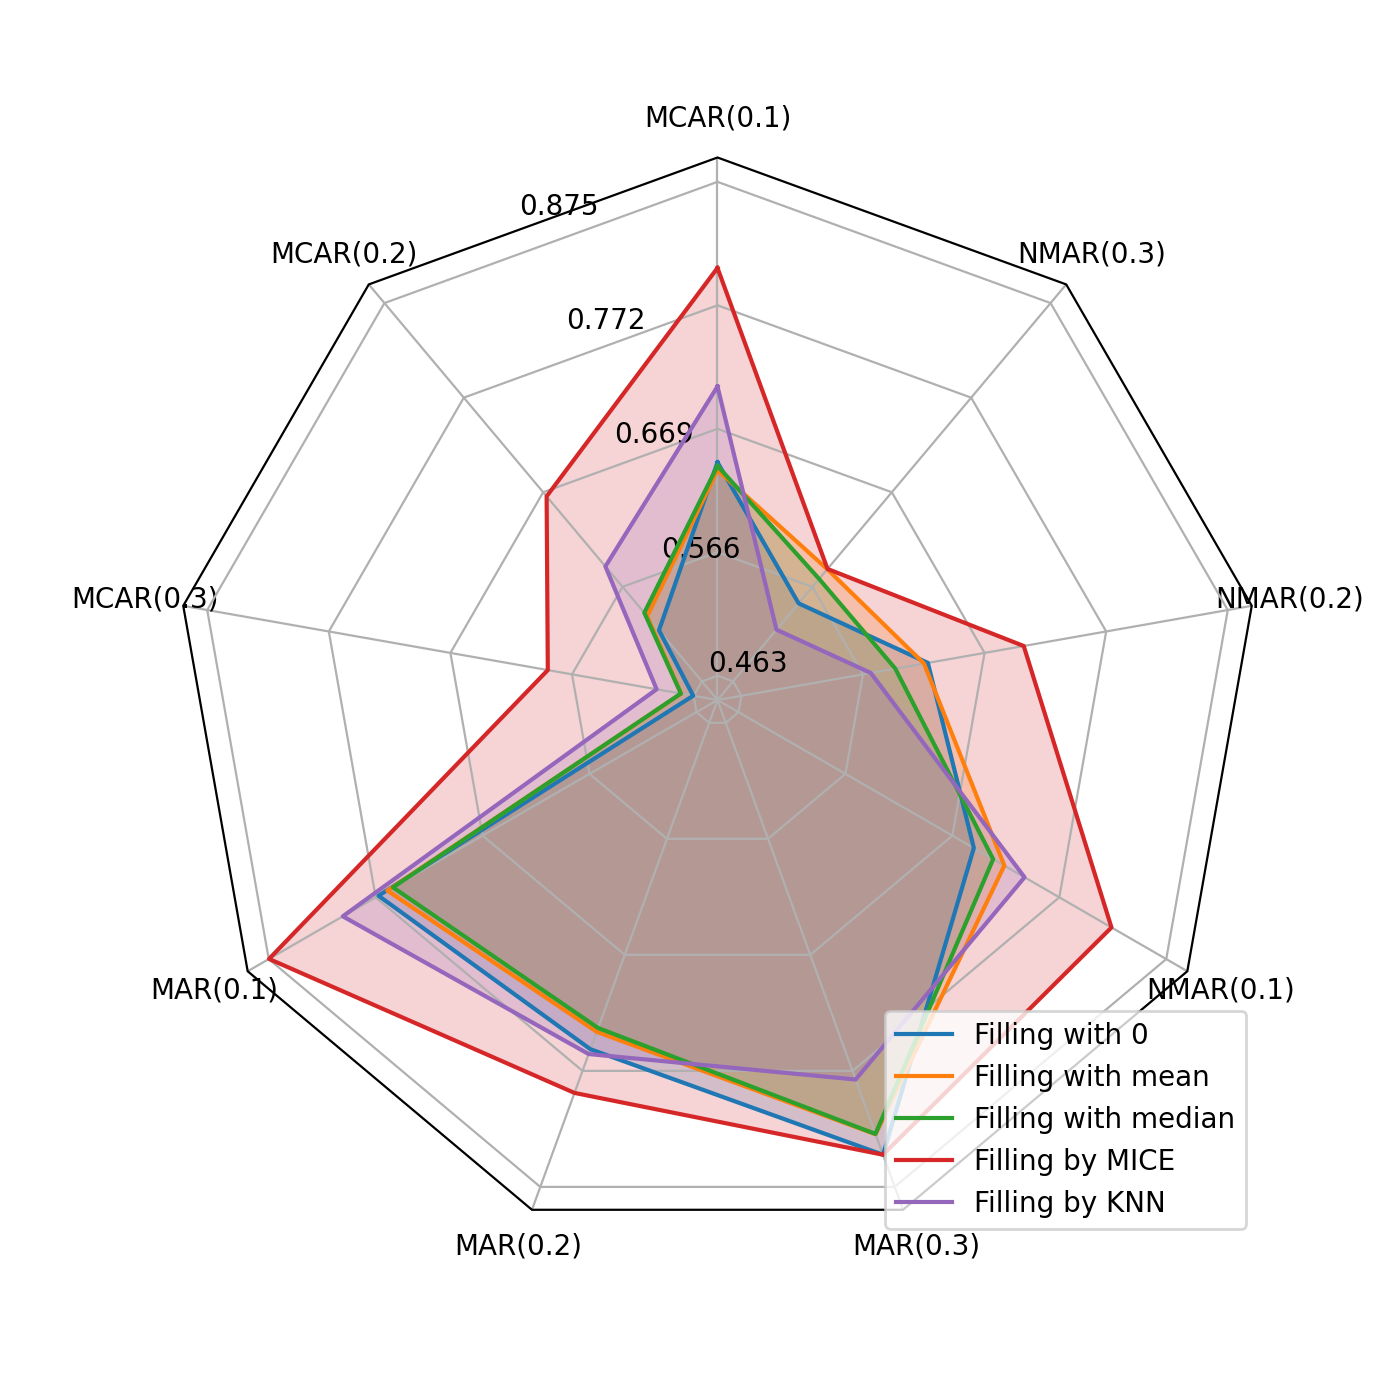
noise_reg_T_dataset_N_M.png-- dependency of models score on the noise level in the dataset, whereTisTruefor regression andFalsefor classification,Nis number of dataset,MisSNRfor Additive White Gaussian Noise (AWGN) added to the dataset orpfor random changing every value in the dataset to the other one;drop4model_reg_T_dataset_N_drop_L_model_K.png-- dependency of distortion metrics on the rate of introduced missing values , whereLis1,2, or3for different missing scenarios (Missing Completely At Random (MCAR), Missing At Random (MAR), Not Missing At Random (NMAR), respectively),Kis ML model number;drop_diagram_reg_T_dataset_N.png-- radar diagrams for comparing different imputation methods in different missing scenarios;noisy_drop_diagram_reg_T_dataset_N_noise_Z_S.png-- radar diagrams for comparing different imputation methods in different missing scenarios with different level of noise, whereZis1for AWGN and2for random changing,Sis level of noise in decibels or in dropping probability, respectively.
Report.pdf-- written reportPresentation.pdf-- presentation
| Dataset name | Problem | Score name | Linear | DT | RF | LightGBM | |
|---|---|---|---|---|---|---|---|
| 1 | Air temperatures | Regression | MAPE | 0.04 | 0.05 | 0.04 | 0.04 |
| 2 | Air quality | Regression | MAPE | 0.06 | 0.10 | 0.08 | 0.06 |
| 3 | Parkinson disease | Regression | MAPE | 0.11 | 0.12 | 0.11 | 0.11 |
| 4 | Wine quality | Classification | F1-micro | 0.52 | 0.51 | 0.53 | 0.52 |
| 5 | Robot’s sensors | Classificationч | F1-micro | 0.68 | 0.98 | 0.99 | 0.99 |
Radar diagrams for comparing different imputation methods in different missing scenarios with different level of noise:
- LightGBM - Gradient Boosting implementation;
- miceforest - MICE implemetation;
- adasegroup - ML course at Skoltech;
- Wasserstein2GenerativeNetworks - used example of good repo structure;


