In this repository, I have done Exploratory Data Analysis and feature engineering for Black Friday Dataset.
- Python
- Pandas
- Matplotlib
- Seaborn
import pandas as pd
black_friday = pd.read_csv('C:/Users/masoo/Downloads/black friday - Copy.csv')
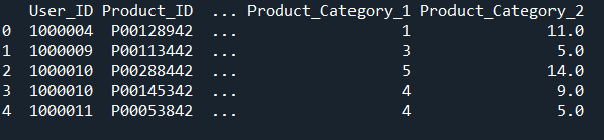
black_friday.head()
black_friday.shape
black_friday.columns
['User_ID', 'Product_ID', 'Gender', 'Age', 'Occupation', 'City_Category', 'Stay_In_Current_City_Years', 'Marital_Status', 'Product_Category_1', 'Product_Category_2', 'Product_Category_3']
black_friday.isnull().sum()
black_friday.isnull().sum().mean()*100
black_friday.isnull().sum()
black_friday.isnull().sum().mean()*100
import matplotlib.pyplot as plt
plt.figure(figsize=(10,6))
sns.heatmap(black_friday.isnull(), yticklabels=False, cbar = False, cmap = 'viridis')
plt.title('Null Values present in the dataset',fontsize=14)
plt.show()

The 'User_ID' column is of no use in describing the dataset and we dont need product category 3 column becouse 70 % data is missing, so that i am going to remove 'User_ID' and 'Product_Category_3' column.
black_friday.drop('Product_Category_3',axis = 1, inplace = True)
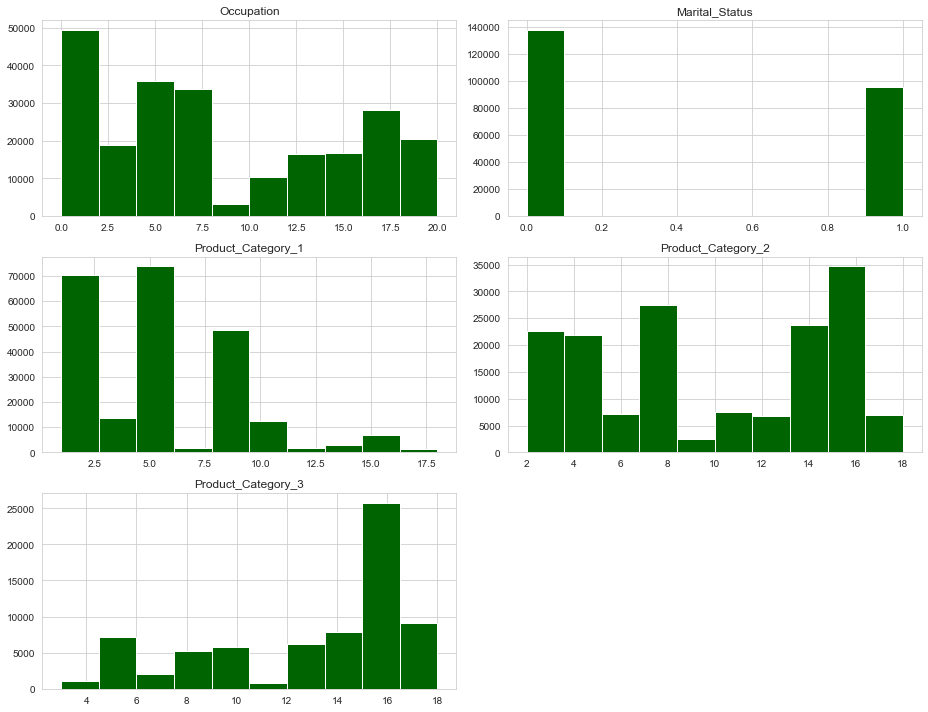
Histogram of features in the dataset
sns.set_style('whitegrid')
black_friday.drop('User_ID',axis=1).hist(figsize = (13,10), color = 'darkgreen')
plt.tight_layout()
plt.show()
plt.figure(figsize=(10,6))
sns.heatmap(black_friday.corr(), annot = True, cmap='coolwarm',linewidths=1)
plt.show()

black_friday.Product_Category_2.fillna(0, inplace = True)
black_friday.Product_Category_3.fillna(0, inplace = True)
black_friday.Gender.unique()
black_friday.Gender.value_counts()
black_friday.Age.value_counts()
black_friday.Age.duplicated().sum()
black_friday.Age.unique()
black_friday.Age = black_friday.Age.str.replace('0-17','26-35').replace('26-35','18-25').replace("18-25", "< 35").replace('36-50','46-50').replace('46-50','51-55').replace('51-55','55+').replace('55+','>35')
import seaborn as sns
sns.catplot( data = black_friday, x ='Age', kind = 'count')

black_friday.info()
black_friday.City_Category.unique()
black_friday.City_Category.value_counts()
sns.catplot(data = black_friday, x = 'City_Category', kind = 'count')

black_friday.Stay_In_Current_City_Years.unique()
black_friday.Stay_In_Current_City_Years.value_counts()
sns.catplot(data = black_friday, x = 'Stay_In_Current_City_Years', kind = 'count')

black_friday.Marital_Status.nunique()
black_friday.Marital_Status.value_counts()
sns.catplot(data = black_friday, x = 'Marital_Status', kind = 'count')
plt.figure(figsize=(10,6))

black_friday.Product_Category_1.isnull().sum()
black_friday.Product_Category_1.value_counts()
black_friday.Product_Category_1.nunique()