Charts Addons
The library extends basic Bar chart of Charts framework.
The extention of bar chart visually aggregates overlapped bars under single bar of extreme values (min/max or median) of them, e.g. for discrete data, like temperature, on timeline, it usefull to show the bars with constant width, and to aggregate them if they overlap each other.
Usage
The framework extends Charts framework, so it is mainly inherits API of the Charts. To add the framework into your project:
- add Charts framework into you project, please follow instruction on Charts
- add Carts_Addons.framework for you target in "Linked Frameworks and Libraries"
For slightly customization you can change attributes of AggregatedBarChartView:
-groupWidth: to specify bar width
-groupMargin: to specify margin betwen bar
-barBorderRoundedCorner: to specify rounding for corners
Protocol AggregatedBarChartViewMarkerPositionDelegate provides interface to get position of the marker according to the selected bar. -func getMarkerPosition(highlight: Highlight) -> CGPoint
Example of using you can find at Charts_Addons_Demo project.
Screenshots
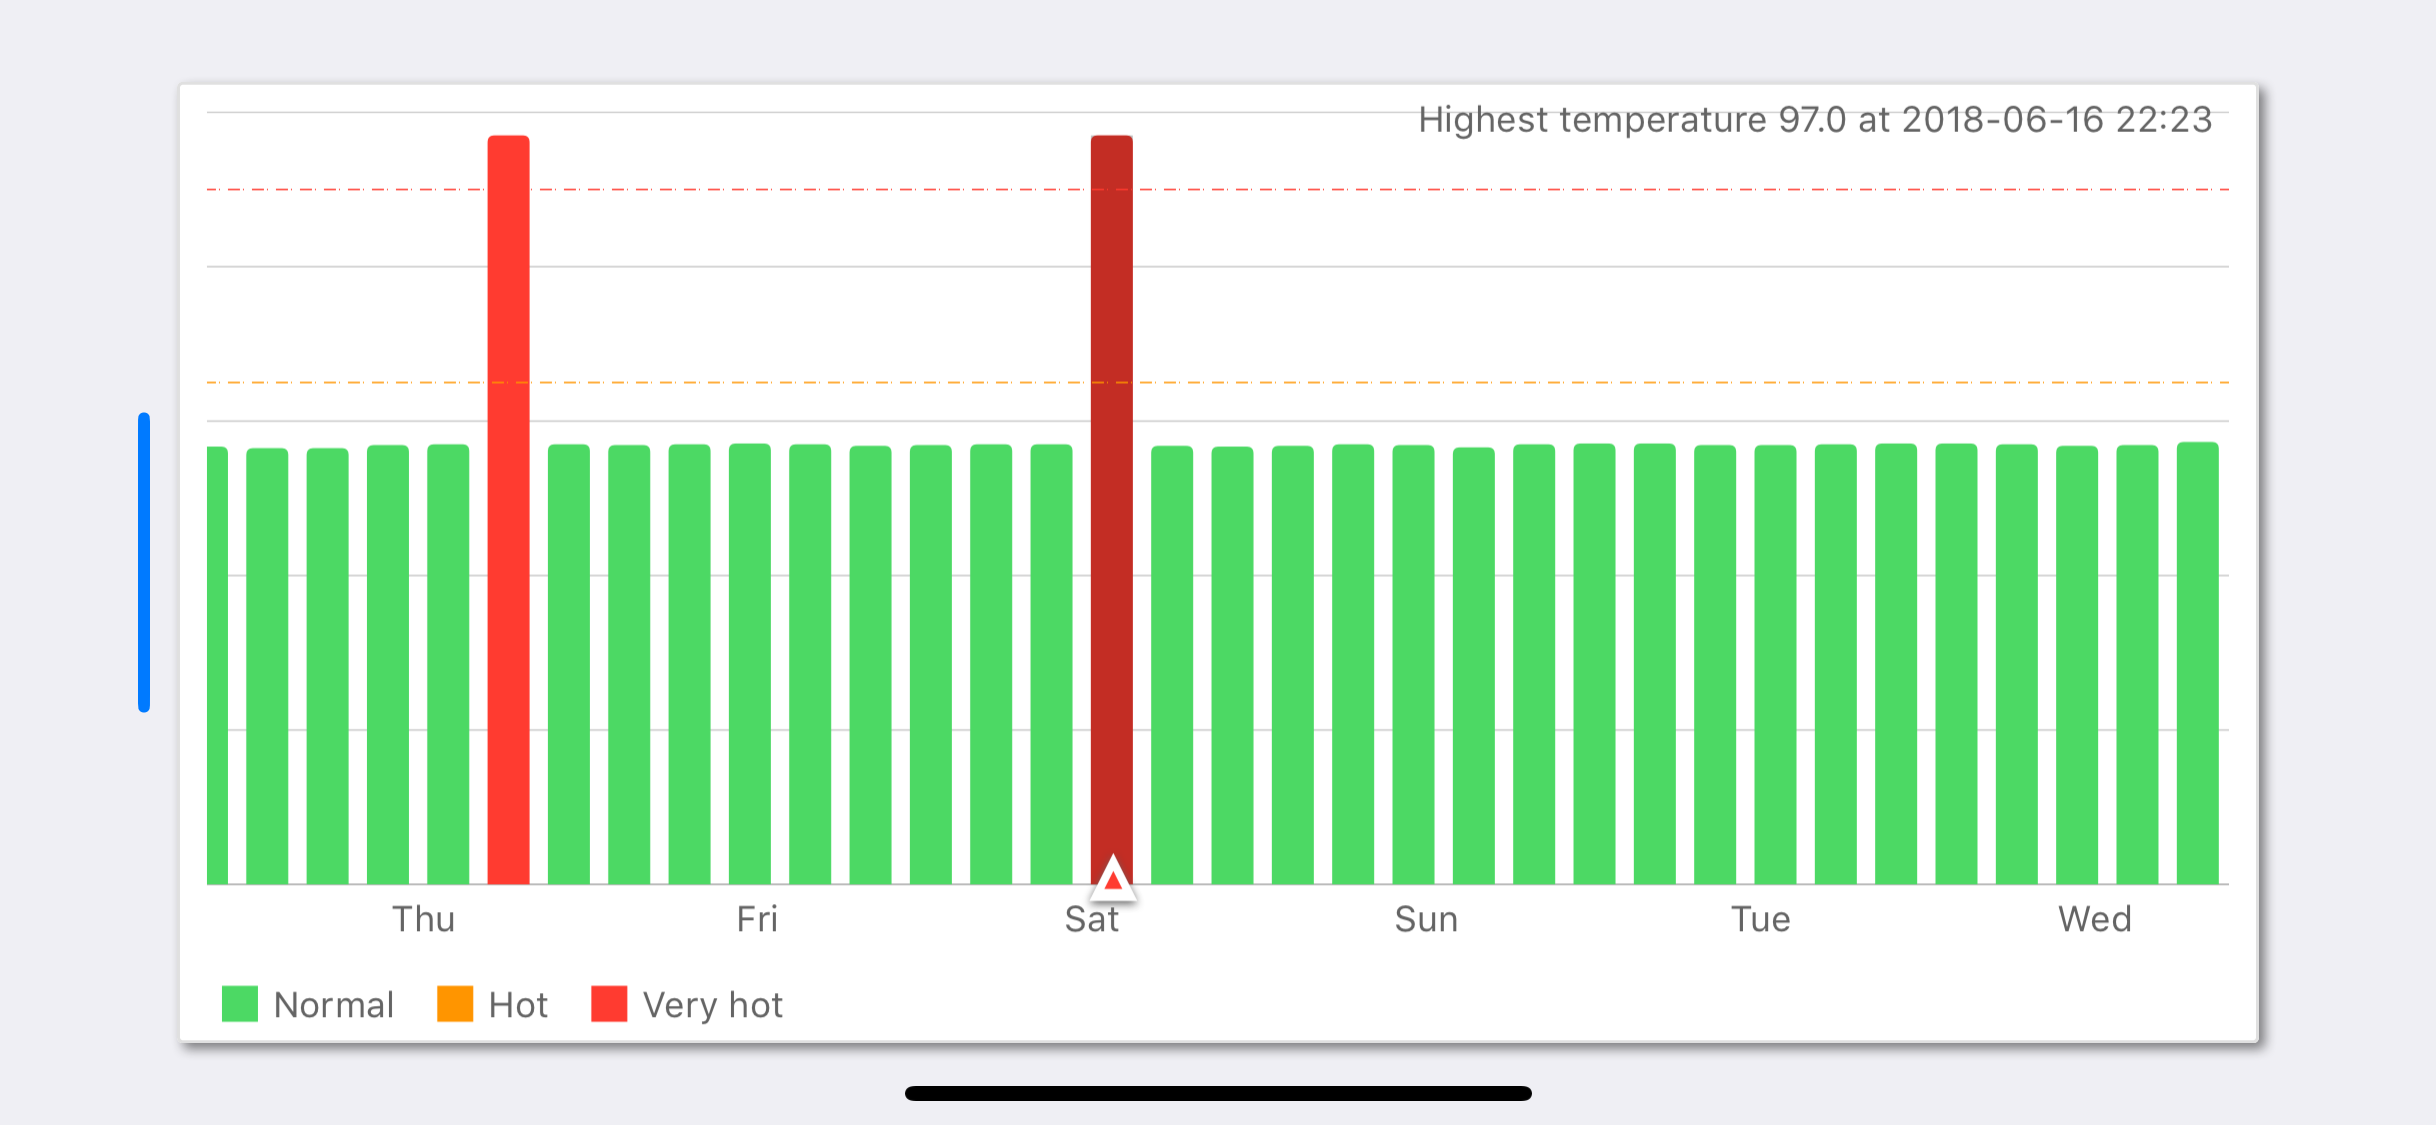
- Timeline presents 7 days period
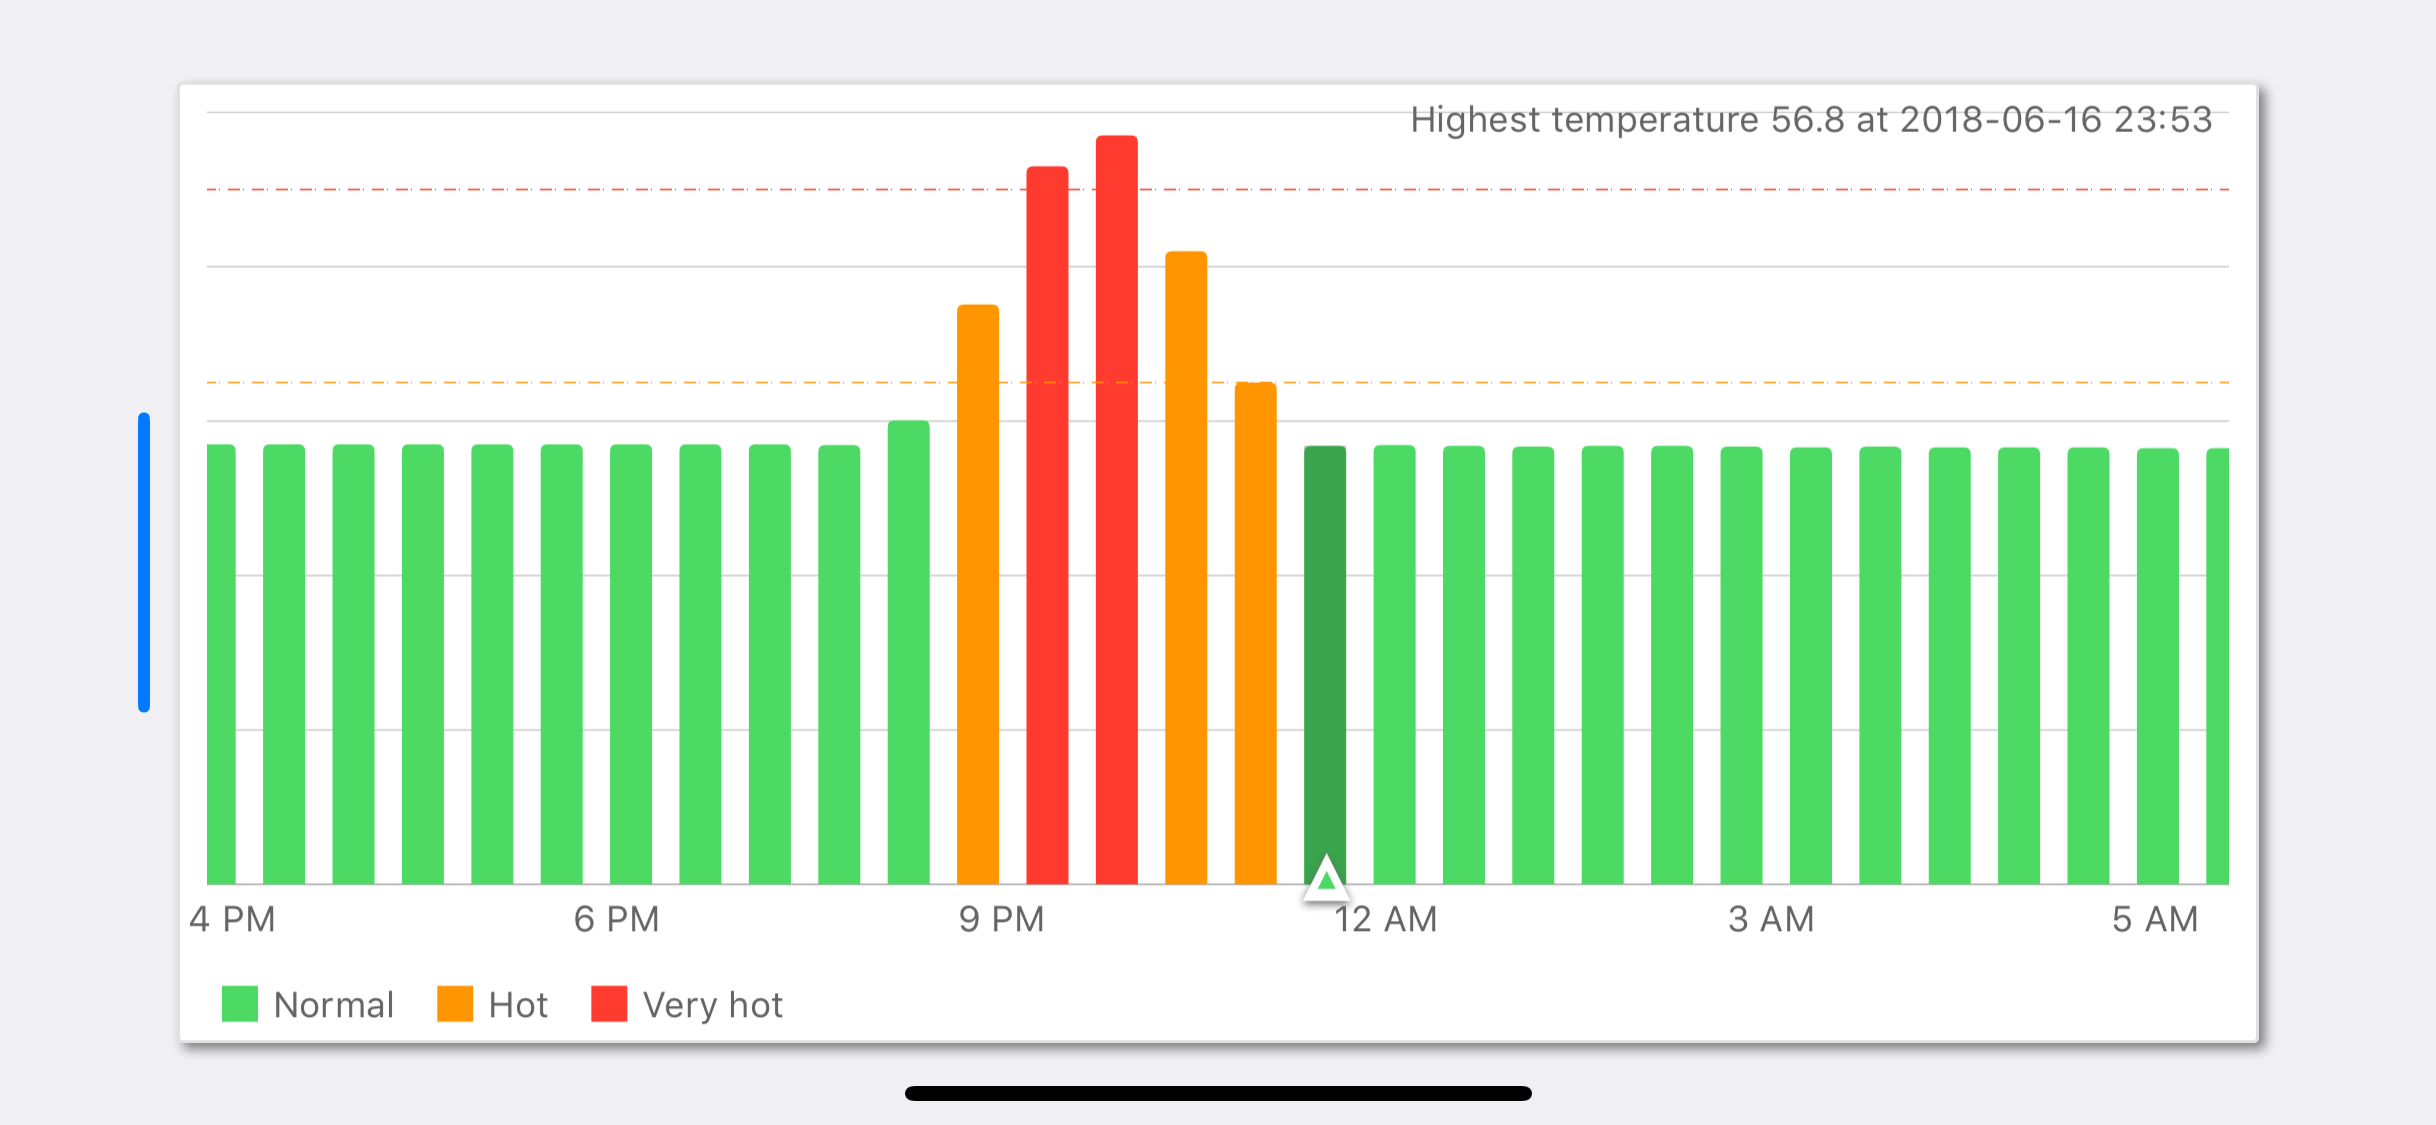
- Scaled timeline to presents 1 day period
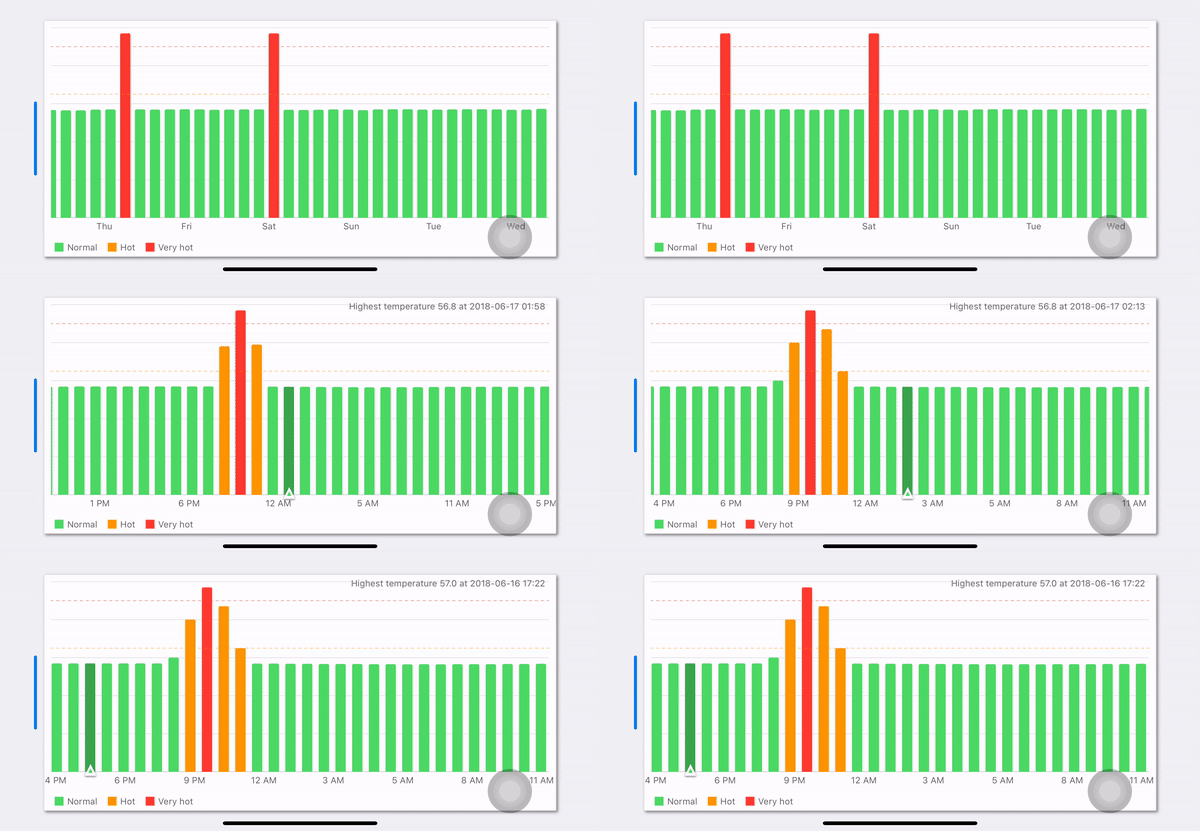
- Scaling timeline to presents 1 day period
License
This project is licensed under the terms of the MIT license.


