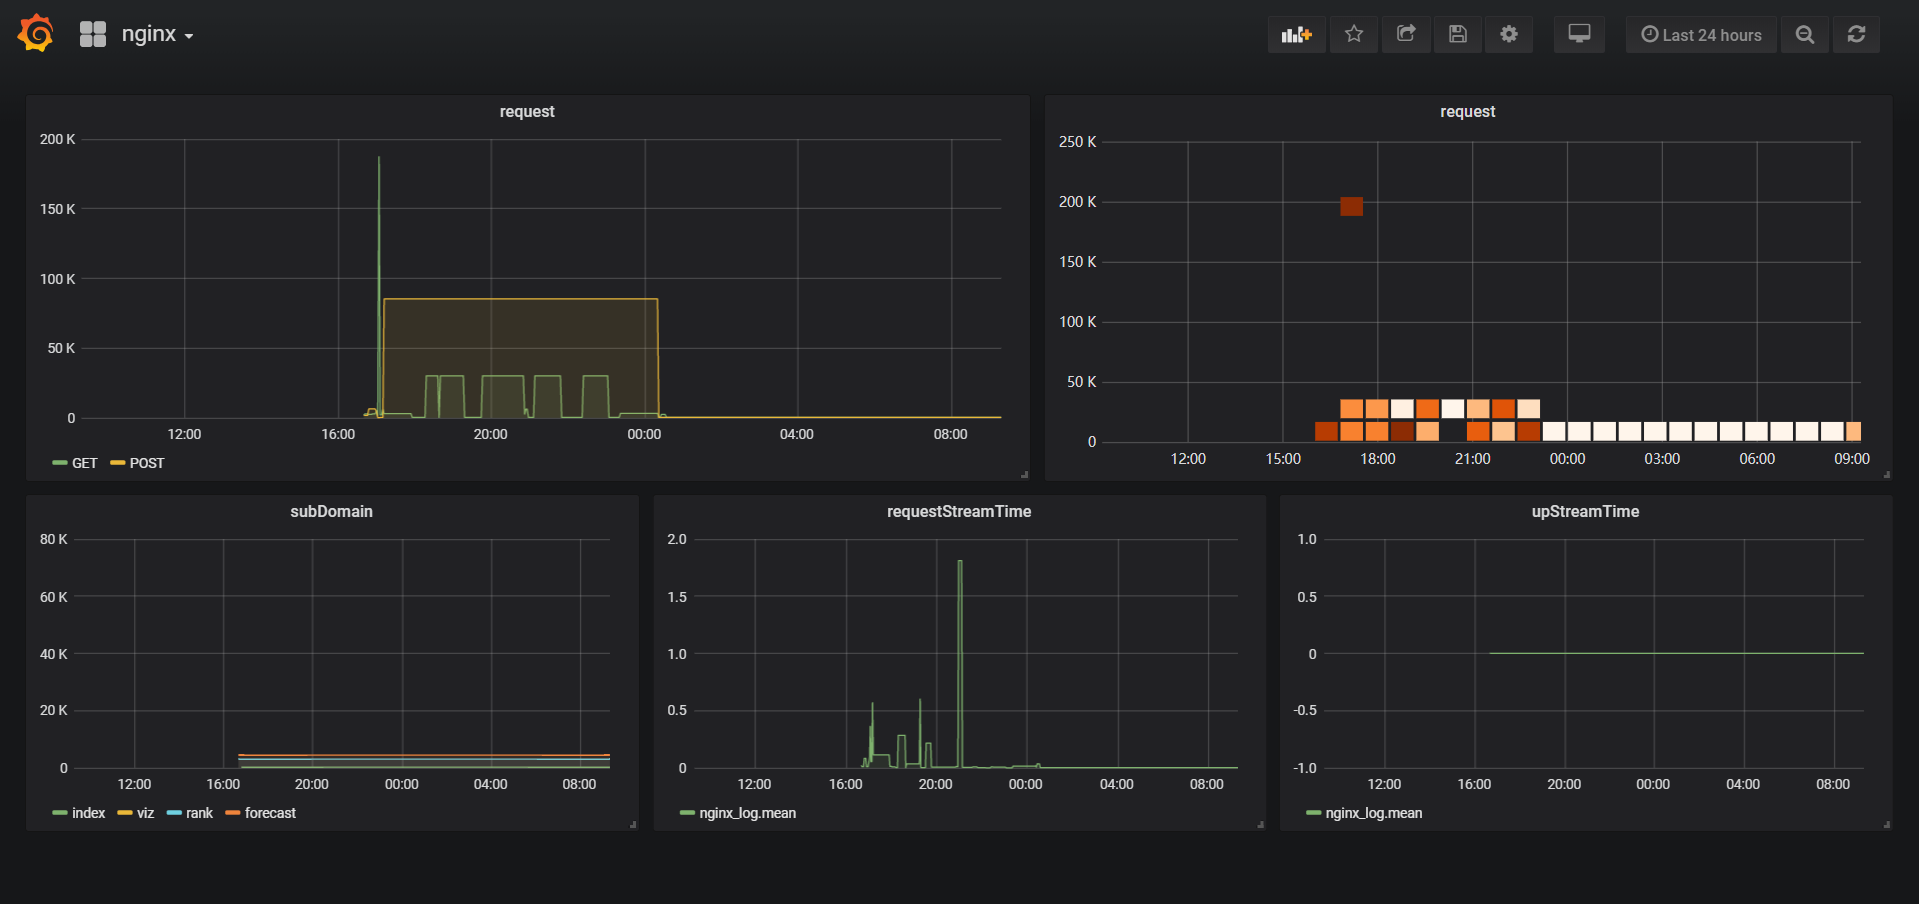
A simple monitor for analyzing nginx log.
This Project implemented as two separate parts:
- Read, clean, process and append the each log to the databse from nginx log file "access.log". This part is implemented in Go.
- Fetch the relevant information from the databse and visualize the data element by using Grafana.
- Get influxDB in Go
$ go get github.com/influxdata/influxdb
- Install and run InfluxDB
$ docker pull influxdb
$ docker run influxdb
- Install and run Grafana
$ wget https://s3-us-west-2.amazonaws.com/grafana-releases/release/grafana_5.3.2_amd64.deb
$ sudo dpkg -i grafana_5.3.2_amd64.deb
$ sudo service grafana-server start
- Run
procrss.goand open the follwing url , then you will see the visualization
https://localhost:3000
- Open
https://localhost:9999/monitorwill return monitor's general info with json
{
	"handleLine": 999,
	"tps": 123,
	"readChanLen": 456,
	"writeChanLen": 456,
	"runTime": "8h47m51.6090878s",
	"errNum": 123
}

