Covid-19 Pandemic in Sweden
A data analysis of the Covid-19 pandemic in Sweden with Python and Pandas.
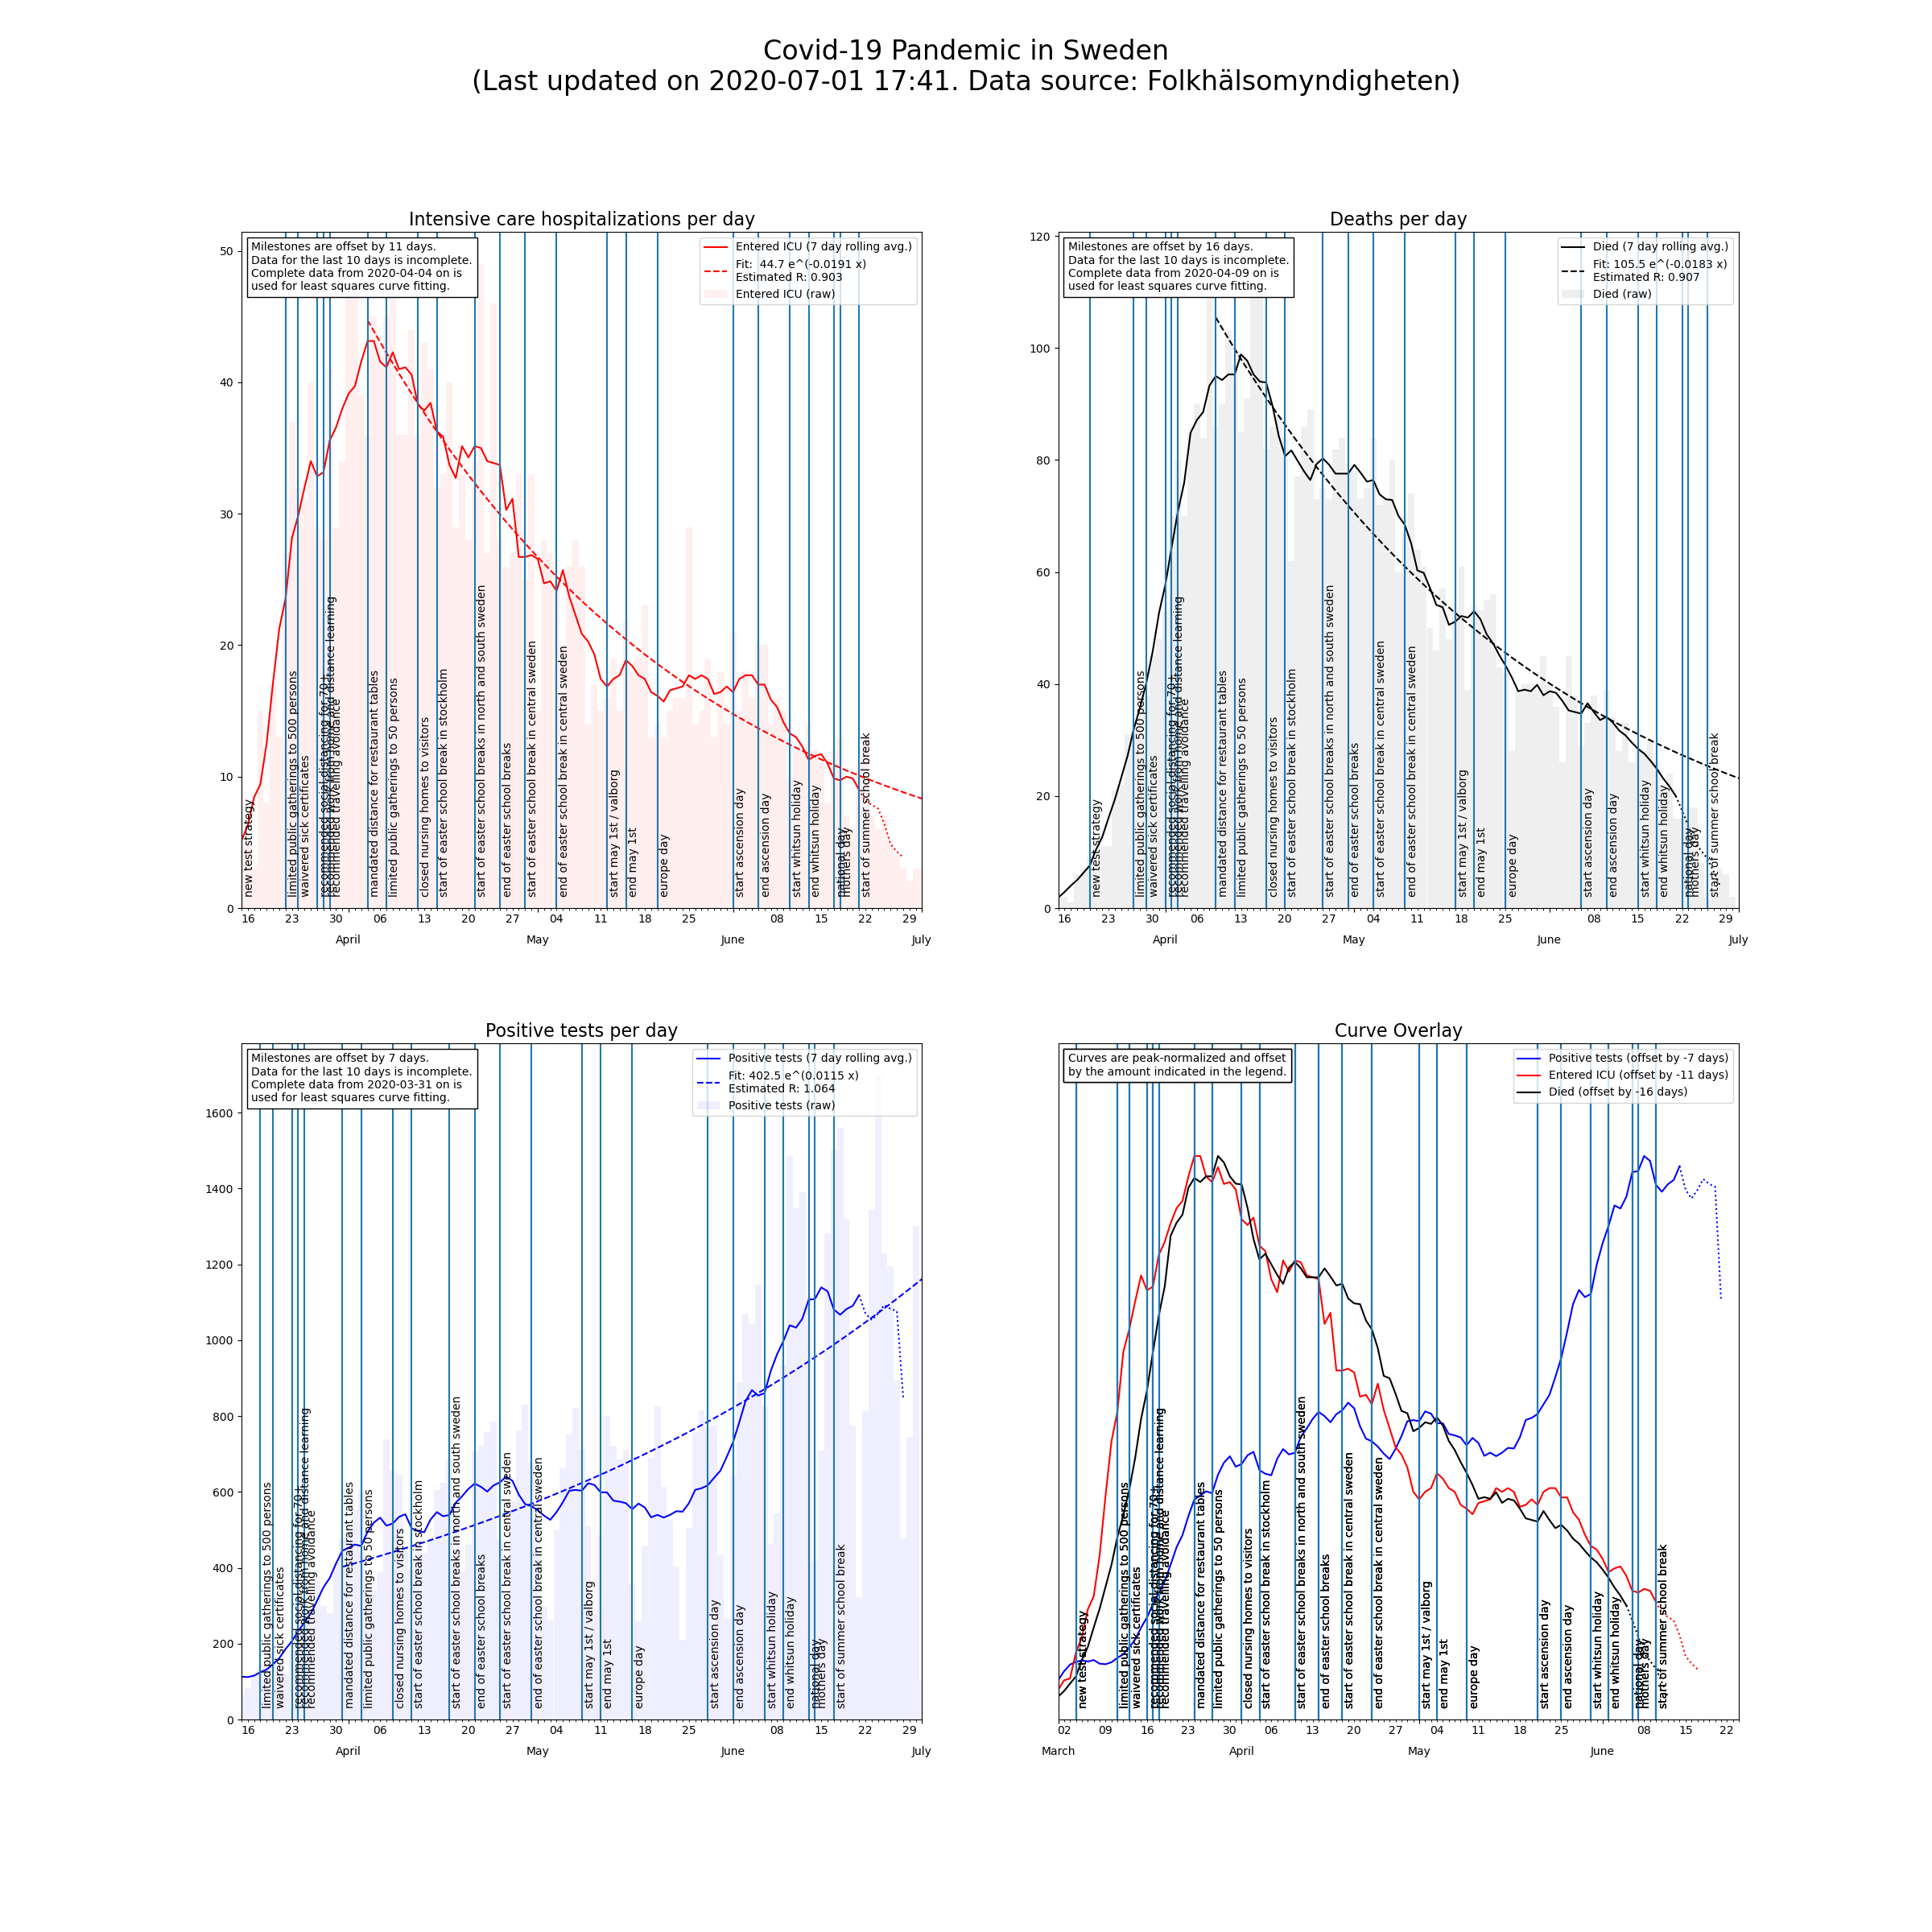
Method: plot the hospitalization and death rate along with Public Health Agency responses shifted ahead in time. Use eyeballing to learn the facts. Fit an exponential curve to the cases following the peak of the pandemic to estimate the current reproduction rate R.
The only two parameters used in this analysis are the time shifts applied to the Public Health Agency responses:
- the mean number of days between infection and ICU admission: 11 days [ICUREG2020],
- the mean number of days between infection and death: 17 days [WORLDO2020].
These two parameters are also confirmed by the overlay of two curves.
Data source: Folkhälsomyndigheten [1]. Response milestones: Wikipedia [2]. School Holidays: Edarabia [3].
Results
It emerges from this analysis that while many factors may have contributed to the decline in Covid-related deaths in Sweden the single smartest move was distancing in restaurants.
Covid spreads fastest by talking in closed spaces. The super-spreading events in Germany: one carnival session, one beer fest, one church choir, one ski bar, also confirm this fact.
It also emerges that the dumbest move is closing schools. Children have more contact with their grandparents when schools are closed. The mobility gained by the general population while schools are closed more than outweighs the reduced spread between children. Fortunately Sweden never blundered on that one, but you can clearly see from the plots that during the Easter school vacations Covid spread much faster than at other times.
It also emerges that the number of infections as determined by testing has nothing to do with the actual progression of the pandemic. While the other two curves agree pretty well, the test curve is way off.
R is calculated in the most simple way and is informal only. There are way too many different ways to calculate R to make R a meaningful number. [JING2011]
The big picture: https://raw.githubusercontent.com/MarcelloPerathoner/covid-19/master/docs/sweden.png
Footnotes / Bibliography
| [1] | Folkhälsomyndigheten Covid dashboard. https://experience.arcgis.com/experience/09f821667ce64bf7be6f9f87457ed9aa |
| [2] | Wikipedia https://en.wikipedia.org/wiki/COVID-19_pandemic_in_Sweden#Measures |
| [3] | Edarabia https://www.edarabia.com/school-holidays-sweden/ |
| [ICUREG2020] | The Swedish Intensive Care Registry (SIR) https://www.icuregswe.org/en/data--results/covid-19-in-swedish-intensive-care/ |
| [WORLDO2020] | Worldometers: Coronavirus (COVID-19) Mortality Rate https://www.worldometers.info/coronavirus/coronavirus-death-rate/ |
| [JING2011] | Jing Li, Daniel Blakeley, and Robert J. Smith?. The Failure of R0. 2011. Computational and Mathematical Methods in Medicine. https://www.hindawi.com/journals/cmmm/2011/527610/ |