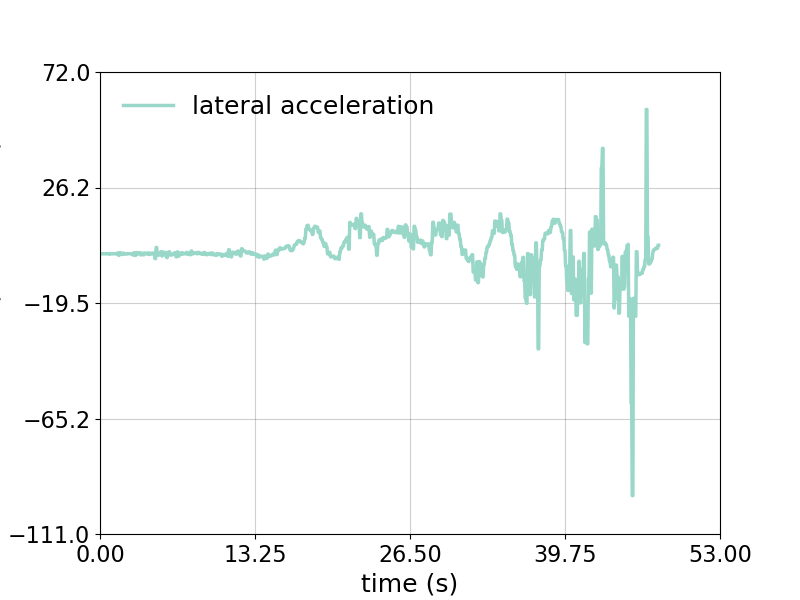
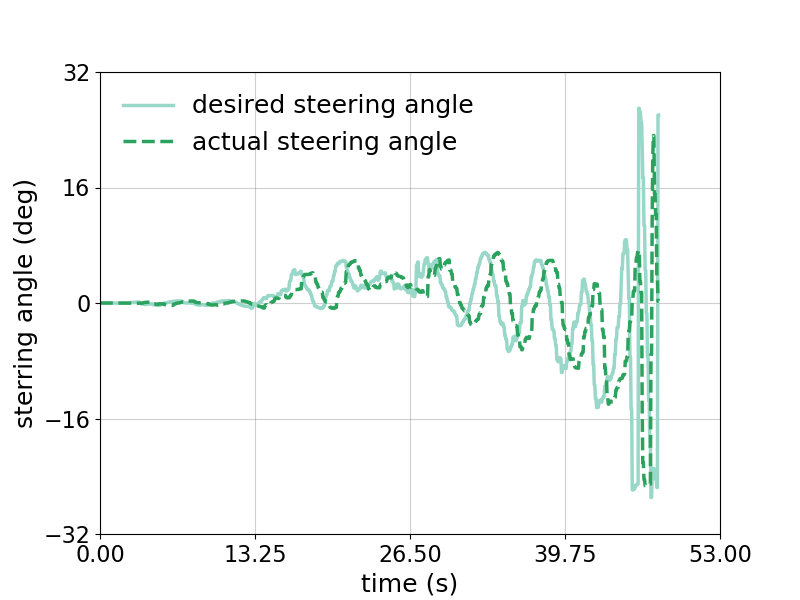
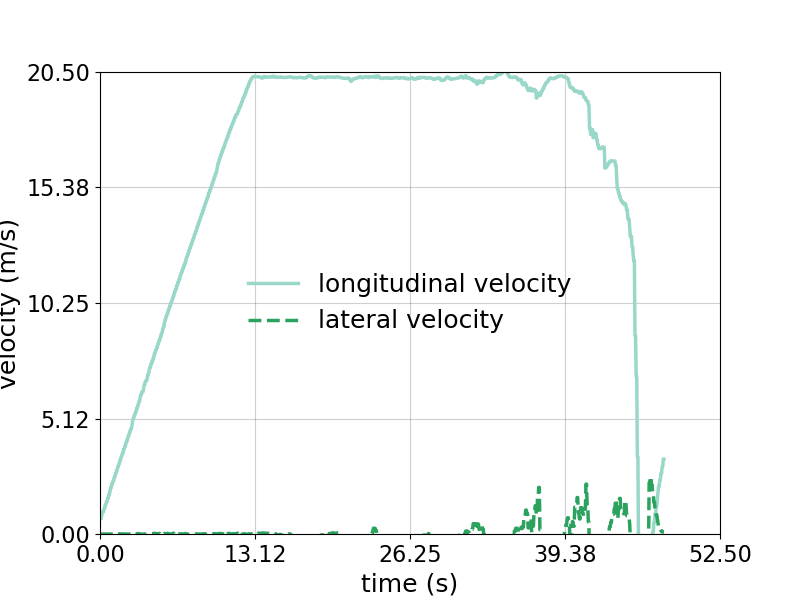
This repository gives examples for better plotting configuration in Matlab and Python. It is not a tutorial but an exhibition to show you some interesting usages when I'm working on daily figure processing. I will also give a list of references for further exploration.
- easy_plot
There are two ways to change a figure's properties, one is to change the default settings which is a permanent approach, the other is to change the properties of the specific figure directly. If you are afraid of making a mess by changing the default settings, you may like the second one, and it is recommended to do this by calling a user-defined function by yourself if you have to configure lots of properties for each single figure, which leads to clean code styles.
- basic_example gives you an example using the second approach to change figures' properties.
fig_plot is an example to show how to plot figure based on csv file in a batch approach. Figure property configuration is similar to basic_example.
Parameter configuration:
save_enable_xx: whether to save certain figure to file or not.image_path: choose the path to save your figure. The default setting is the current folder.global_path_fileandstate_name: the path to search certain groups of files.
And it is worth noting that you can specify the color of your figure as an RGB triplet in Matlab. See how to choose color below for more recommendation to choose harmonious color.
% plot color setting
plot(time,des_delta,...
                'LineStyle','-',...
                'LineWidth',1.5,...
                'Color',[189, 189, 189] / 255,... % you can also use 'r', 'g' etc. to call for the short name of built-in colors.
                'MarkerEdgeColor','b',...
                'MarkerFaceColor','b',...
                'MarkerSize',5), hold on;

% current axis color setting
ax1 = gca;
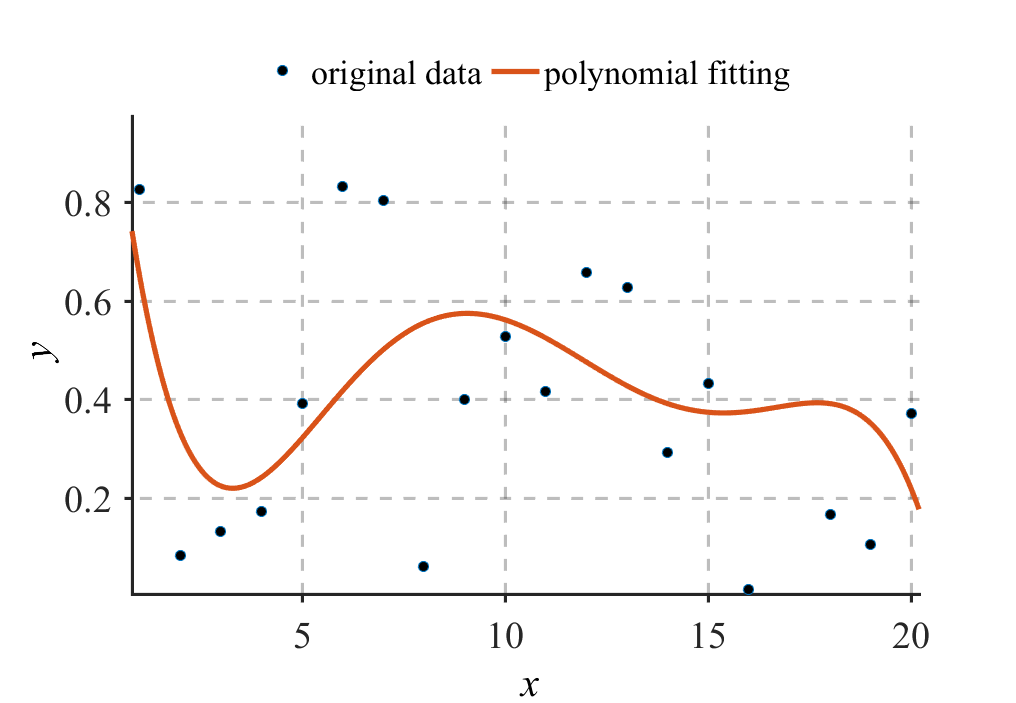
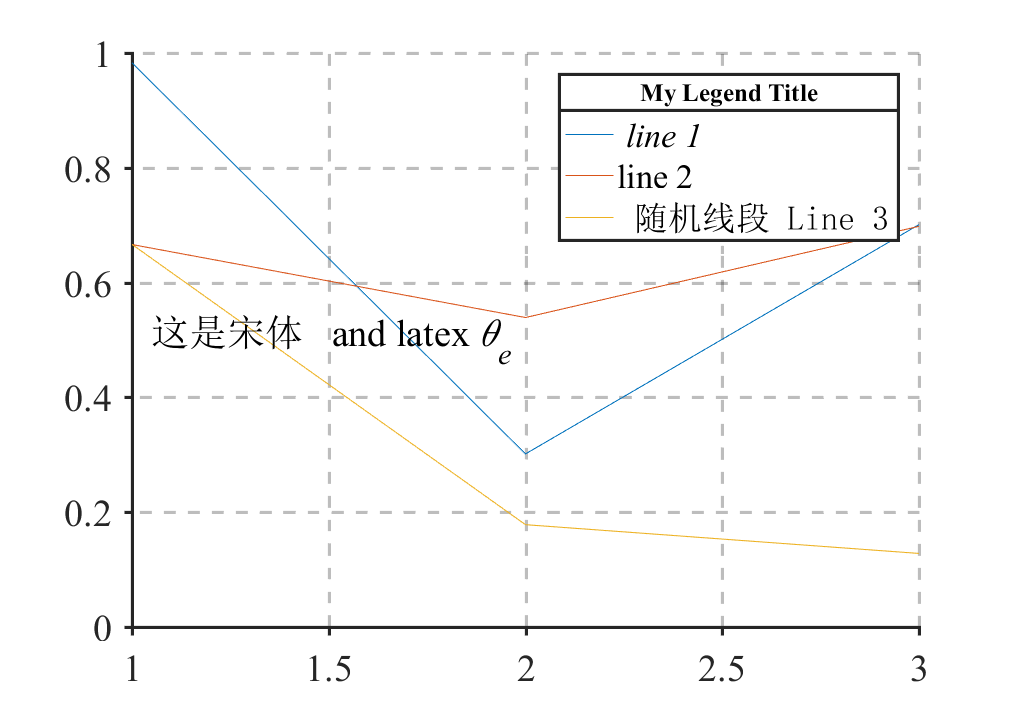
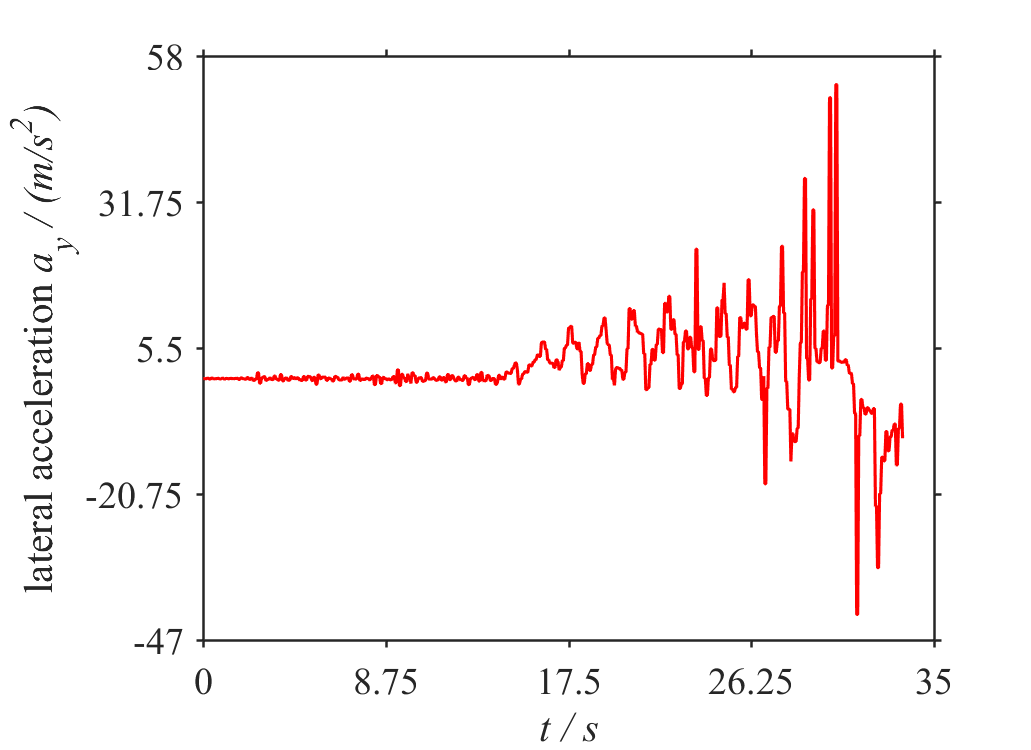
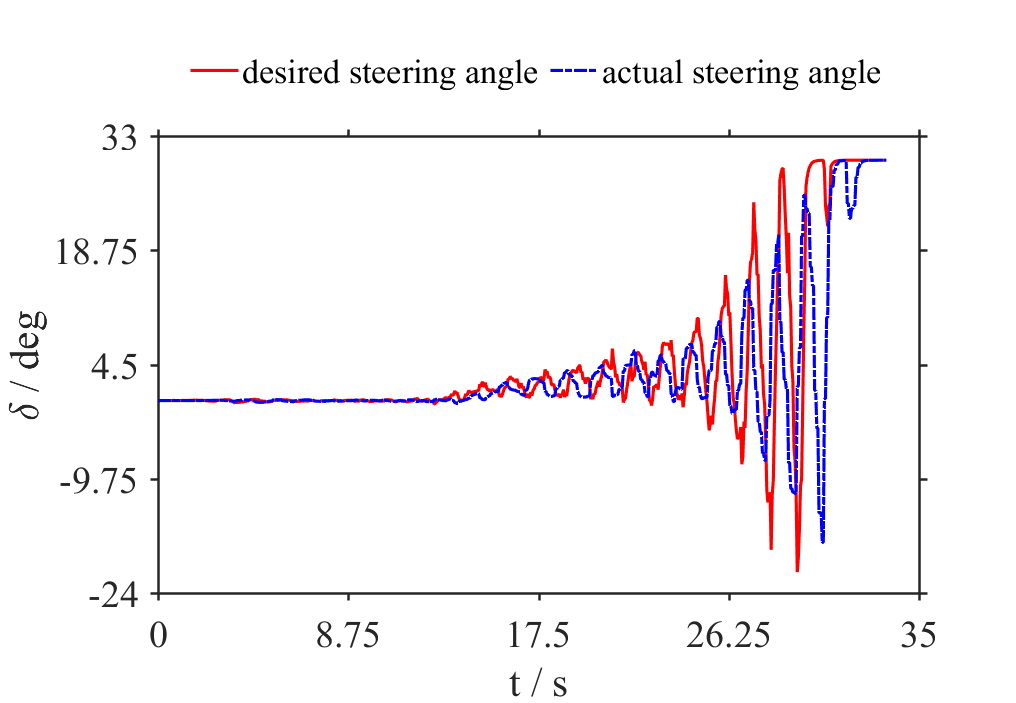
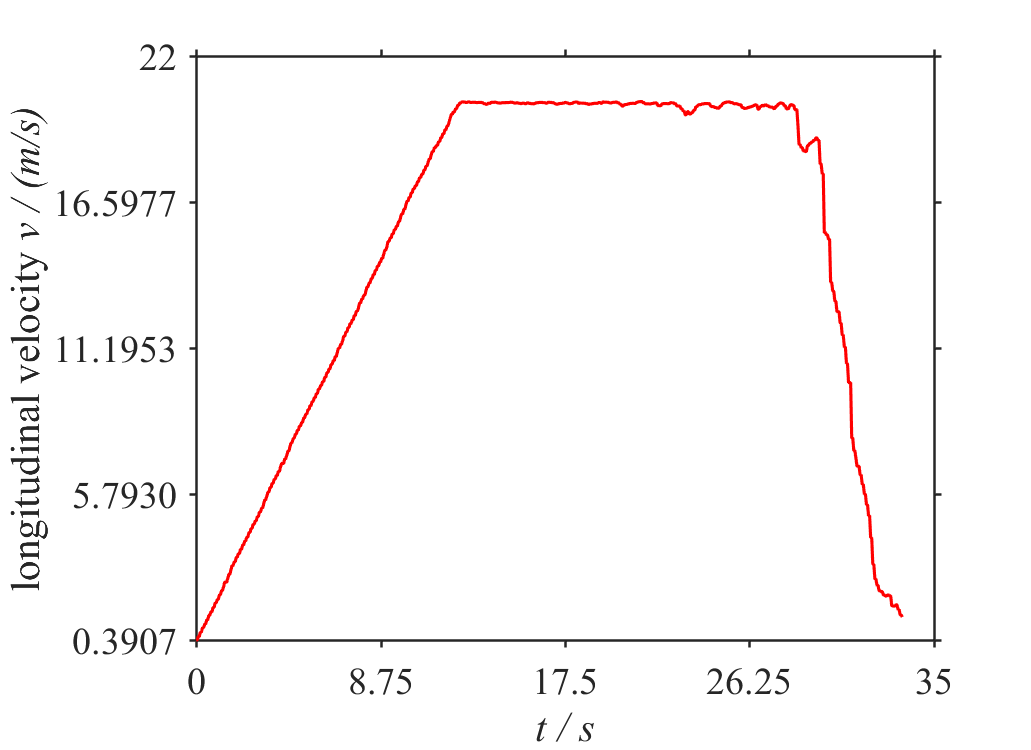
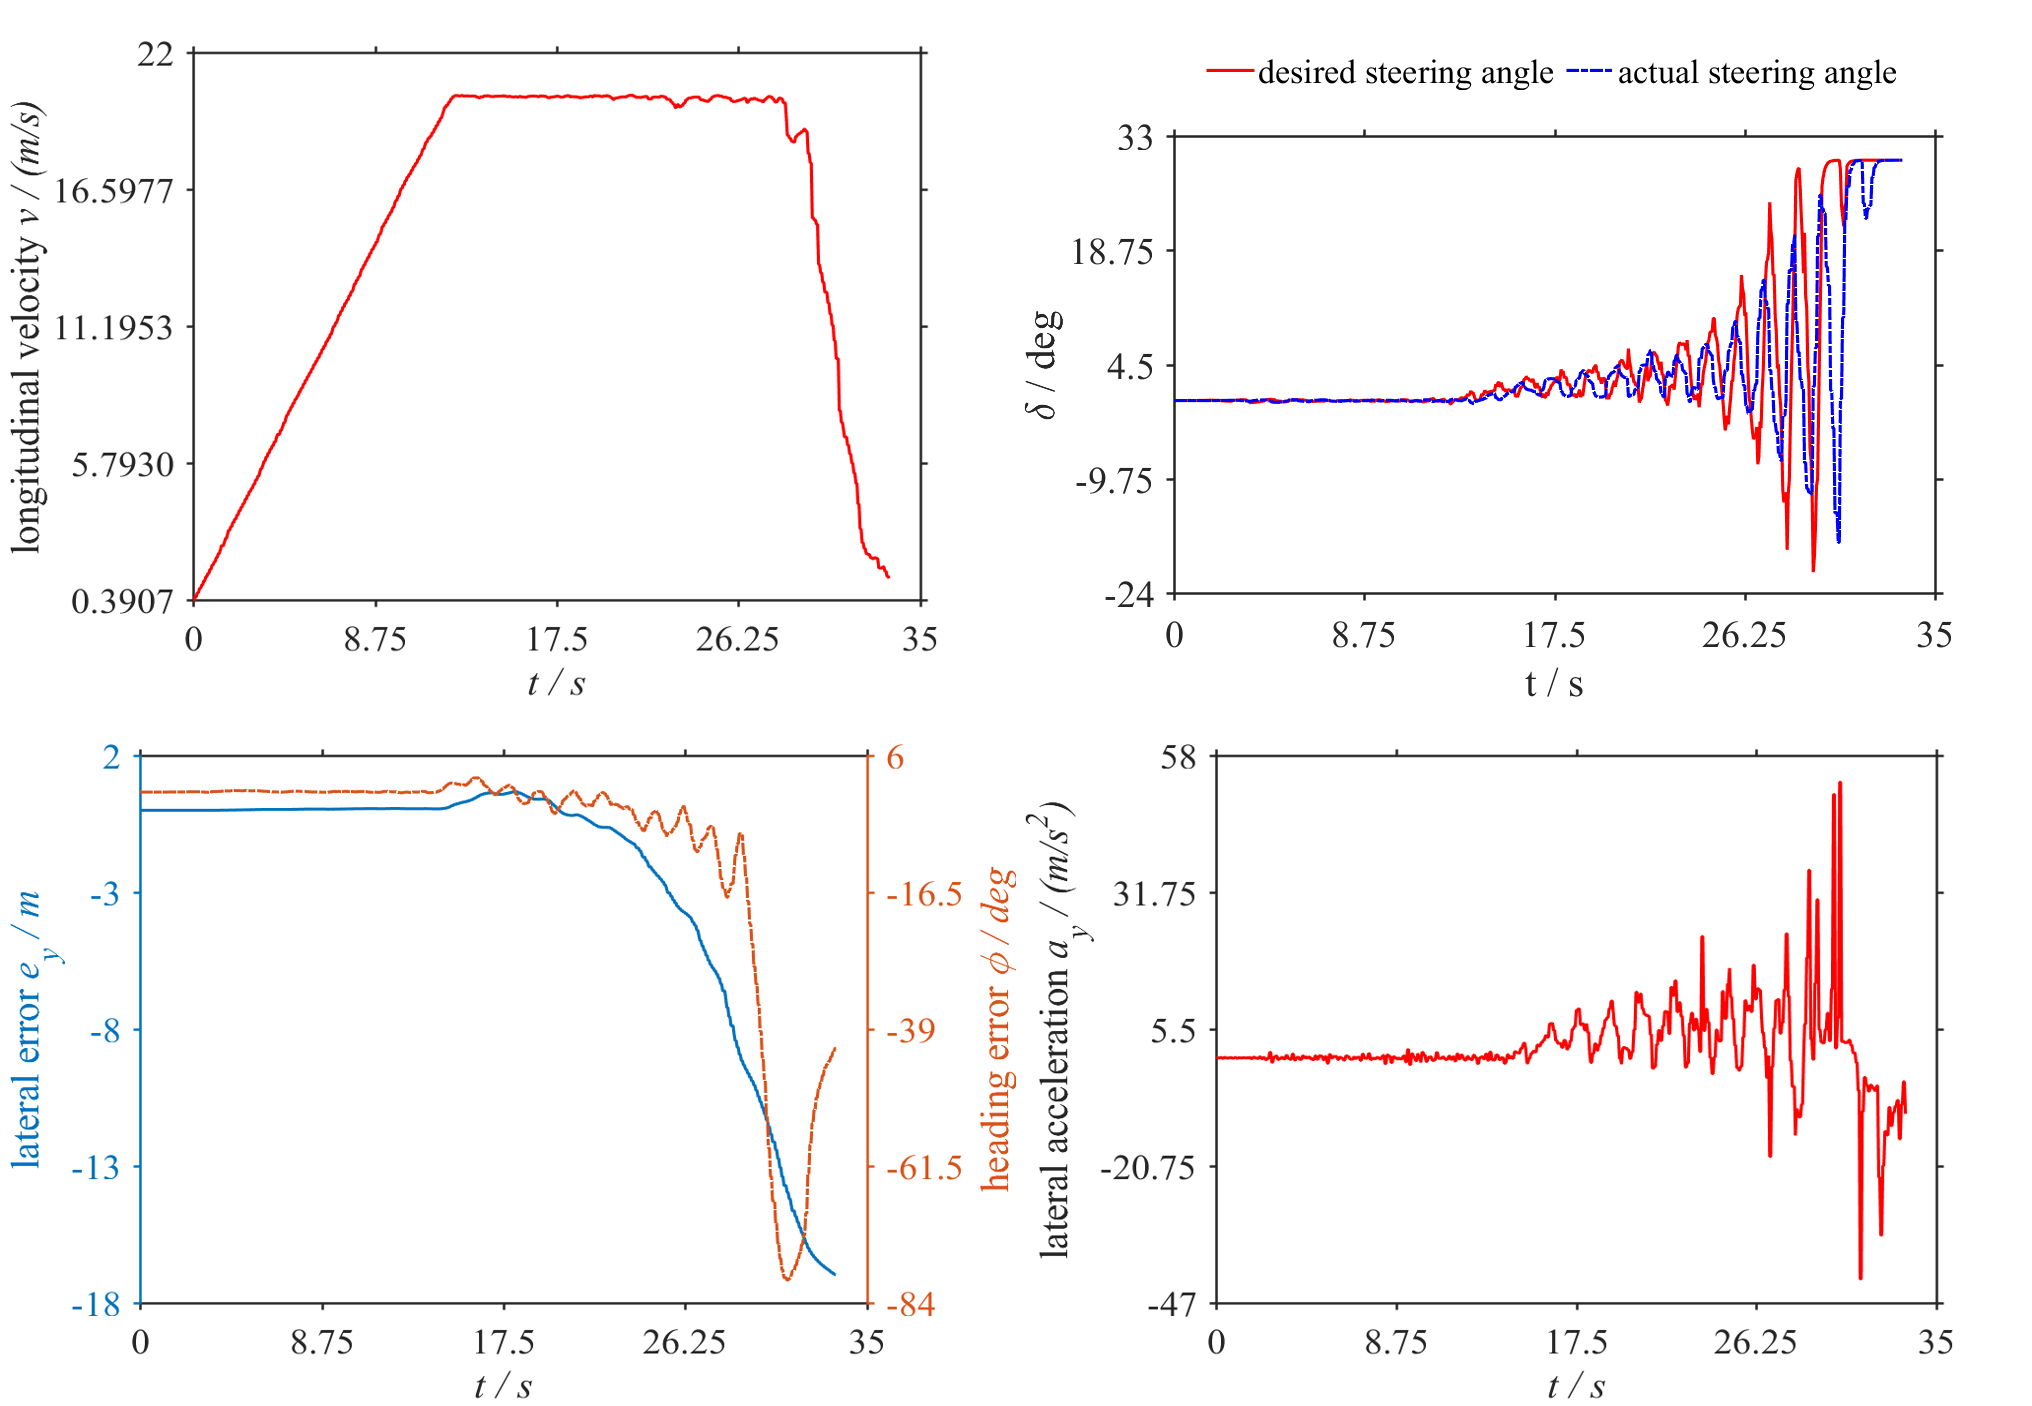
ax1.Color = [239, 237, 245] / 255;This function can dramatically reduce our efforts to put some figures into one single figure in a batch approach. Here is an example when I am trying to compose four images into a 2x2 single image. Let's see the inputs
and the output:
You can also set the columns of the output image and whether or not cutting image edges by using the function script spliceFigureFunc.m. To see one example of how to realize this, just have a look at figure_splice.m.
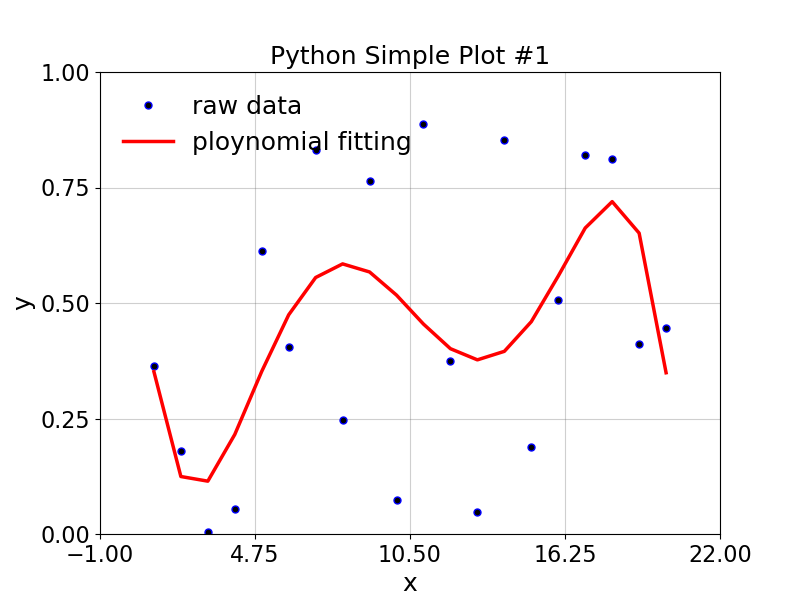
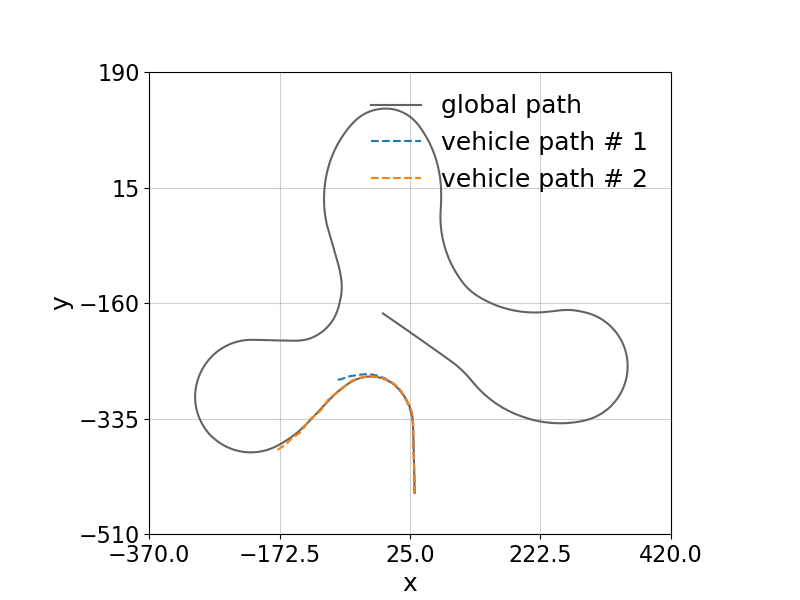
Using Python package Matplotlib, Pandas, Numpy and other packages, you can also get similar plot, and even more convenient configuration.
- basic_example gives you an example using the second approach to change figures' properties.
fig_plot is an example to show how to plot figure based on csv file in a batch approach.
Parameter configuration:
save_enable: whether to save figures to file or not.image_path: choose the path to save your figure. The default setting is the current folder.global_path_file,search_pathandfilename: the path to search certain groups of files.fig_dpiandfigsize_inch: figure size and resolution.
And it is worth noting that you can specify the color of your figure as an RGB triplet (or hex codes) in Python. See how to choose color below for more recommendation to choose harmonious color.
Here have a look at the results:
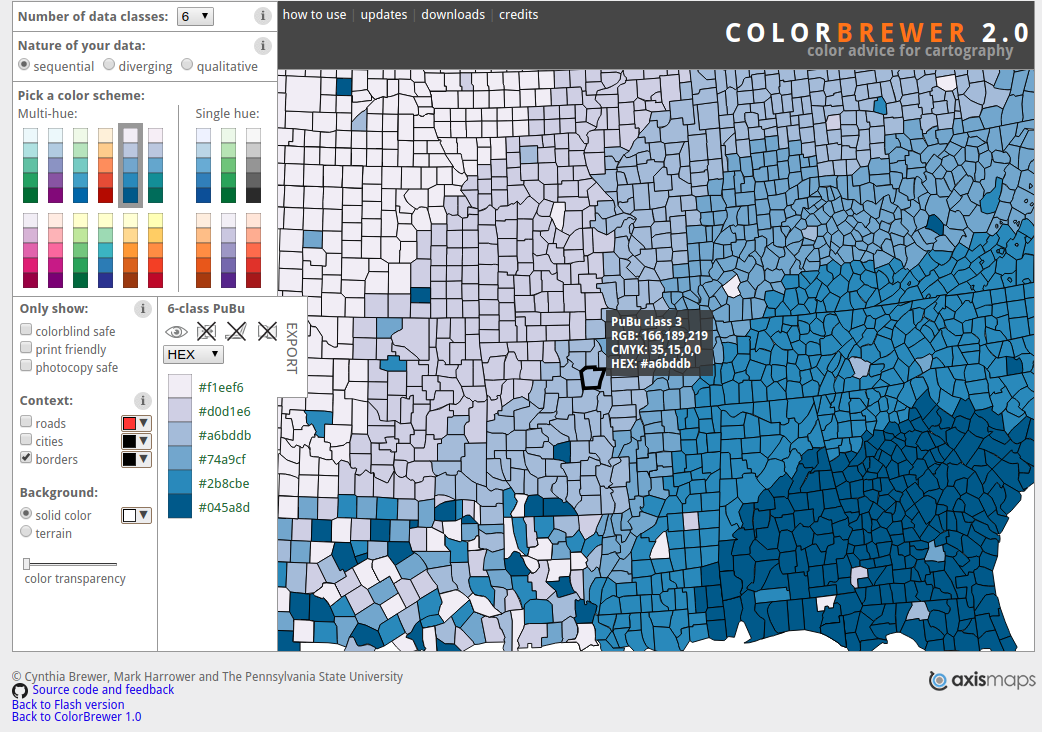
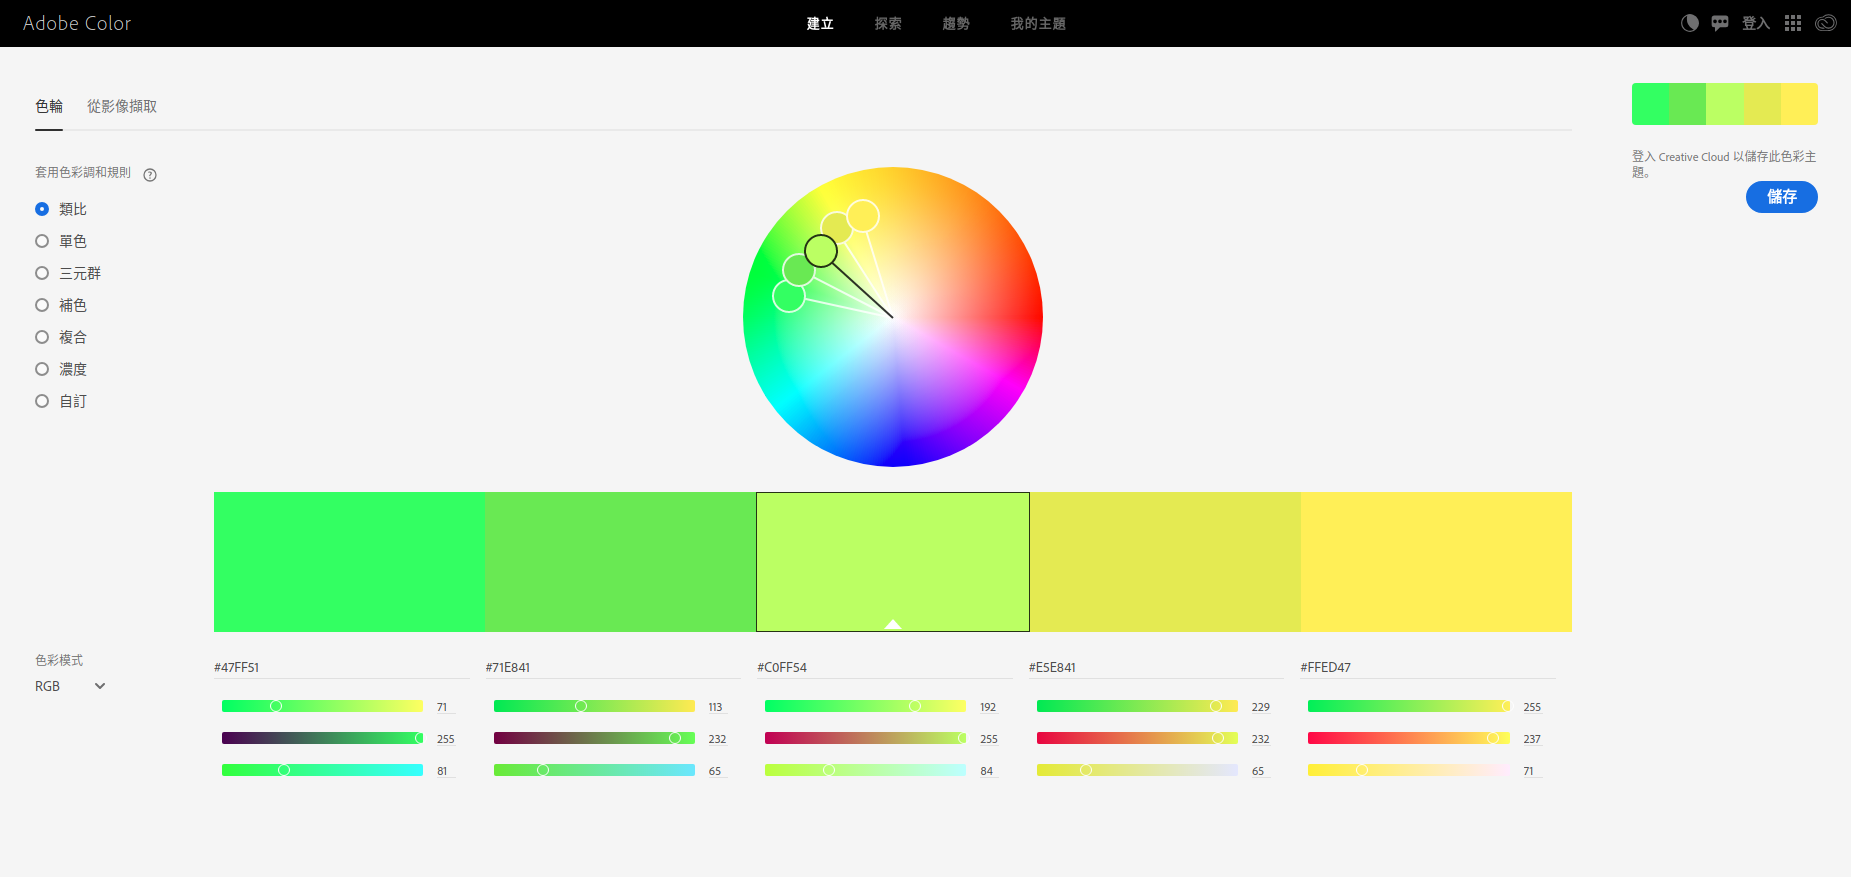
There are some tools for guidance in choosing color schemes, which makes your plots more beautiful.
colorbrewer2 |
Adobe Color |
|---|---|
 |
 |
Here is a comparison by using built-in color and color chosen from ColorBrewer2:
using built-in color |
using color in ColorBrewer2 |
|---|---|
 |
 |
- Python > 3.0
- Matlab > 2014b
- Python version
- basic_example
- fig_plot
- fig_splice
- 3D Plot
- Contour Plot
- Image Show
If you have any questions or ideas to improve it, just submit issues or PRs to this repo, and I would say thanks for your contribution.
Thanks to Mr. Mie (咩先生) @科研充电宝 (one offical account on WeChat aiming at sharing various research tricks) for providing the original version of figure splicing based on which I improved and formulated the demonstration of fig_splice.
