koboloadeR is a R package to conduct data discovery and analysis for data collected through KoboToolbox, ODK, ONA or any xlsform compliant data collection platform. This package first builds on the capacity of UNHCR Kobo server @ http://kobo.unhcr.org but it can also be used from any structured dataset.
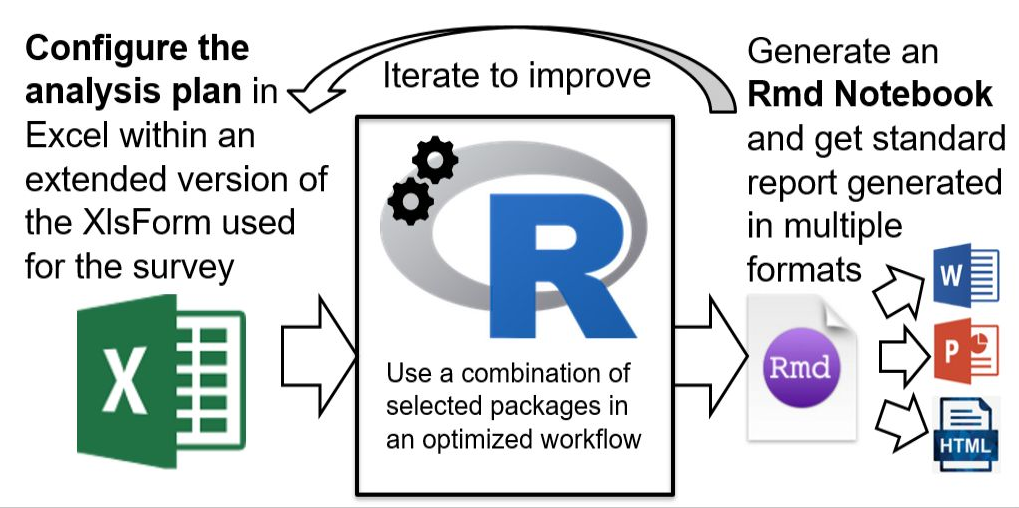
The main concept behind the package is to implement a survey data analysis plan and configuration directly within the xlsform excel file that has been used to develop the questionnaire. A few additional column are created in this excel document, the package read those column to generate a series of predefined report.
This approach has the following advantages:
-
End users do not need to code in R and to master the language in order to use the package;
-
The data analysis plan is de facto fully documented and described;
-
The resulting data crunching reports are fully reproducible;
-
Analysis iterations are facilitated;
-
Good practises are enforced through the package.
To go in more details, the suggested workflow is presented below (note that all of it is not yet fully implented - see issue tracking for more details)
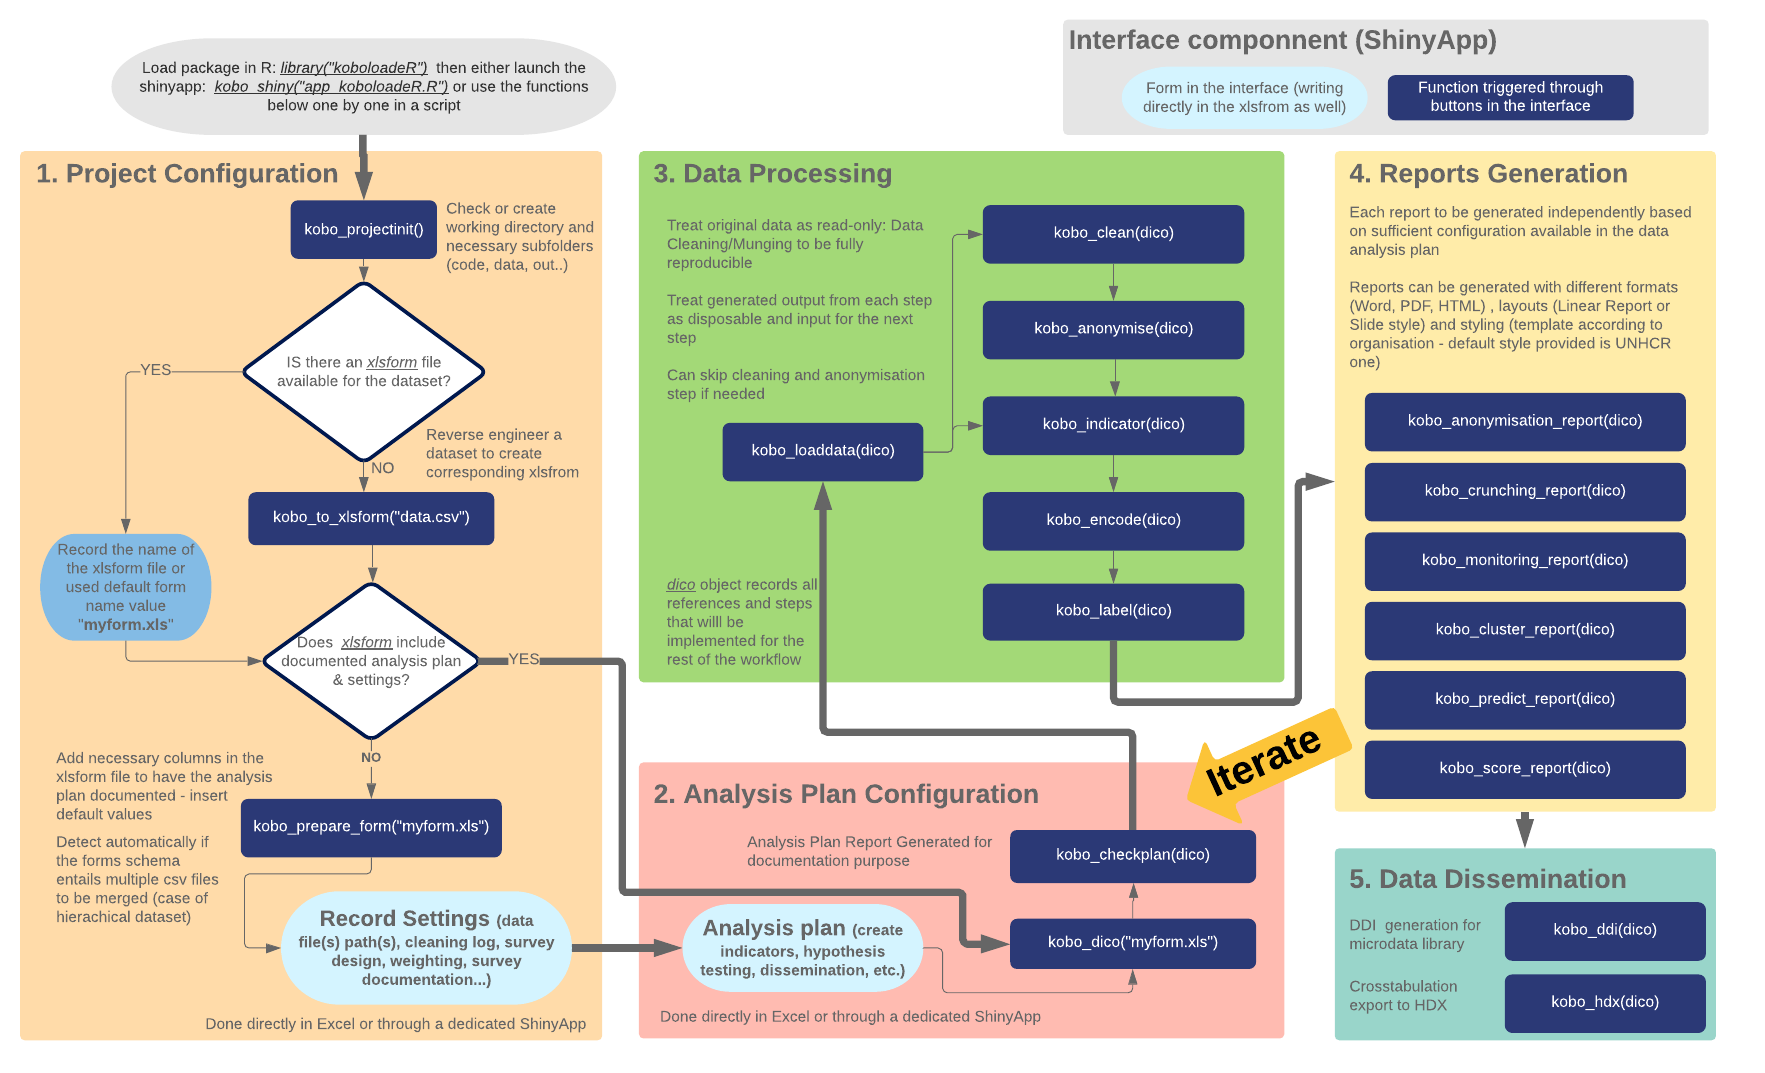
The koboloadeR package allows to:
-
connect to the KoBo API (v1) for the KoBo Toolbox project.
-
compute a data dictionnary based on xlsform. It implies ot have a few additionnal column in the xlsform in order to better define how data shoudl be analysid (cf infra). as it based on a standard, this part and the following should work for any xlsform compatible server such as OpenDataKit or ONA
-
generate automatically of a series of charts & maps based on the data dictionnary
-
generate automatically of a series of charts & maps based on a formatted data analysis plan
-
access to a series of dedicated Shiny application to set up your project
-
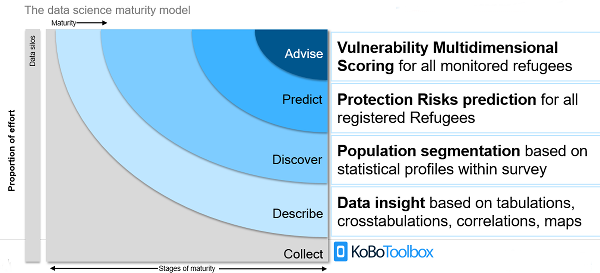
support the full range of data science level
To be able to use koboloadeR you will need:
-
R: download here: https://cran.rstudio.com/). For Windows, choose "install R for the first time".
-
R Studio (https://www.rstudio.com/products/rstudio/download/#download)
- Install R: follow instruction from the installer.
- Install R Studio: follow instruction from the installer
- Launch R Studio
Note that the package is still in beta-version. We hope to have soon a release available on CRAN.
- Open R studio interface and within the R console, install 'devtool' package:
install.packages("devtools")
- Install koboloadeR:
library(devtools)
install_github("unhcr/koboloadeR", ref = "gh-pages")
- You are all set! You can know use koboloadeR. If you have a problem consult the common troubleshooting part at the end of this page.
First, in R Studio:
- In R Studio, select File, click New project. A box opens
- Choose New Directory
- Choose Empty project
- Type the name of the folder where you want to put your data
- Select where you want to put this folder
- Click Create project
Then setup a few things: run those two lines:
library (koboloadeR) # This loads koboloadeR package

kobo_projectinit() # Creates folders necessary and transfer files needed
It might take a while as a few other packages have to be installed or loaded. Once the see the " >" again at the beginning of the line, you can run:
kobo_shiny("app_koboloadeR.R")
This will launch a graphic interface with other instructions and options.
For better performances, select "Open in Browser" on the top of the window.
Either:
- Grab your data with
kobo_data_downloader& Get your form withkobo_form - or simply copy your data in
csvformat and your xlsform inxlsformat in thedatafolder that was created during the project initiation
use the following options to extract data
You may also use a dedicated shinyapp for this
kobo_shiny("app_dataviewer.R")
You may also use a dedicated shinyapp for this
kobo_shiny("app_sampling.R")
Here are a few introductions and tutorials for R:
- A good introduction to R here: https://ismayc.github.io/rbasics-book
- An introduction to R: complete but not very user-friendly: https://cran.r-project.org/doc/manuals/r-release/R-intro.html
- Try R: http://tryr.codeschool.com/
- Data Camp's Introduction to R: https://www.datacamp.com/courses/free-introduction-to-r
To go further:
Household survey often results in dataset with over 300 variables to process & explore. In Humanitarian Environment, deadlines to get insights from those dataset are often tight. Manual processing is very lengthy and can be done only for a limited part of the dataset. Often, because of those challenges, a lot of potential insights are not discovered. This package is developped to support this challenge around data crunching. It's part of the initiative around an Integrated Framework for Household Survey (IFHS): A toolkit to facilitate design, collection & analysis.
KoboloadeR packages aims at separating “input”, “processing” and “output” within the data crunching phase of the data analysis worklfow.
The “output” will be one or multiple Rmd (Rmarkdown) file(s) than will generate word, pdf or html reports and the configuration file includes references to all “input”:
- Path to raw data files collected using OpenDataKit, Kobotoolbox or ONA
- Path to form (defined using the standard format xlsform) in order to build a data dictionary
- Path to the sample weight for each observation (based on cluster or strata...)
- Path to the data cleaning log
- Path to the indicator calculation sheet
- Productivity: Once the configuration file is written, run the script in Rstudio to get the output
- Training: No need to write R instruction – limited knowledge of R is required
- Iteration: Check the output, adjust the various input files & re-run the script till you get a satisfying report
- Reproducibility: all analysis input are de facto documented
KoboLoadeR takes care of the processing component so that the technical team can focus on the interpretation.
- Frequency tables & Bar chart for select type questions
- Frequency tables & Histogram for numeric questions
- Frequency table for text questions
- Cross-tab & graph (if 2 categorical: bar chart, if 1 categoric + 1 numeric: boxplot & if 2 numeric: scatterplot)
- Chi-squared test & corrplot presentation
- Mapping if geographic field are configured (still in development)
- and more to come...
Xlsform is a convenient format to build advance form using any spreadsheet software such as Libreoffice or MsExcel.
In order to build an an analysis plan within the form, the columns described in the tables below needs to be added. Note that if the column are not present, the script will create dummy ones. It's always possible to add your analysis plan to an existing form and relaunch kobo_dico in order to regenerate the correct analysis plan.
Note that for charting purpose, it's recommanded that labels for questions & choices should not exceed 70 characters. It's possible again to re-edit directly your xlsform and regenerate a new dico.
| Column | Description |
|---|---|
chapter |
used to breakfdown the final report |
disaggregation |
used to flag variables used to facet dataset |
correlate |
used to flag variables used for statistical test of independence (for categorical variable) or correlation for numeric variable |
variable |
used to flag ordinal variables so that graphs are not ordered per frequency. |
anonymise |
used to generate an anonymised datset in line the anonymisation plan within the xlsform |
structuralequation |
used to tag variables to the standard structural equation model: risk, coping, vulnerability |
clean |
used to flag external csv file to be used for the cleaning of a specific variable |
cluster |
used to flag variables used for statistical clustering |
predict |
used to flag variables to be predicted based on a joined registration dataset |
mappoint |
used to flag variables to be mapped as point |
mappoly |
used to flag variables to be mapped as polygon |
| Column | Description |
|---|---|
order |
used to define order for ordinal variables |
weight |
used to define weight for each answers in case it's used for some specific indicator calculation |
recategorise |
used to recategorise quickly choices for a question |
The idea is to map calculation necessary to create complex indicators from the variables defined in the survey worksheet. This will document and automate the generation of indicators (i.e. feature enginerring).
This worksheet will allow to generate an additional elements to the data dictionnnary -- i.e. dico dataframe.
Below are the minimum elements/column to document:
| Column | Description |
|---|---|
type |
type of indicator select_one or integer or numeric |
name |
short name for the indicator |
label |
label for the indicator |
chapter |
chapter to include the indicator in |
frame |
frame to use to append the idnicator to |
calculation |
used to reference the calculation. This will be a precise R formula |
define wether the indicator is Measurement: variable used to quantify other indicators, Disaggregation: variable that describes certain groups, Predictor: Indicator that describes the cause of a situation, Outcome: Indicator that describes the consequence of a situation or Judgment: indicator that translates a subjective assessment
method to be used for the indicator: Percentage, Sum, Max/Min, Average, Score, Denominator, Numerator, Numerator.external (i.e. linked to an external value)
The package contains the following Shiny apps, accessible via kobo_apps("app_name"):
| App | Description |
|---|---|
"data_viewer" |
The "data_viewer" app provides a basic login screen to authenticate against the specified API. Once authenticated, the datasets available via the specified login are displayed, and a dropdown list is populated with which one can select the dataset they want to view. The dataset is also made available in the users Global Environment. |
Here's a blog post introducing the package!
The following examples access the public data available via KoBo Toolbox. Note that all of the functions have been set with defaults of user = NULL and api = 'kobo'.
kobo_datasets()[, c("description", "id"), with = FALSE] ## Just show the first two columns
#                                                    description    id
#   1:                                关于“西装微定制现状的调查“ 10427
#   2:                زانیاری لەسەر كۆمپانیاكانی نەوت لە گەرمیان 11190
#   3:                           מיפוי שדרות צ'רצ'יל - ורד ויואב 12568
#   4:                                                      Test 39717
#   5:                                             Market Survey  7640
#  ---
# 403: Webuy_Stock lot Business (No.1 Stock Bazar in Bangladesh) 30792
# 404:                               WWF Zambia [Field Reporter]  4163
# 405:                                         xls_form_training 41820
# 406:                                    Mwanza KAP SURVEY 2015 25206
# 407:                                    Elisha Zelina, GST6109  1857

kobo_submission_count(4163)
# [1] 37

kobo_data_downloader("4163")
# No local dataset found.
# Downloading remote file.
# ... The contents would normally be printed here

### On a subsequent run, if the file is already there and no changes have been made
kobo_data_downloader("4163")
# Number of rows in local and remote file match.
# Using local file.
The kobo_data_downloader automatically checks for the existence of an object in your workspace named "data_####" (where "####" is the numeric form ID). If such an object is found, it then uses kobo_submission_count to compare the number of rows in the local dataset against the number of rows in the remote dataset. If the number is found to be different, the remote dataset is re-downloaded. If they are found to be the same, the local dataset is used.
In the future, it is intended that there would be a more robust and efficient method rather than redownloading the entire dataset each time a change has been detected.
Run the examples at the help pages to get a sense of some of the other features:
example("kobo_datasets")
example("kobo_submission_count")
example("kobo_data_downloader")
These functions all use basic HTTP authentication. The easiest way to enter the password details is the common "username:password" approach. Thus, when accessing form data using authentication, the function would be used in the following manner:
kobo_data_downloader("123456", "username:password")
This method should be used whenever Kobo or ODK forms are used as data collection tools and personal data is being collected. Even when personal data is not being collected it still may be appropriate to apply the methodology since quasi-identifiable data or other sensitive data could lead to personal identification or should not be shared.
| Type | Description |
|---|---|
| Direct identifiers | Can be directly used to identify an individual. E.g. Name, Address, Date of birth, Telephone number, GPS location |
| Quasi- identifiers | Can be used to identify individuals when it is joined with other information. E.g. Age, Salary, Next of kin, School name, Place of work |
| Sensitive information | & Community identifiable information Might not identify an individual but could put an individual or group at risk. E.g. Gender, Ethnicity, Religious belief |
The following are different anonymisation actions that can be performed on sensitive fields. The type of anonymisation should be dictated by the desired use of the data. A good approach to follow is to start from the minimum data required, and then to identify if any of those fields should be obscured.
The methods below can be referenced in the dedicated column within xlsform (cf above)
The anonymise column is used to reference the anonymisation plan. it can take the following values.
| Method | Description |
|---|---|
| remove | Variable is removed entirely from the data set. The Variable is preserved in the original file. |
| reference | Variable is removed entirely from the data set and is copied into a reference file. A random unique identifier field is added to the reference file and the data set so that they can be joined together in future. The reference file is never shared and the Variable is also preserved in the original file. |
| key | Variable to be consisdered for k-anonymity & individual disclosure risk analysis (i.e. quasi-identifiers) |
| outlier | Variable is removed entirely |
| sensitve | Variable is removed entirely |
Data about who, where and how the data is collected is often stored separately to the main data and can be used identify individuals (i.e. metadata will be removed)
Text variables likely to be removed as well...
The Variable values are replaced with meaningless values but the categories are preserved. A reference file is created to link the original value with the meaningless value. Typically applied to categorical Variable . For example, Town names could be masked with random combinations of letters. It would still be possible to perform statisitical analysis on the Variable but the person running the analysis would not be able to identify the original values, they would only become meaningful when replaced with the original values. The reference file is never shared and the data is also preserved in the original file.
Generalise
Continuous Variable is turned into categorical or ordinal Variable by summarising it into ranges. For example, Age could be turned into age ranges, Weight could be turned into ranges. It can also apply to categorical Variable where parent groups are created. For example, illness is grouped into illness type. Generalised Variable can also be masked for extra anonymisation. The Variable is preserved in the original file.
Before anything else, try to restart the R session:
- In R studio, on top go to "Session"
- "Restart R"
Note that in case you get the following error:
InternetOpenUrl failed: 'An error occurred in the secure channel support'
Enter the command:
setInternet2(TRUE)
Alternatively, you may add to .Rprofile or Rprofile.site the following line:
options(download.file.method = "wininet")
One common errors during the package installation is linked to the antivirus "real time file system protection". The following will fix the problem:
trace(utils:::unpackPkgZip, edit=TRUE)
Edit line 140:
Sys.sleep(0.5)
to:
Sys.sleep(2)
Error in strptime(xx, f, tz = tz) : unable to identify current timezone 'C': please set environment variable 'TZ'
## enter this commaned to set up the time zone - you may change it to another anotherone.
Sys.setenv(TZ='GMT')

## Now you can check...
Sys.timezone()
Sys.getenv("TZ")
If the application (graphic interface) crashes, make sure that all packages necessary are loaded with:
source("code/0-packages.R")
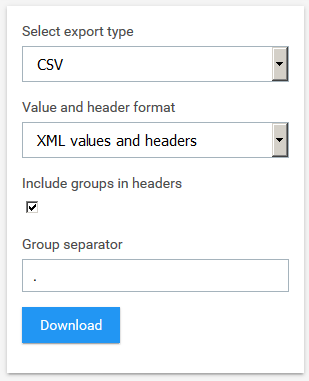
Also make sure that you downloaded your data in the right format:
- Export as XLS
- XML values and headers
- Include groups in headers
- 'Group separator' as dot ('.')
If you see this message (or similar error):
Error in file(file, ifelse(append, "a", "w")) :
  cannot open the connection
It is most likely because you have the form, dictionary or data set open on your computer. If you close it and start over, the problem should be fixed.
If you get this error:
Error: package or namespace load failed for 'rJava'
It could be because you have a 64bit version of R, but have a 32bit version of Java. Check this thread for guidance: https://stackoverflow.com/questions/37735108/r-error-onload-failed-in-loadnamespace-for-rjava