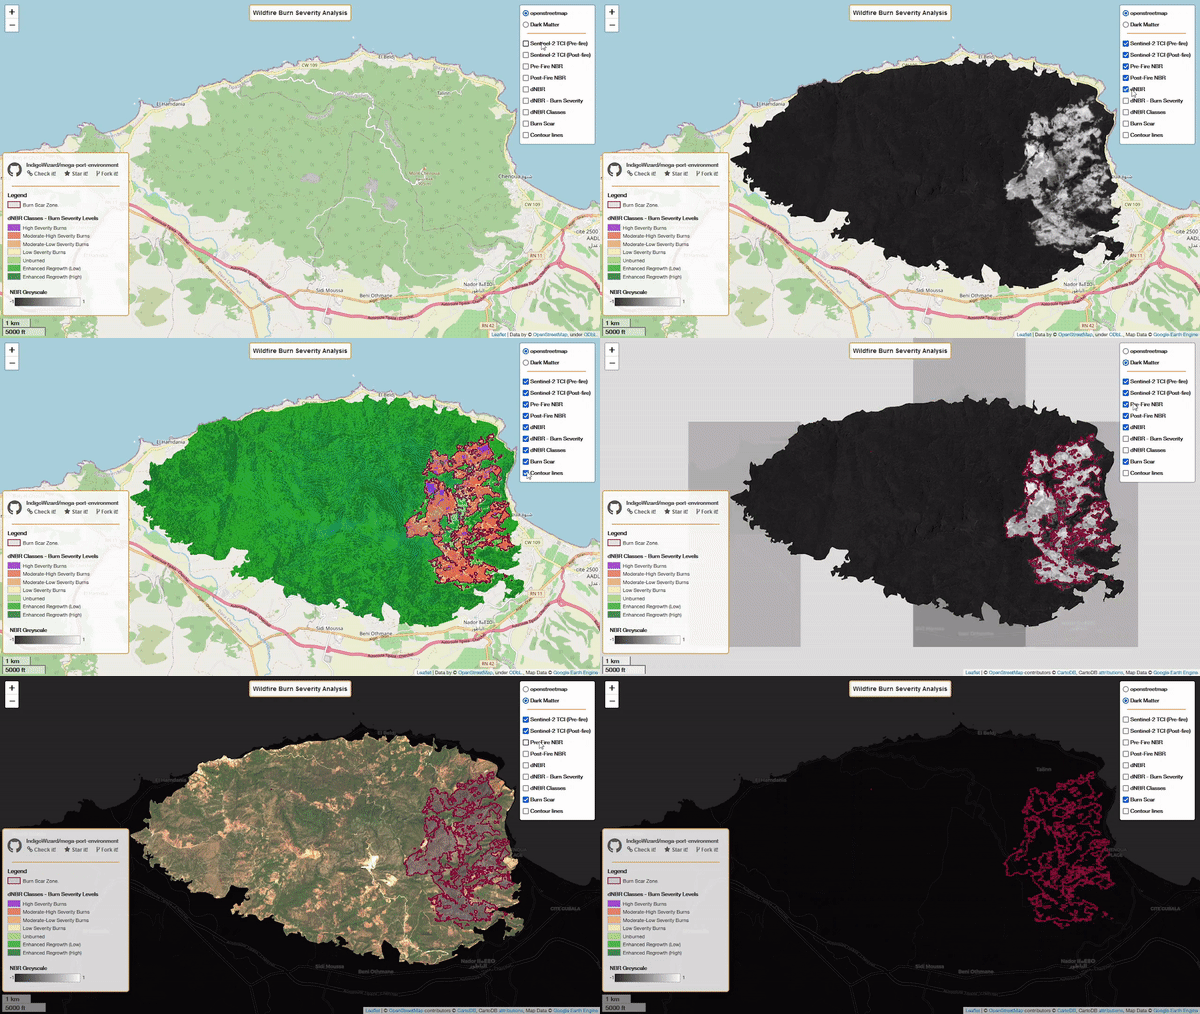
Webapp link: Wlidfire Burn Severity project
Open for contribution! (I see you, Hacktoberfest enthousiasts 👀). Consider ⭐ starring the project ʕ •ᴥ•ʔ ... ʕ ·ᴥ·ʔ
IMPORTANT NOTE:
The Earth Engine token expires after few days, so after this, the layers won't show up and the webapp may seem like not working, it's not, it's just that I don't update the token from my personal google earth engine account unless you need a live demo, otherwise check the preview section.
A GEE project that aims to generate a burn severity map to assess surface areas affected by wildfires. The project relies on Normalized Burn Ratio (NBR) to highlight the affected areas and estimate burn severity levels.
The project uses Google Earth Engine Python API, combined with Folium and geemap to render the map, calculate the index ratio and compute raster data results.
The wildifre that erupted in Mount Chenoua, Tipaza, Algeria on August 14th-16th 2022 is used as main use-case. For more details on this wildfire, read the related medium article: Mt Chenoua Forest Fires Analysis with Remote Sensing.
End users can navigate to the web page and access the results easily: Burn Severity Analysis
If you want to fork and work on the project, you need the following:
- To use this script, you must first sign up for a Google Earth Engine account.
- Install gcloud CLI for the Google Earth Engine account authentication.
- Install the rest of project dependencies from
requirement.txtfile, just run:
conda install --file requirements.txt
use python 3.9 and up.
You'll need two imagery data entries, one for a pre-fire and one for post-fire period, it's better to use images with less than 10% cloud coverage.
Get the image ID from Earth Engine Data Catalog or from SciHub (I'm using Sentinel-2 L2A imagery for better results, you can find other datasets from other sources.)
#Sentinel-2 L2A: August 12th 2022 - Pre-fire
pre_fire = ee.Image('COPERNICUS/S2_SR/20220812T103031_20220812T103132_T31SDA')

#Sentinel-2 L2A: August 20th 2022 - Post-fire
post_fire = ee.Image('COPERNICUS/S2_SR/20220820T103629_20220820T104927_T31SDA')You can use GeoJson.io to draw your polygon than copy/past only the coordinates into the code, not the full GeoJSON (Google Earth Engine at this current time don't take GeoJSON files as a geometry input, so you can't link/access/read a local GeoJSON file).
To change the area of interest (AOS) go to aos.py file and put the coordinates of your area of interest, e.g;
import ee
ee.Initialize()
aos = ee.Geometry.Polygon([
  # X/Y Decimal Degrees coordinates
  [2.40, 36.60],
  [],
  []...
])
Your Area Of Study (AOS) must be a polygon geometry, not a polyline or a single point as you are studying a specific surface area affected by wildfires. Avoid water surfaces.
Project created using: Google Earth Engine (GEE), geemap, Folium, Sentinel-2 L2A Satellite Imagery Dataset - Project by Ahmed I. Mokhtari.
