![]()
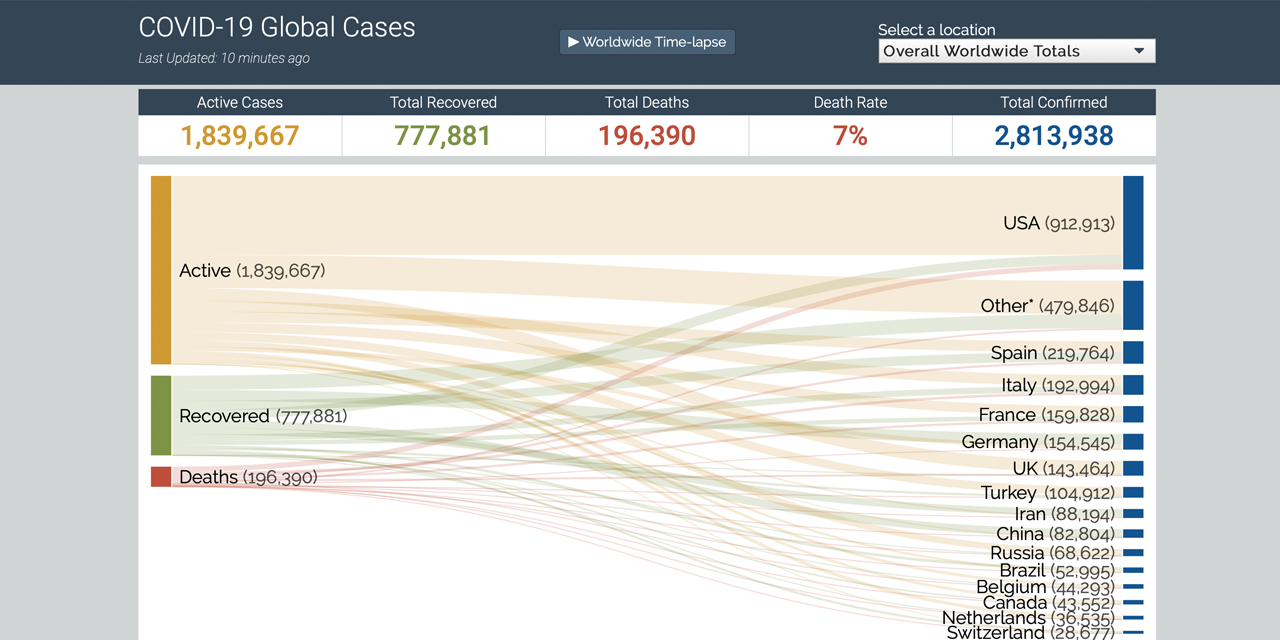
A responsive D3-based data visualization that leverages a Sankey diagram to display the breakdown of the worldwide COVID-19 cases.
This visualization uses a JSON endpoints provide by @pomber and @NovelCOVID which serves data derived from the Johns Hopkins Center of Systems Science and Engineering dataset.
You can hack on this locally by cloning down the repository and launching a local server via npm.
npm install
npm startThe data is dynamically queried and periodically generated locally for a static fallback. You can generate the data locally with the following command:
npm run data:updatePull request and feedback is welcome and requested.
Thanks goes to these wonderful people (emoji key):
 Lonny Gomes 💻 🚧 |
 kmliebe 🎨 🤔 |
 panoz7 🤔 |
 J. Z. Rioflorido 🤔 🎨 ️️️️♿️ |
 Rodrigo Pombo 🔣 |
 NovelCOVID 🔣 |
 Corey Gearhart 🤔 ️️️️♿️ |
 kelissa 🎨 🤔 |
 Corey B 🤔 |
This project follows the all-contributors specification. Contributions of any kind welcome!