Aiven Kafka quickstart with nodeJS
The following is a walkthrough for setting up and using Apache Kafka on Aiven. We will use a sample nodeJS app to push mock IoT sensor data to an Aiven Kafka. Aiven Kafka is a fully managed Kafka service enabling your distributed event streaming pipeline with zero vendor lock-in.
Summary • Getting started • Streaming mock messages • Viewing messages • Notes • Why Aiven? • (Optional) Monitoring
Summary
- Deploy a Kafka instance on Aiven
- Stream IoT messages with
index.js - View streamed messages
- View relevant metrics
Getting started
Step 1: Prepare your local environement
This tutorial is based on the node-rdkafka npm package, a Node.js binding for the C/C++ library librdkafka.
Make sure you have an OpenSSL version available for the node-rdkafka compiler to use:
# Making sure OpenSSL is installed, by default macOS used LibreSSL
brew install openssl

# Allow the node compiler to access OpenSSL
export CPPFLAGS=-I/usr/local/opt/openssl/include\nexport
export LDFLAGS=-L/usr/local/opt/openssl/lib
You can now install the project node packages in node-kafka-aiven-quickstart/
npm install # Compiling and installing node-rdkafka and yargsStep 2: Deploy your Aiven Apache Kafka service
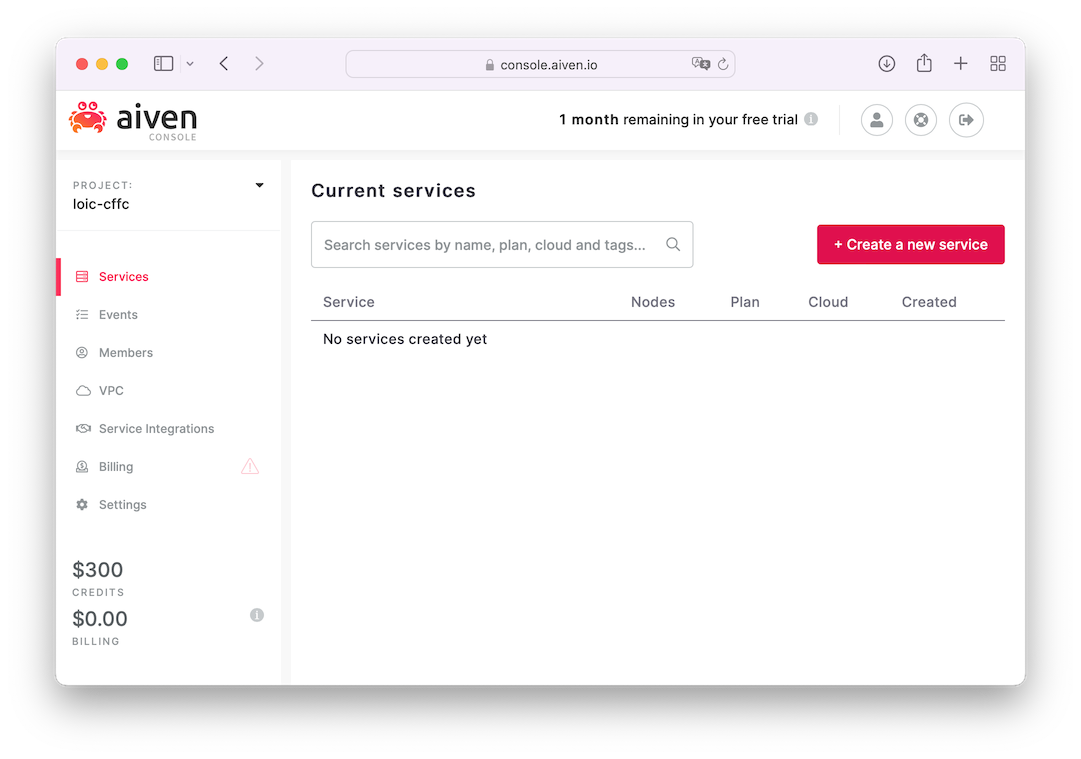
If you don't already have an Aiven account, register to Aiven. This Aiven Kafka quickstart for NodeJS will walk you trough a mock IoT sensors flock streaming data to your Aiven Kafka managed service.
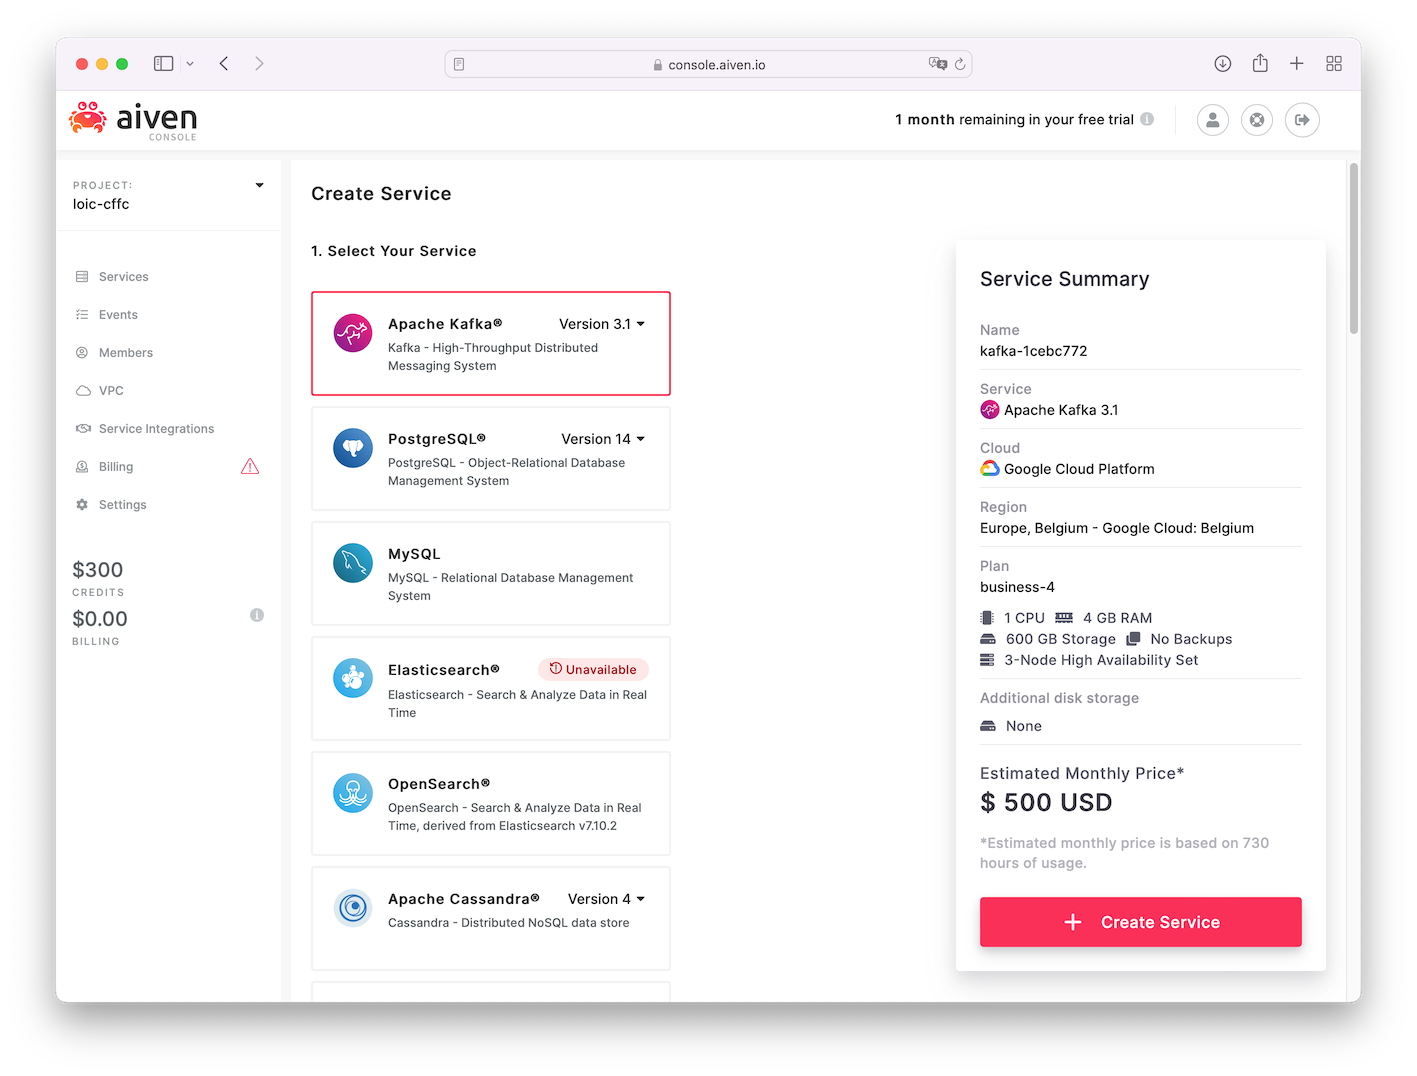
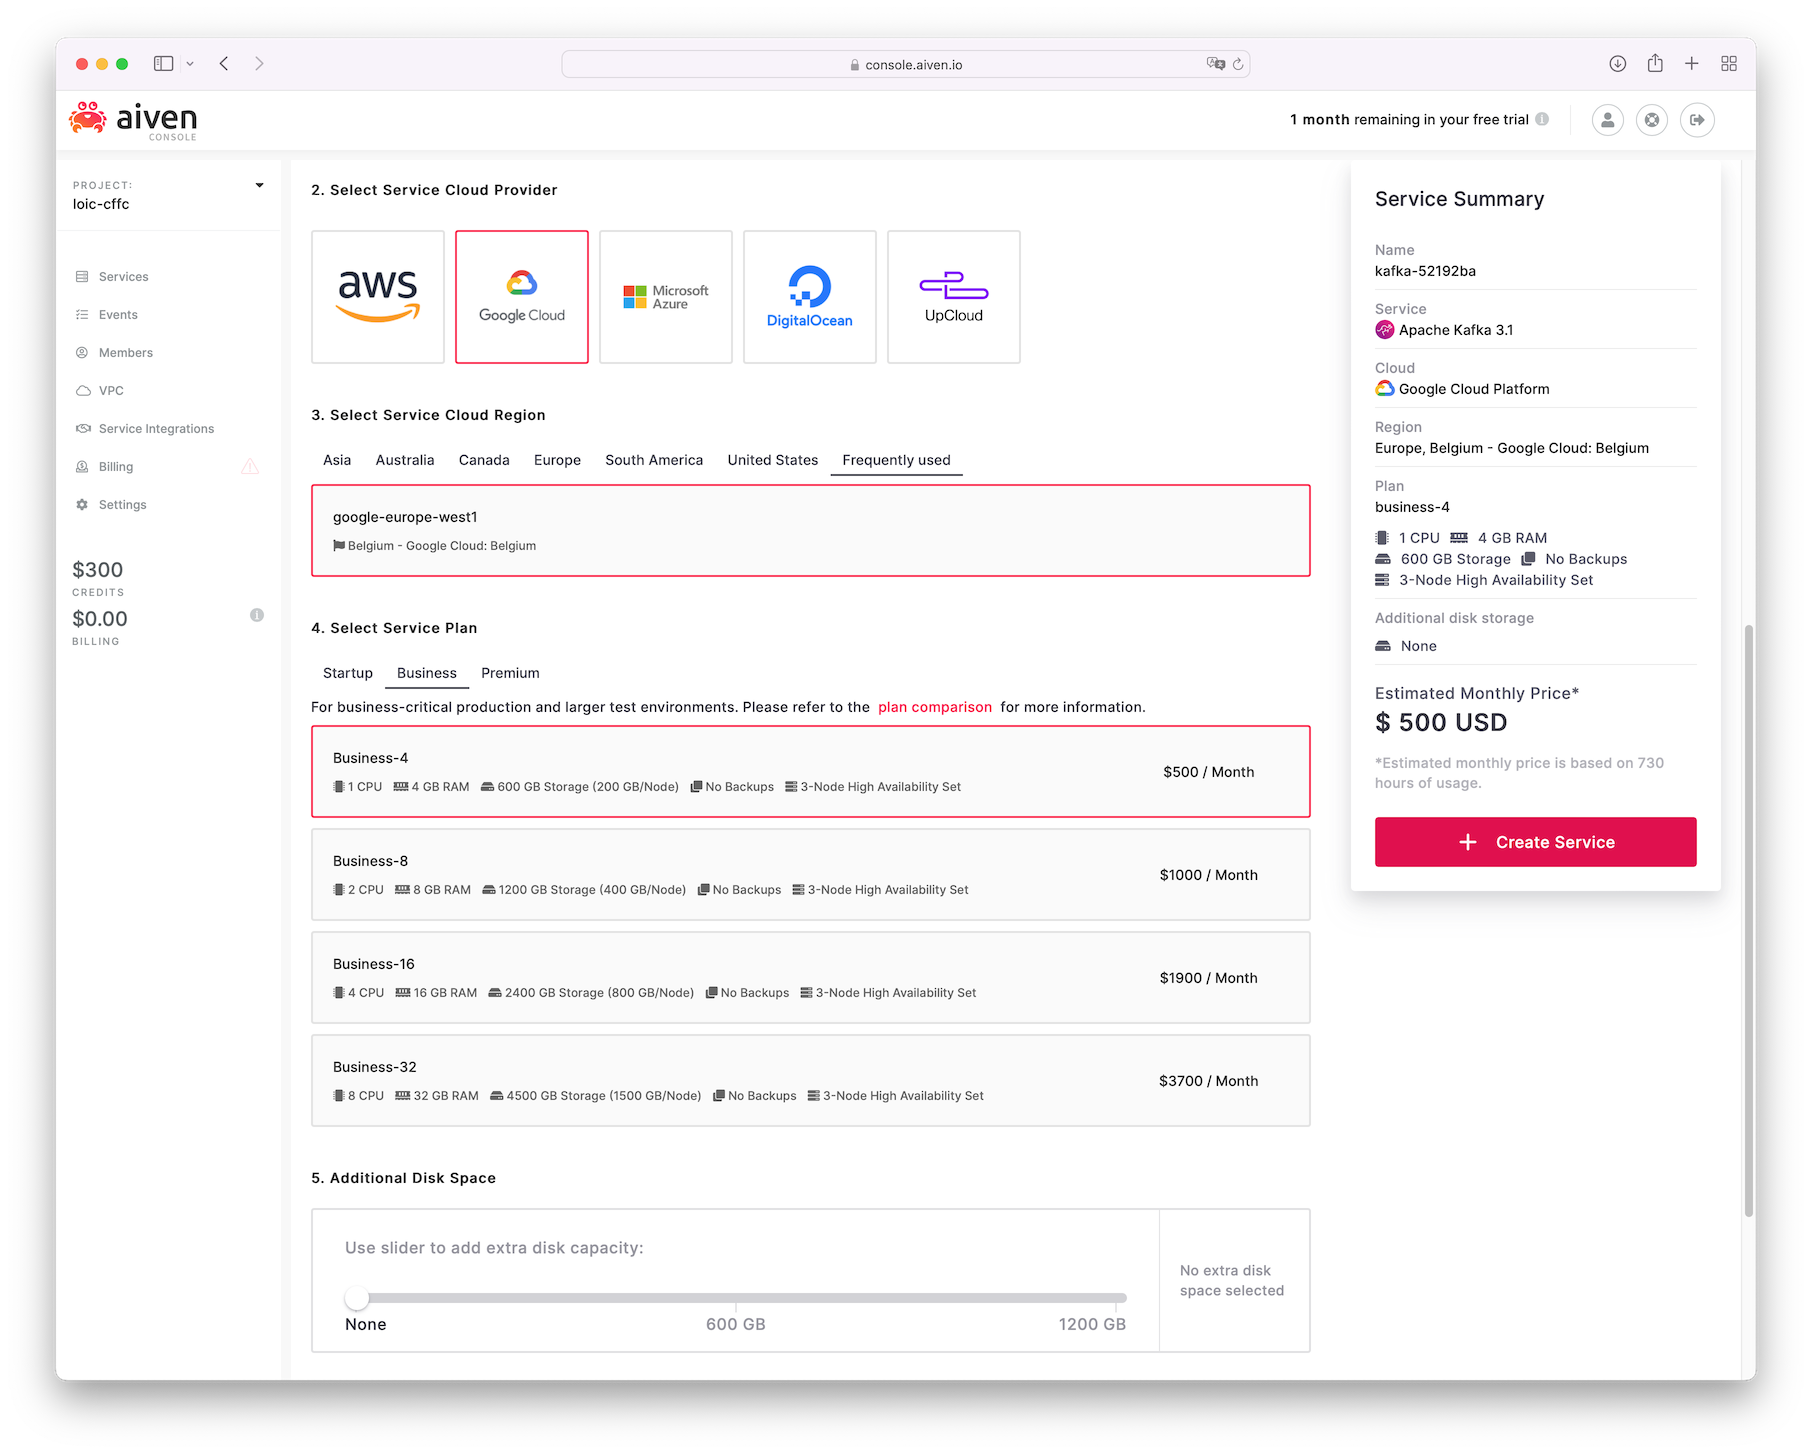
Select Create a new service and create an Apache Kafka instance. Note that the service name cannot be changed afterwards. Aiven will provide you with a monthly cost estimation.
Optional: customize your cloud provider, region, storage and Kafka nodes.
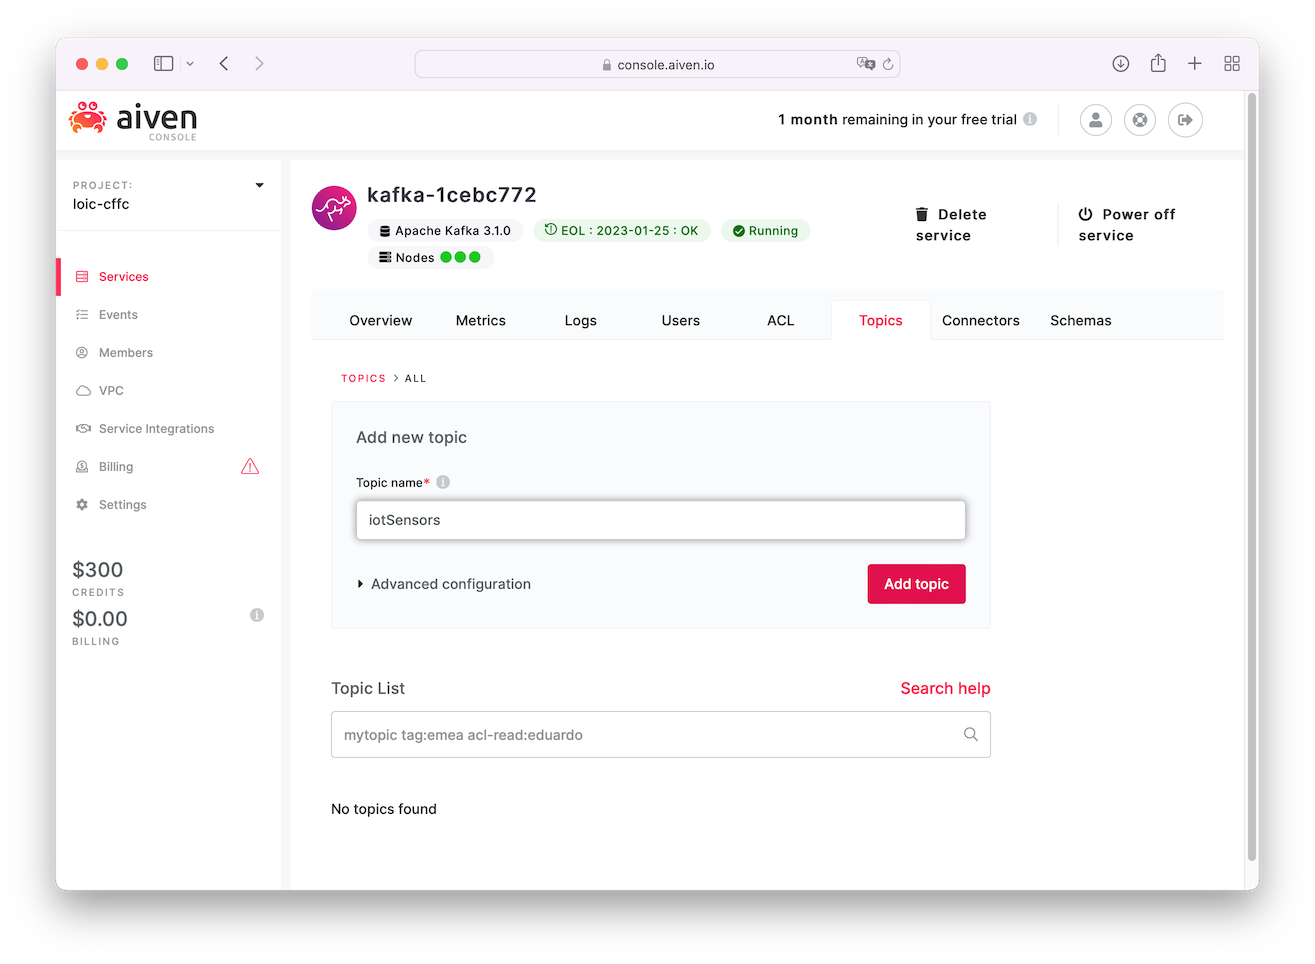
Once the Kafka instance is fully deployed, create a topic matching with your producer. In our example we'll use iotSensors
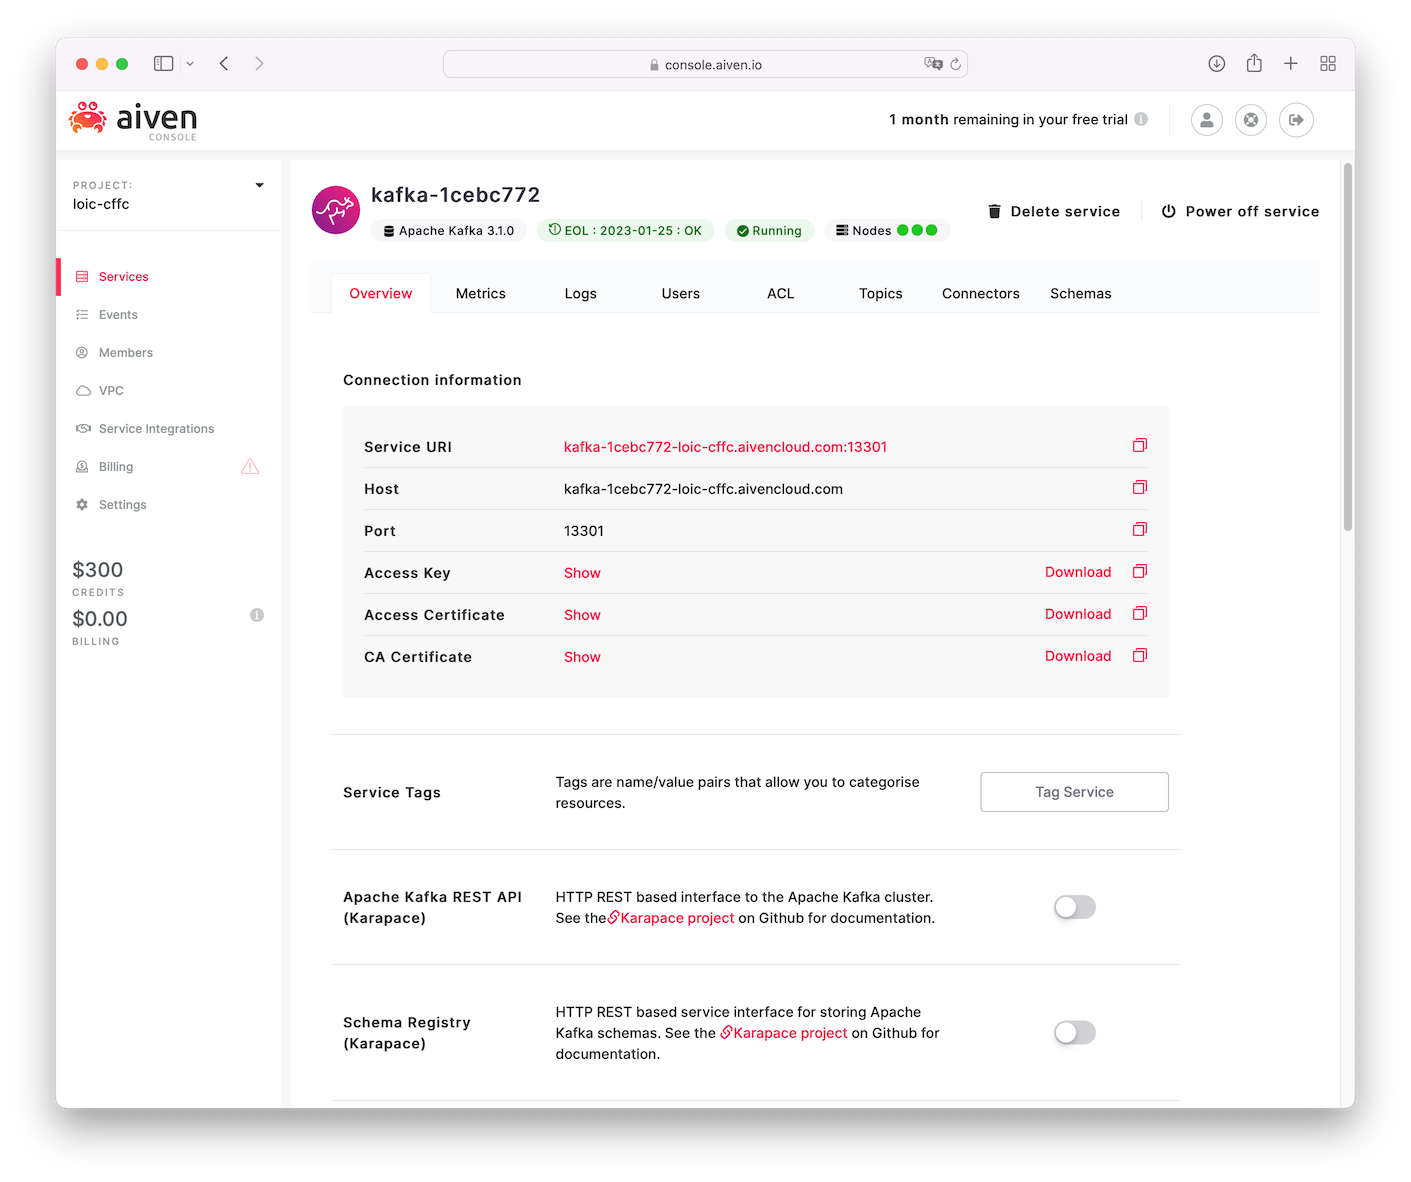
Download your Kafka instance Access Key, Access Certificate, and CA Certificate to send SSL-secured messages from the producer. Activate the REST interface.
Streaming mock messages
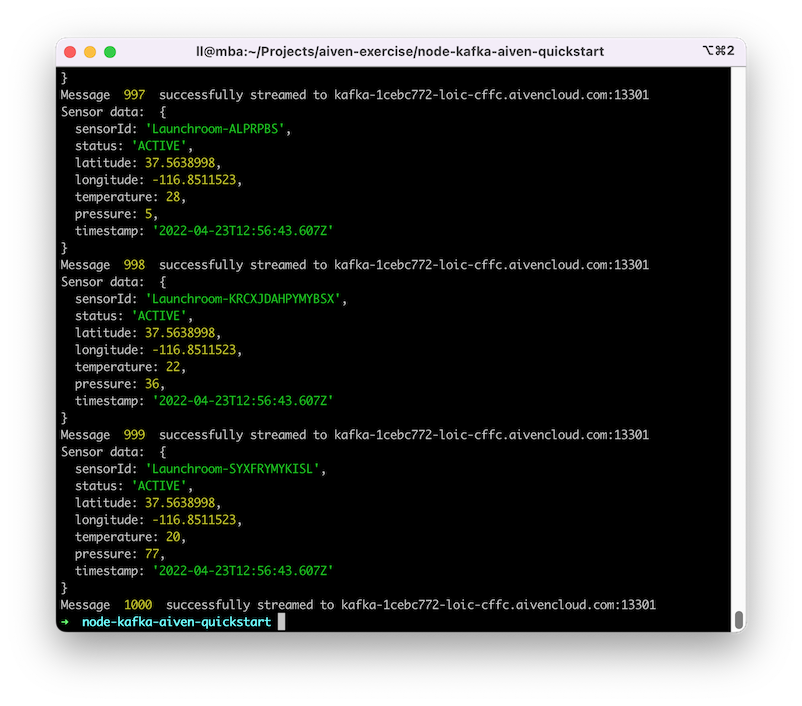
Run the nodeJS app to push messages from the producer by passing your Kafka instance as parameter:
node index.js \
    --host kafka-1cebc772-loic-cffc.aivencloud.com:13301  \
    --key-path service.key \
    --cert-path service.cert \
    --ca-path ca.pem
Messages are pushed to your Kafka instance. Amount of mock IoT messages can be modified in index.js > let numEvents = 100;
Viewing messages
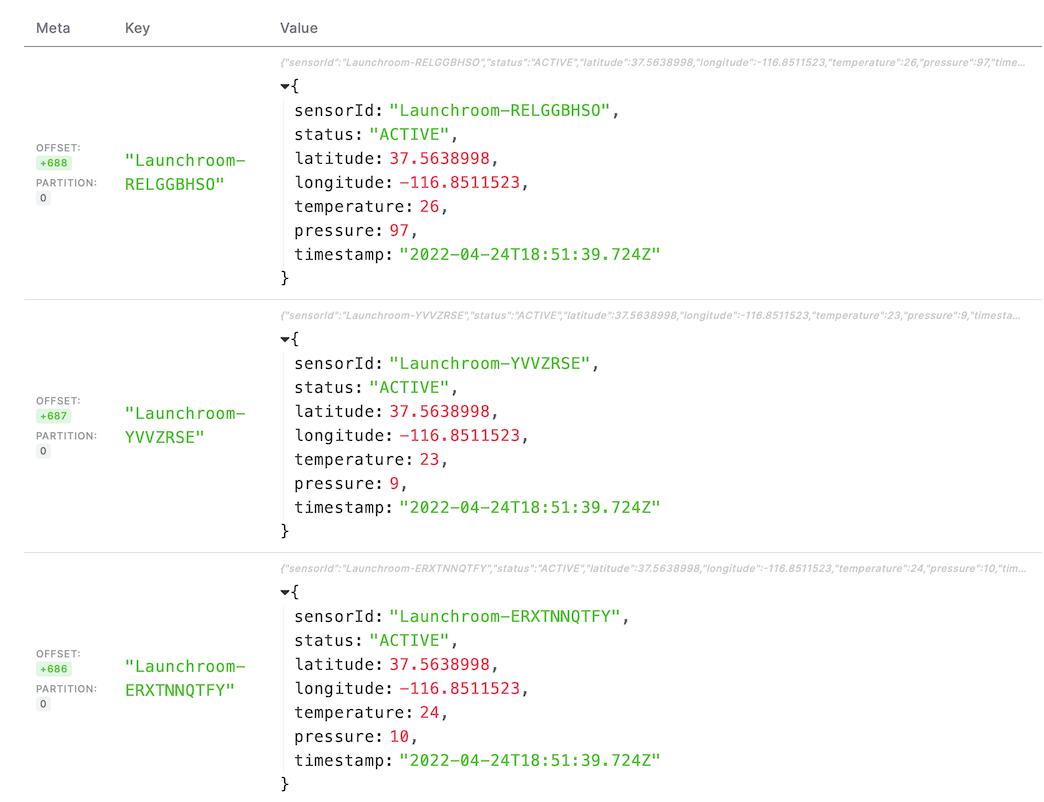
Messages are accessible from your Aiven console in Services > Kafka instance name > Topics > Topic name > Messages > Fetch Messages
Messages can be in binary, JSON or ARVO format.
Notes
- Alternatives to nodeJS Kafka packages are
Kafka-Node,Kafka-Rest-Client. See NPM Compare - By default librdkafka itself does not provide serialization or schema-registry support, this can be provided by Confluent's libserdes which can be used in combination with librdkafka to serialize/deserialize Avro with schemas registered in the Schema-registry
- You can pass multiple configuration options to librdkafka. A full list can be found in librdkafka's Configuration.md
Why Aiven?
Aiven enables a Apache Kafka deployment as a fully managed service, with zero vendor lock-in and a full set of capabilities to build your streaming pipeline.
- Automatic updates and upgrades
- Transparent pricing. No networking costs
- 99.99% uptime. 100% human support
- Scale up or scale down as you need
(Optional) Monitoring
To setup metric collection and a visualisation dashboard for our Kafka instance, we will deploy the following:
- Aiven for InfluxDB / PostgreSQL - Database where the telemetry data is stored and can be queried from
- Aiven for Grafana - Dashboards for the telemetry data
The underlying storage for the telemetry data will be InfluxDB. It is a time-series database with interesting features:
- Fast adaptive compression algorithms allow storing huge numbers of data points
- Individual metrics data points can be tagged with key=value tags and queried based on them
- Advanced query language allows queries whose output data requires little or no post-processing
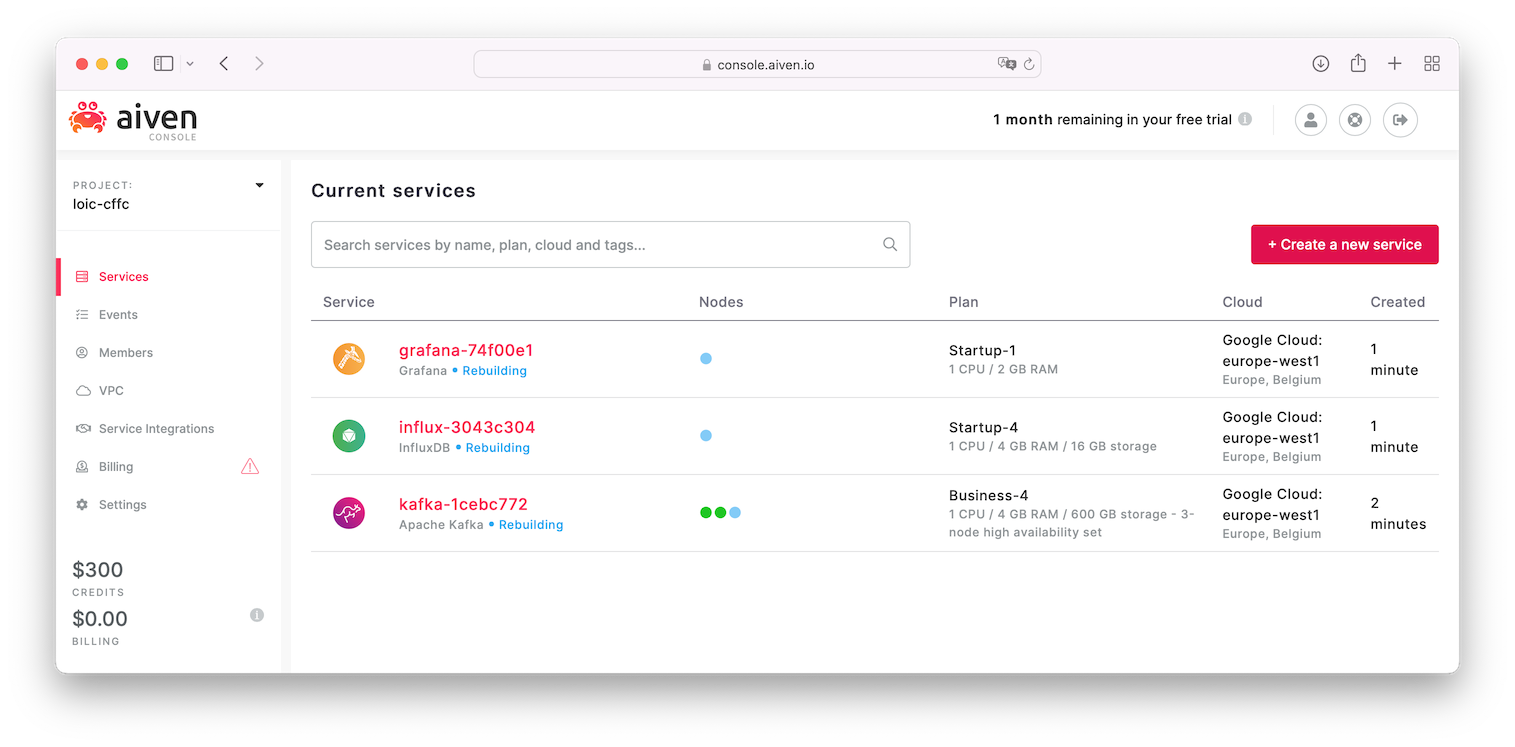
Deploy your Aiven InfluxDB and Grafana instance and make sure the services are deployed
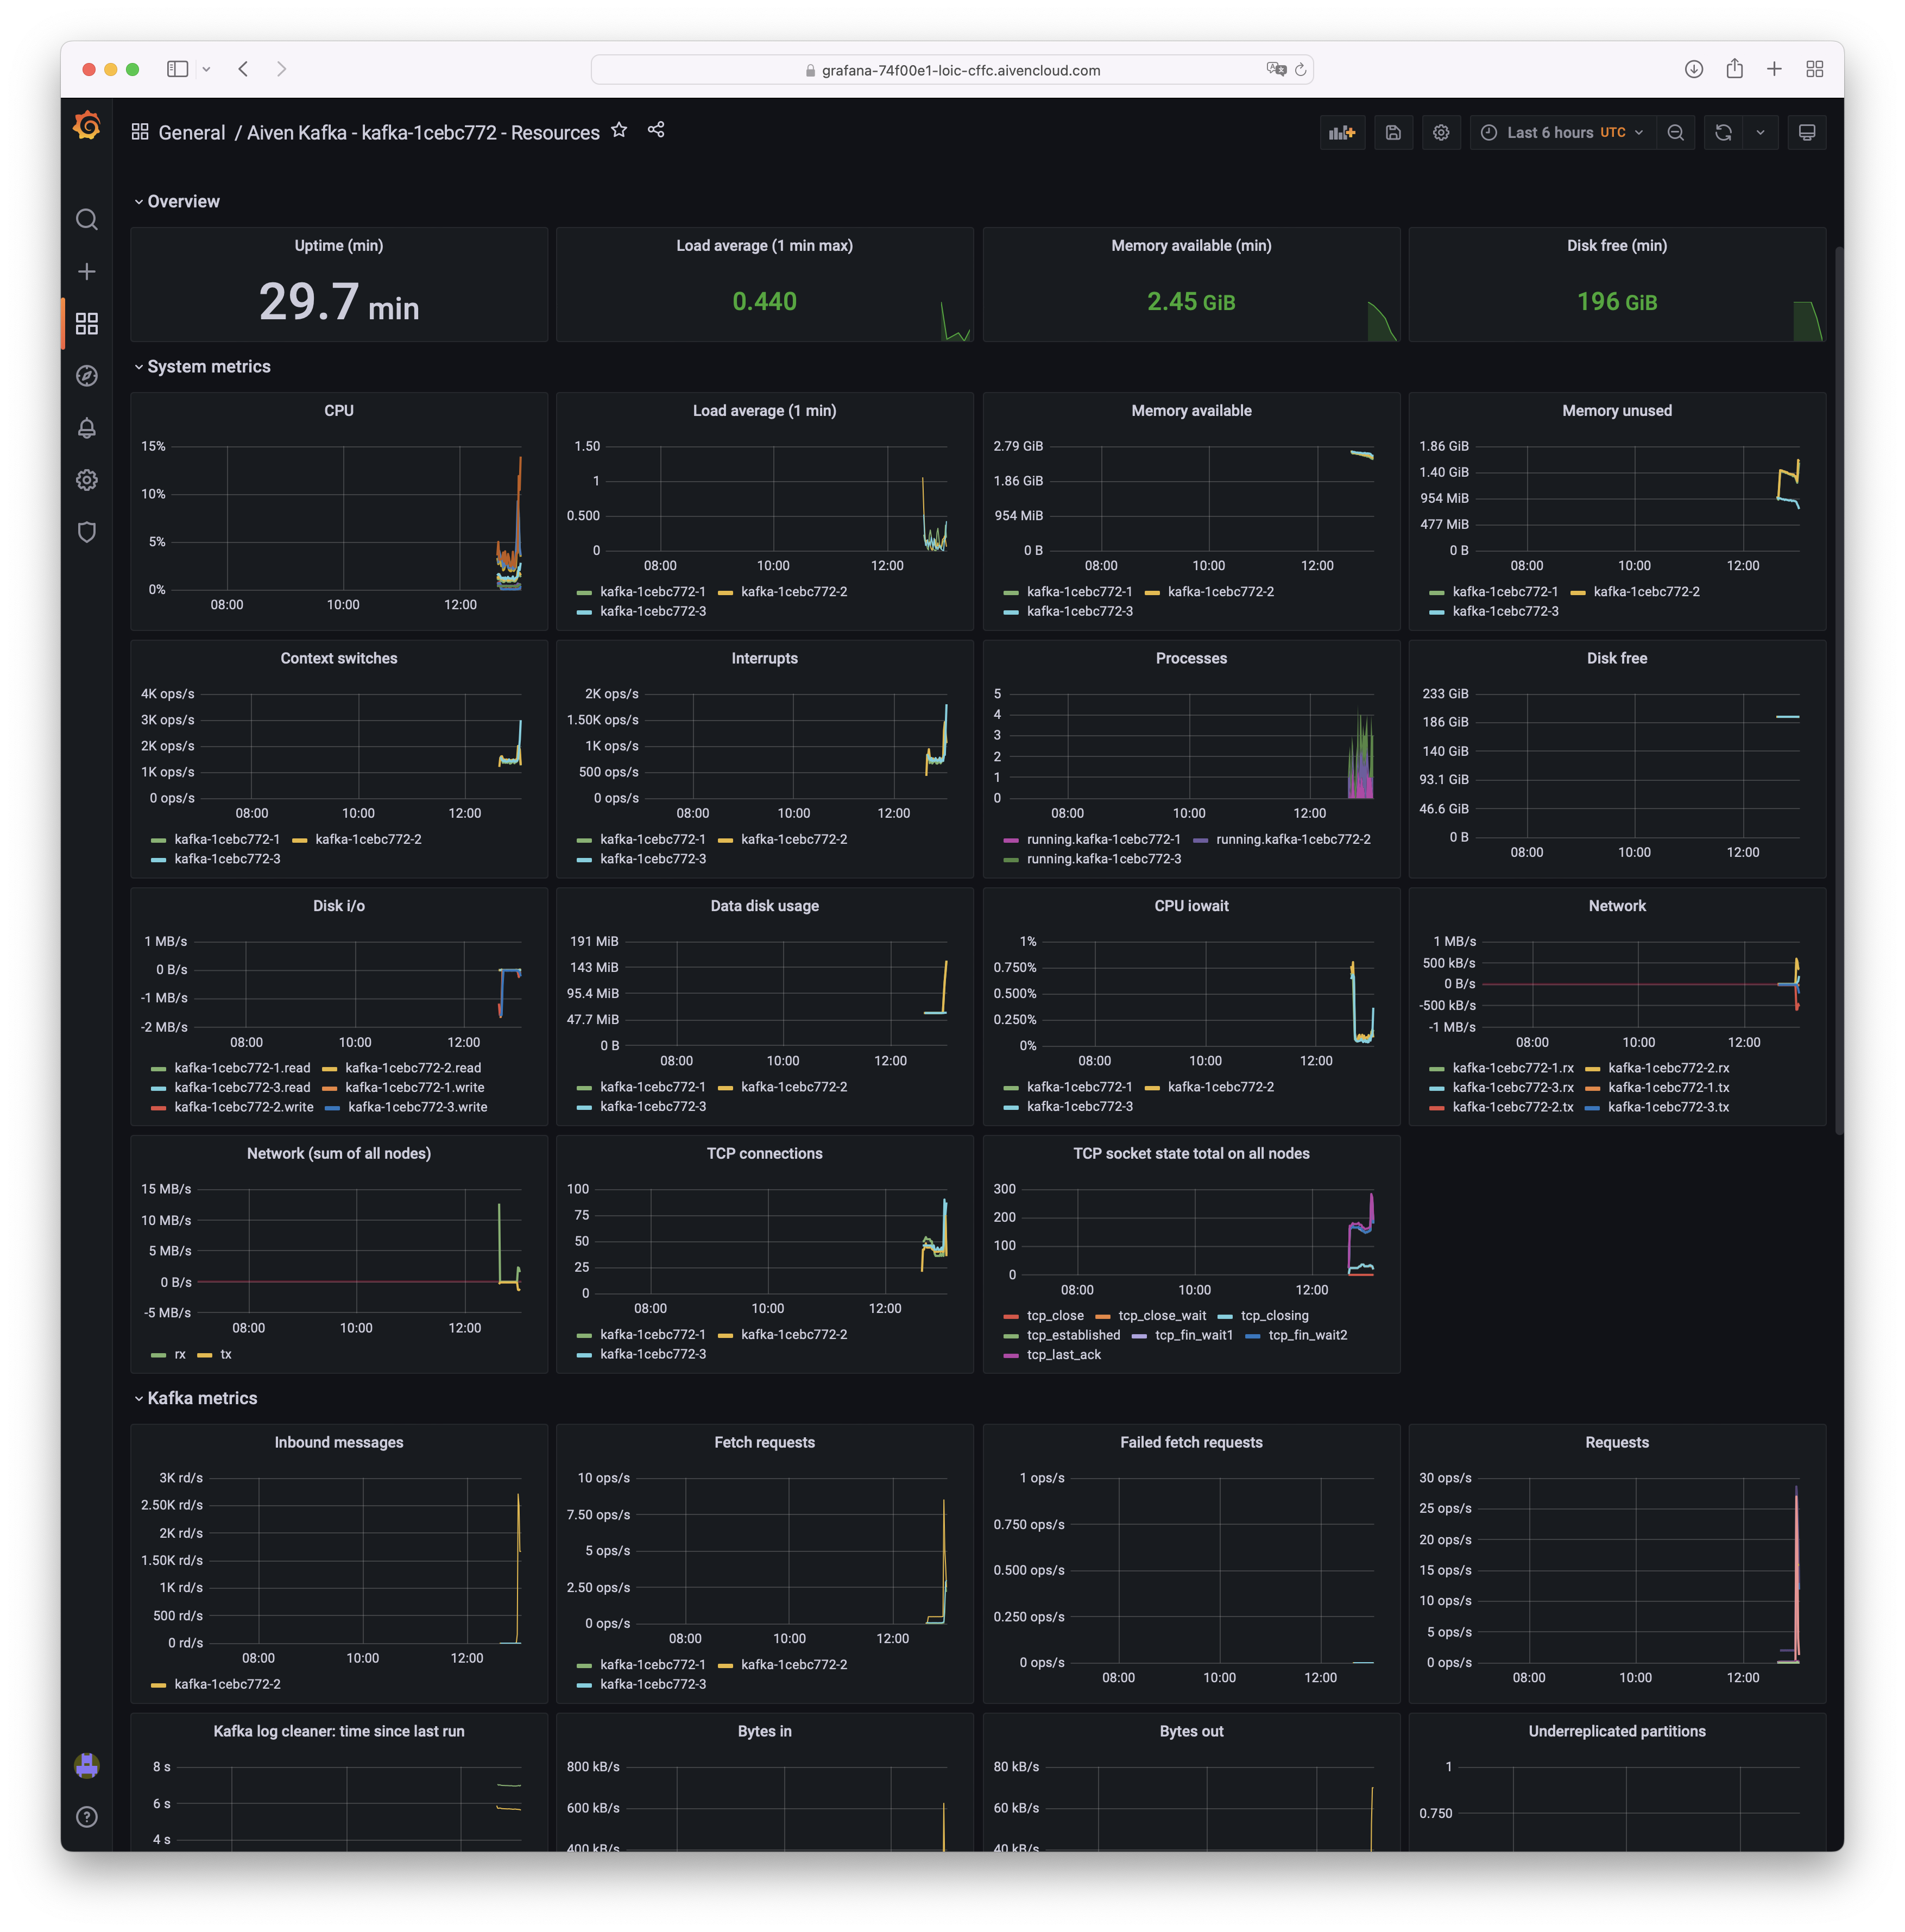
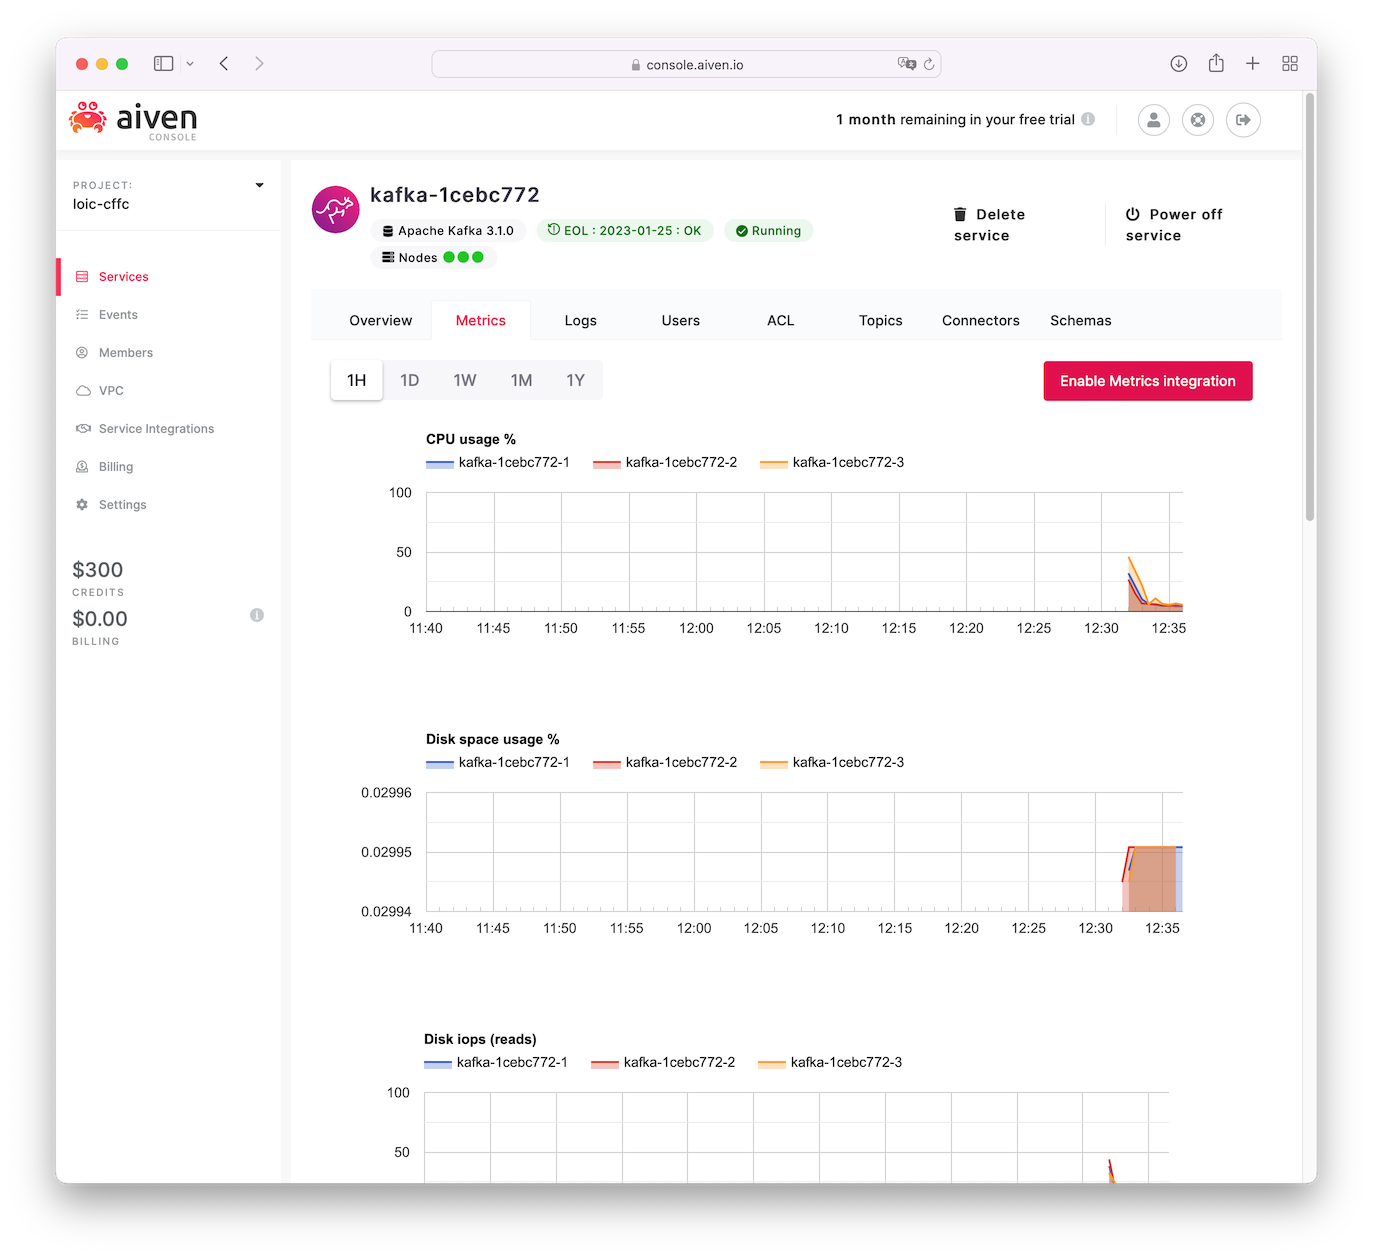
Aiven automatically provides basic host-level resource metrics (CPU, memory, disk and network) for every service under the "Metrics" tab in the service view of the Aiven web console. In your Kafka instance, Enable metric integration
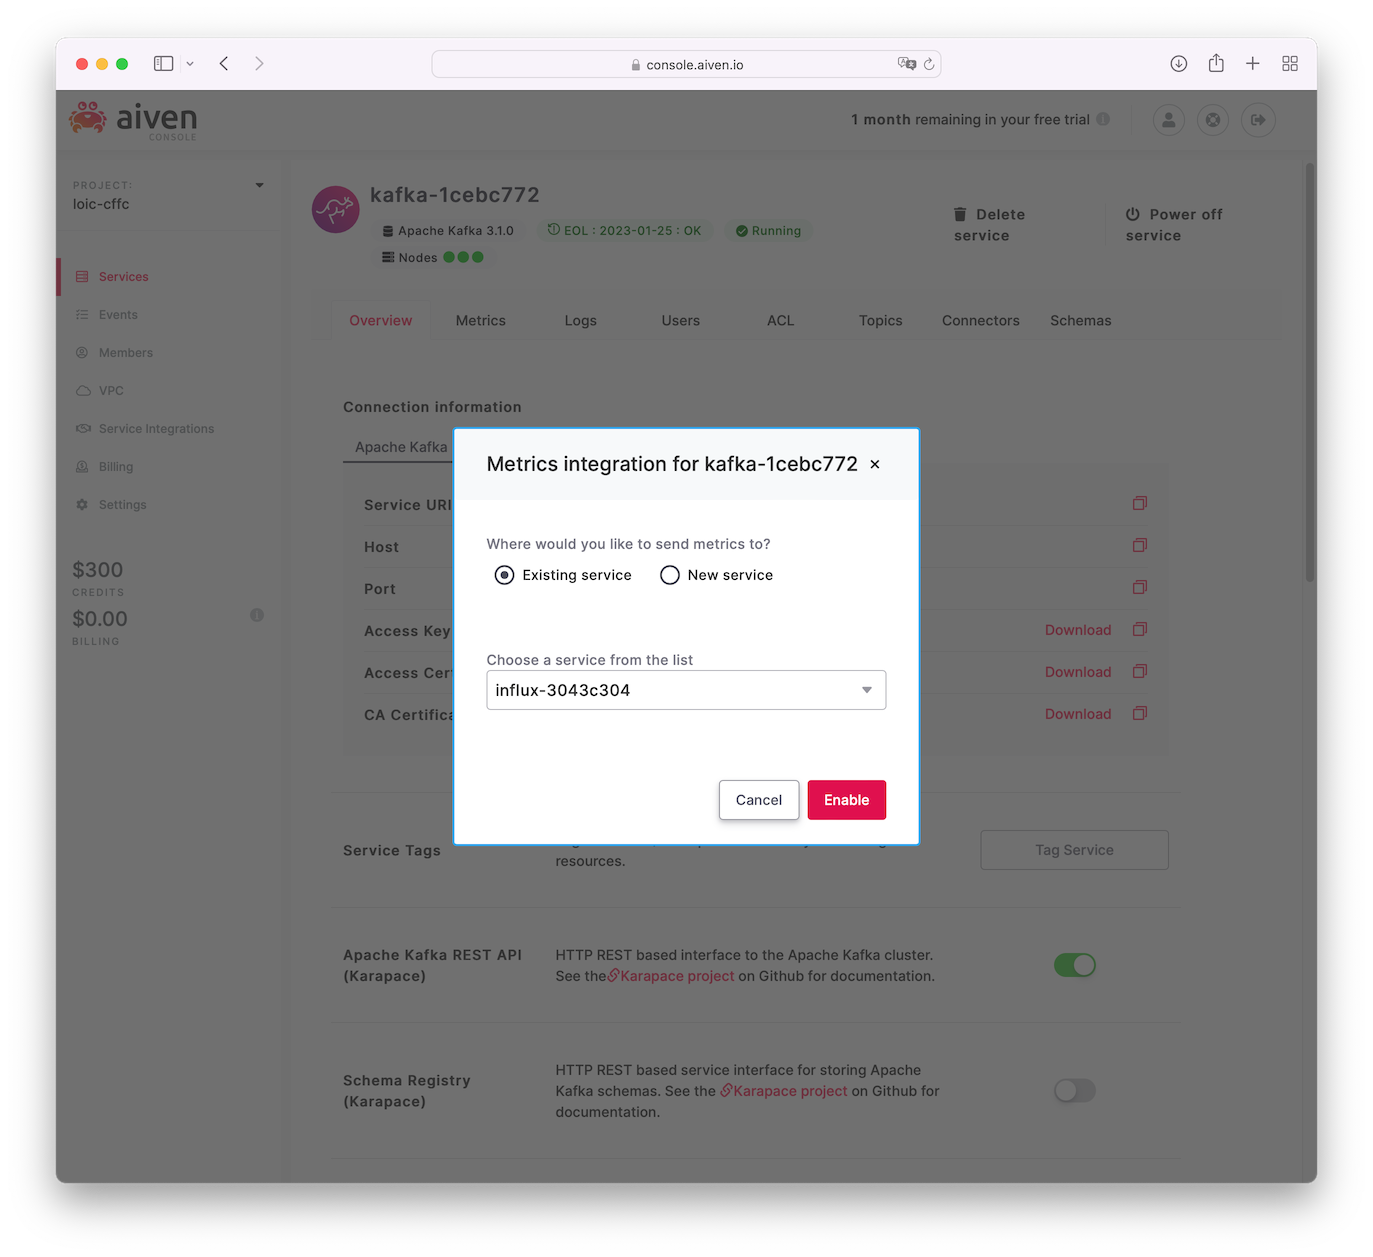
As we have deployed an InfluxDB, select your InfluxDB service
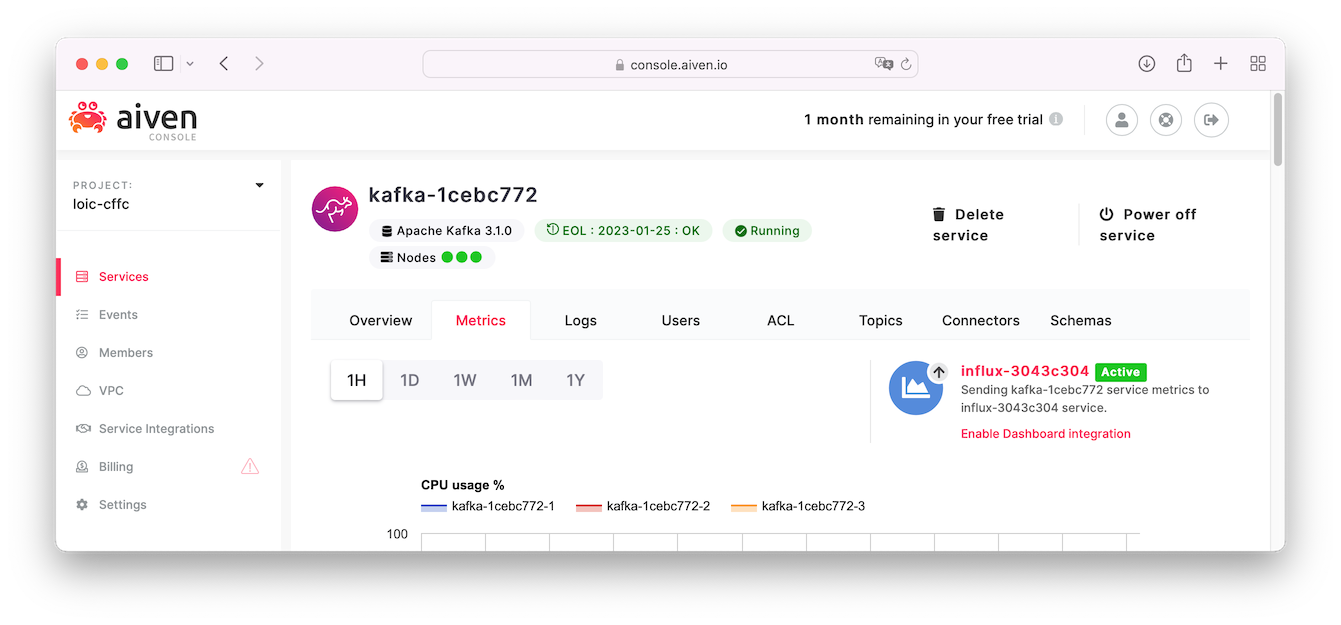
Next you can enable the Grafana dashboard integration
Select your deployed Grafana service
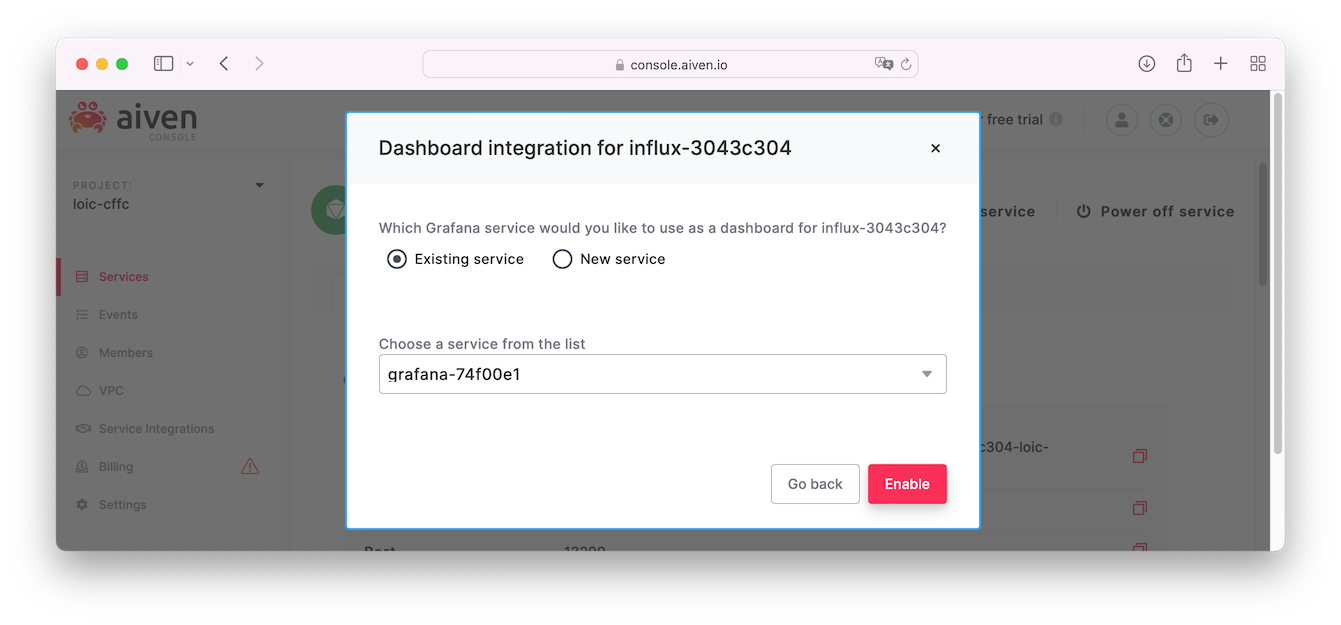
Both integrations are now set up
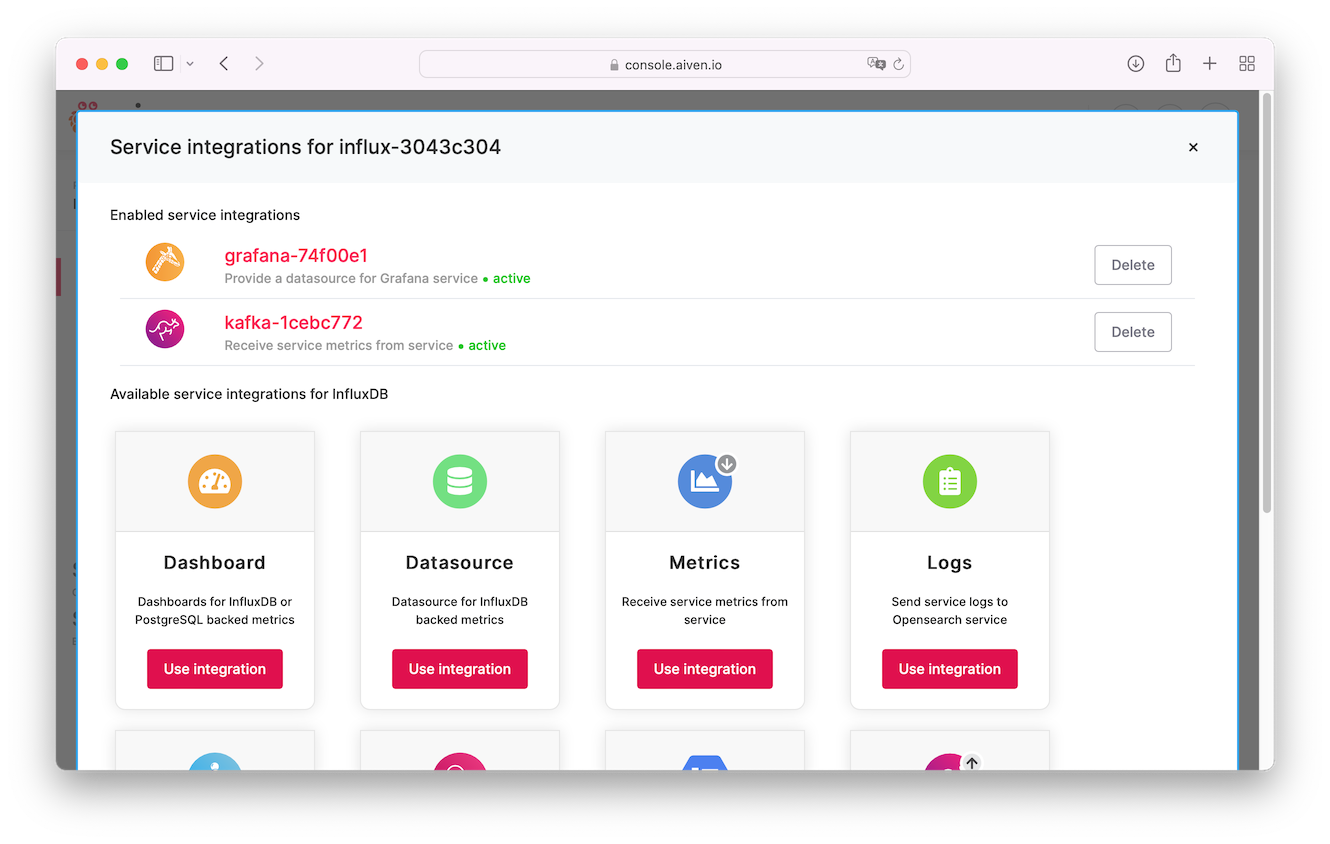
Access your Grafana through the provided URL to visualise the dashboard
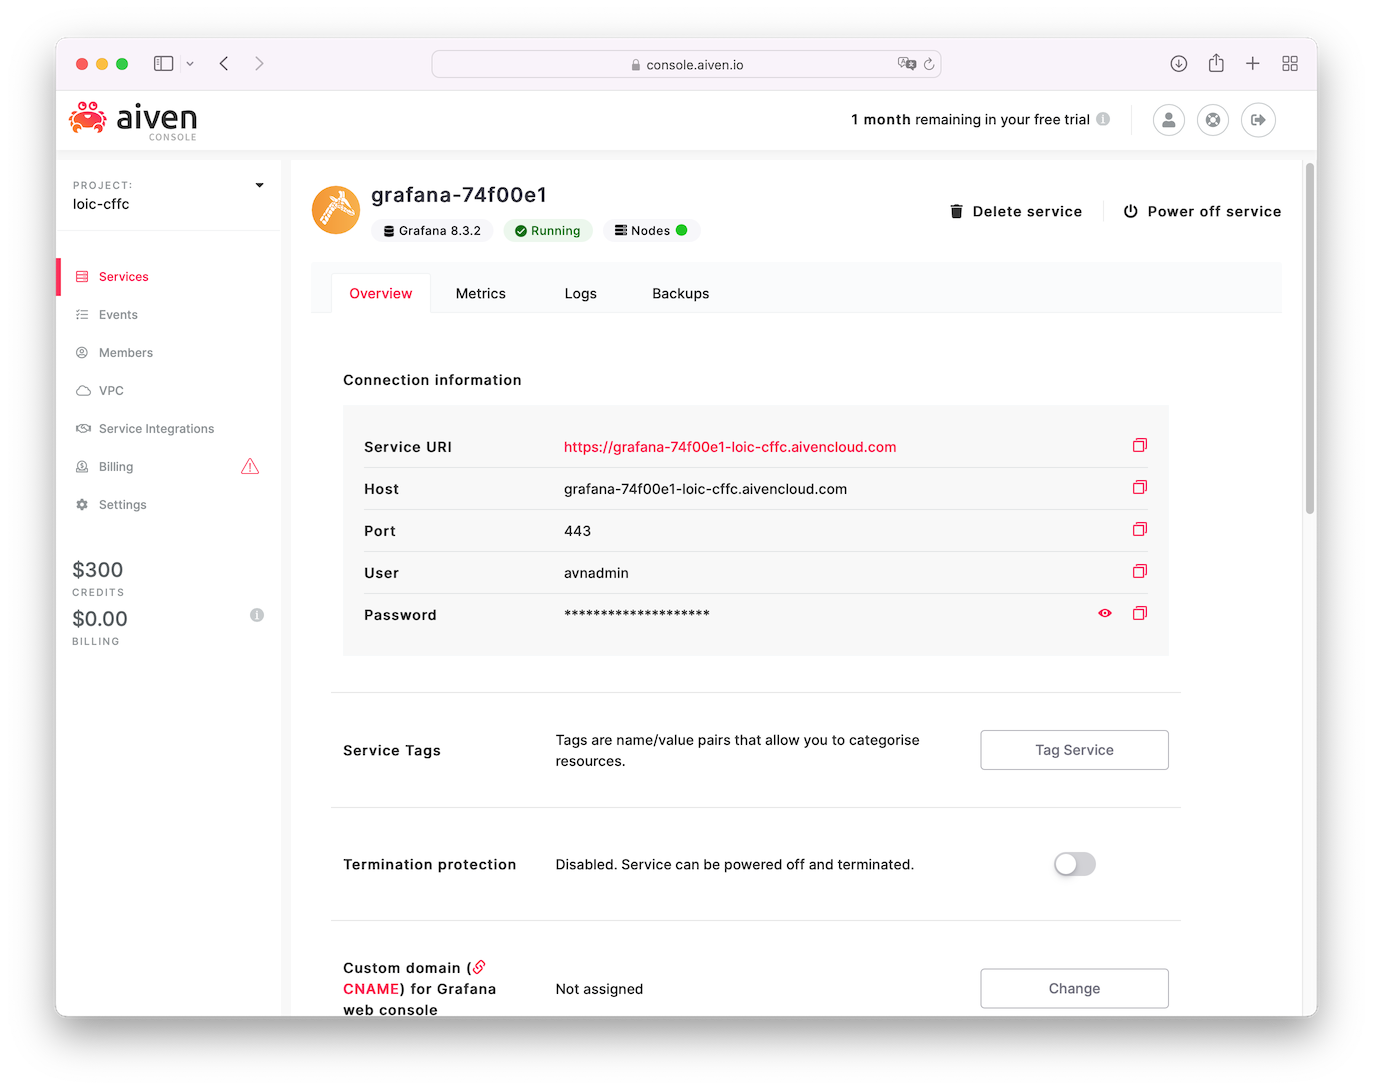
In Grafana, browse your available dashboard and select your Kafka ressource
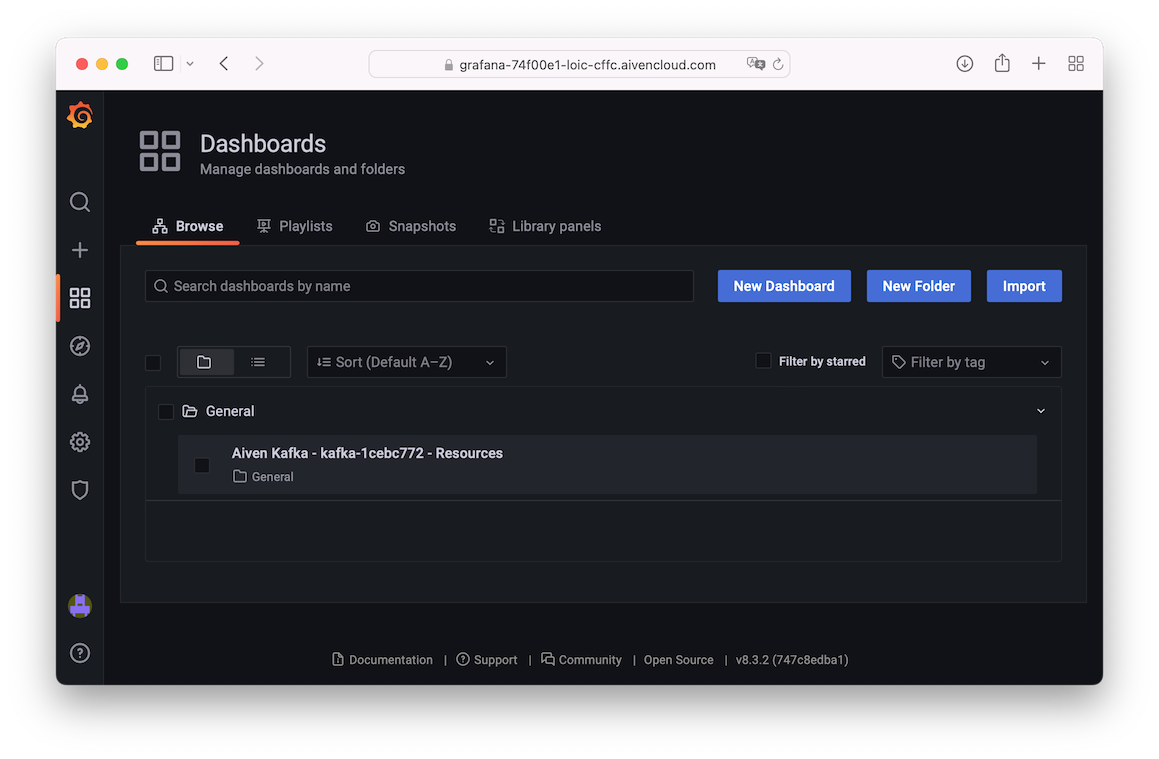
You can now visualise your Kafka metrics, monitor them and set automatic alerts
