Error Rate Demo
Proof of concept demo for metric observability and alerting on errors in a Spring Boot service using Prometheus, and Grafana.
Requirements
Build
First build the spring boot application.
./gradlew buildThen build the docker images
docker compose buildRun
docker compose upAfter all services have started successfully, you can navigate to the following URLs:
- error-rate-demo Spring Boot service Prometheus endpoint
- Prometheus
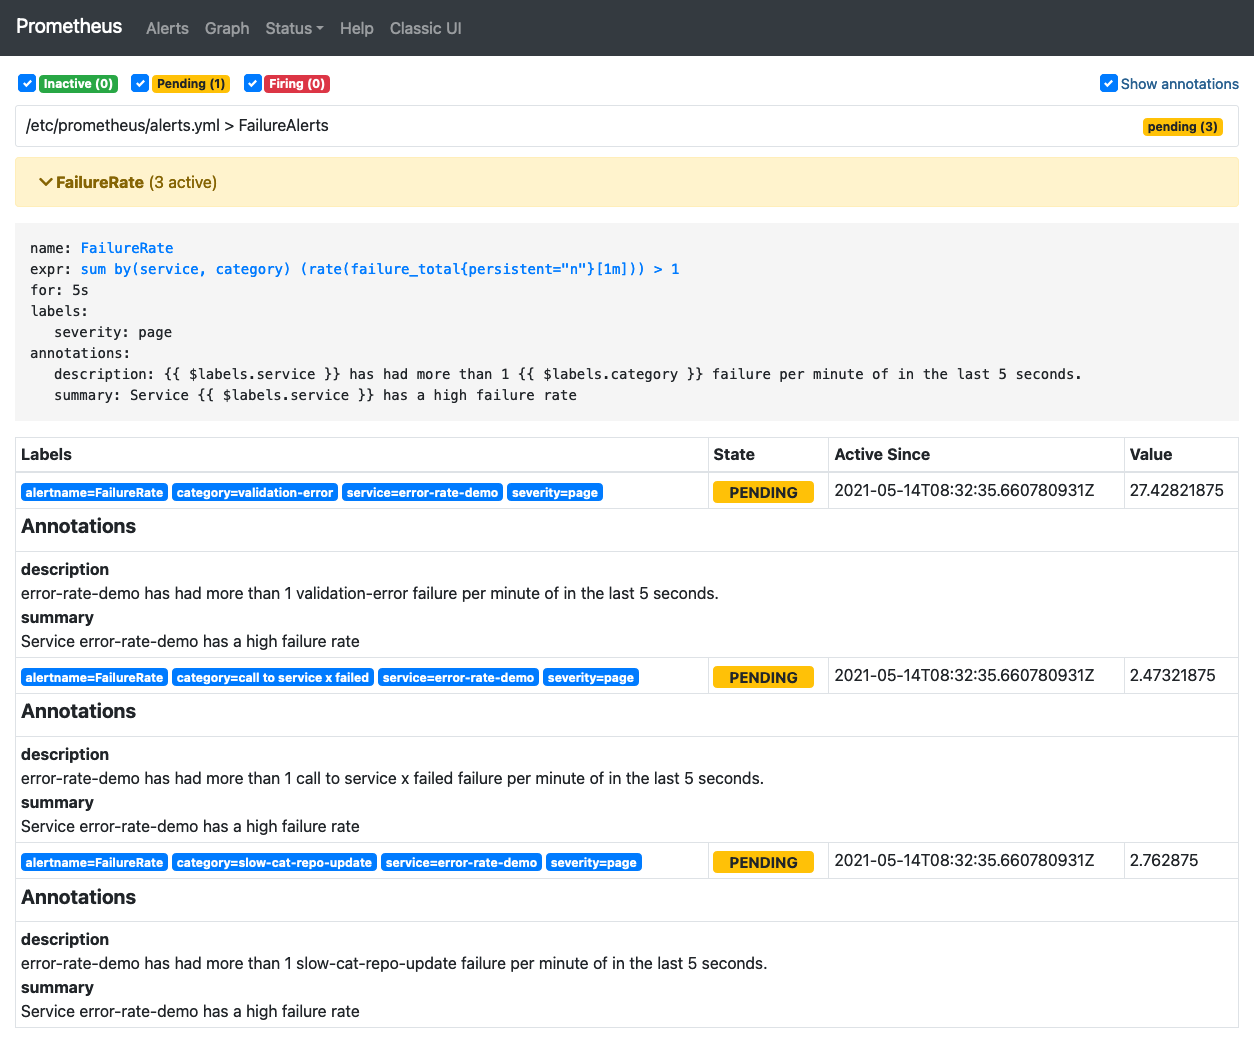
- See the pre-configured alerts
- Grafana
- Username:
admin - Password:
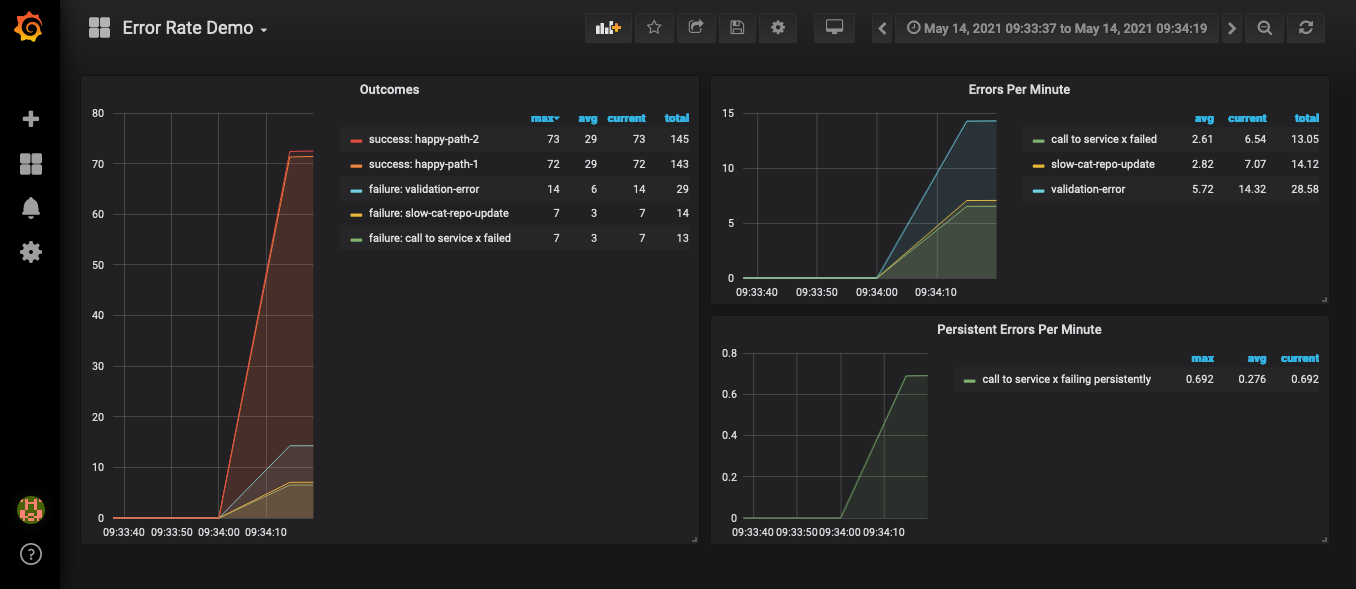
password - See the pre-configured Error Rate Demo dashboard
- Username:
You can then run a simulation via a HTTP POST request
curl --location --request POST 'http://localhost:8080/simulate' \
--header 'Content-Type: application/json' \
--data-raw '{
    "iterations": 10000,
    "happyPathOdds": 1,
    "happyPath2Odds": 1,
    "validationErrorOdds": 1,
    "slowCatRepoUpdateOdds": 0.1,
    "callToXServiceFailedOdds": 0.09,
    "callToXServiceFailedPersistentlyOdds": 0.01
}'
If you prefer to use postman there is a collection in the src/test/postman directory.
Example output after a simulation run
Error Rate Demo prometheus endpoint
# HELP failure_total
# TYPE failure_total counter
failure_total{cause="slow-cat-repo-update",persistent="n",} 331.0
failure_total{cause="validation-error",persistent="n",} 3131.0
failure_total{cause="call to service x failed",persistent="n",} 304.0
failure_total{cause="call to service x failing persistently",persistent="y",} 34.0
# HELP success_total
# TYPE success_total counter
success_total{category="happy-path-2",} 3136.0
success_total{category="happy-path-1",} 3064.0

