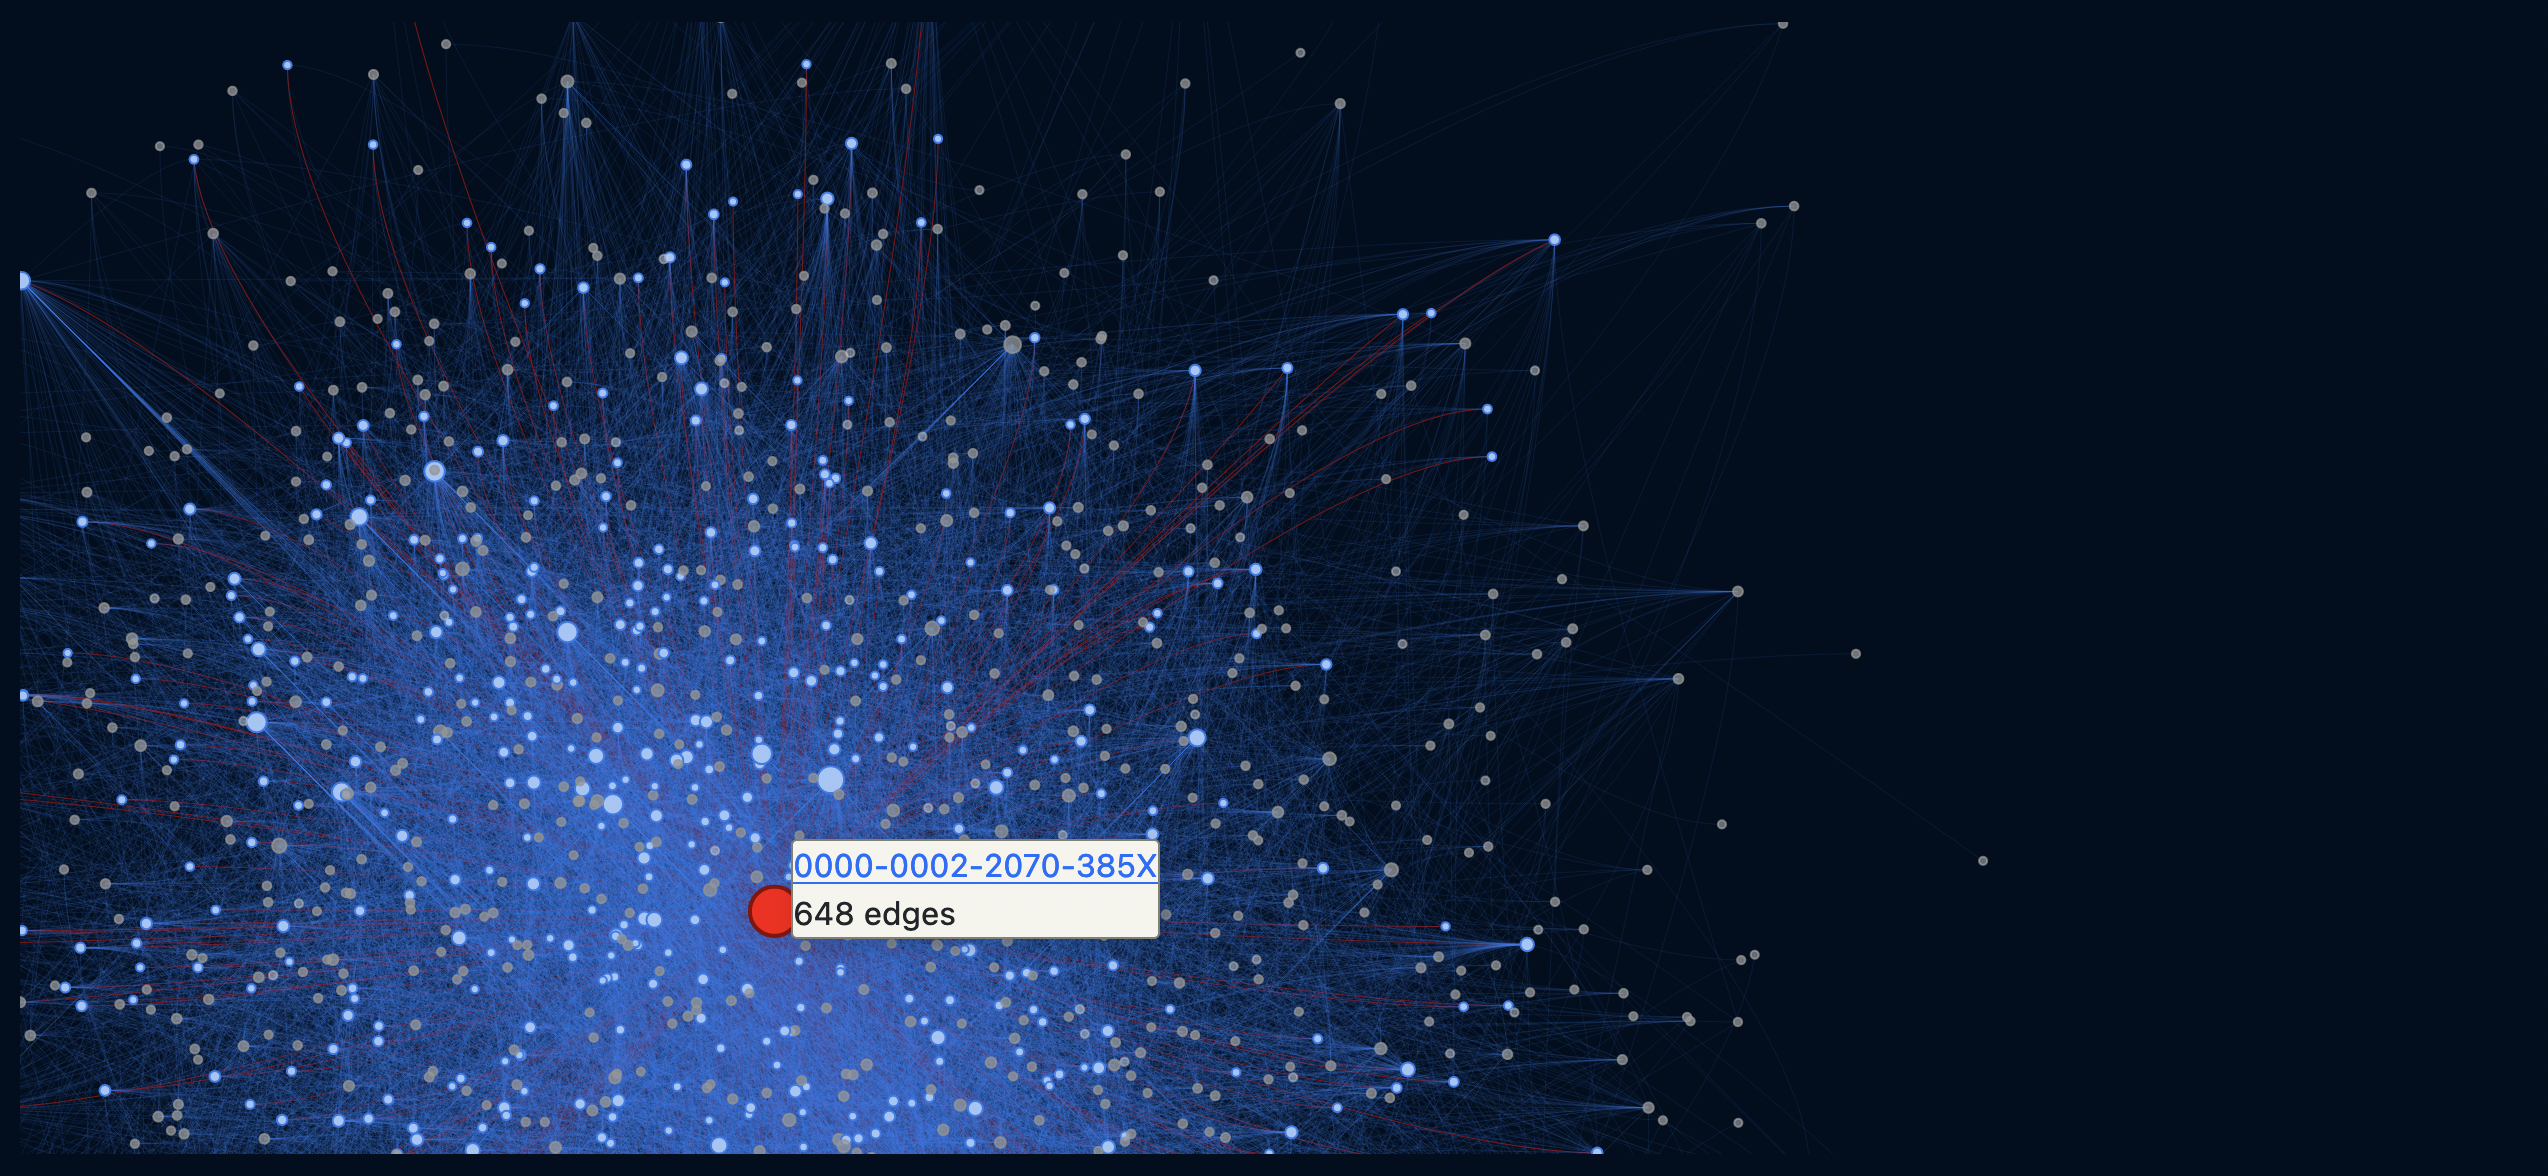
As of Elmos takeover of Twitter, John Beatty (Twitter, Mastodon) started to collect the ORCID handles and followings of researchers on Twitter to preserve the "Science Twitter Graph".
I spontaneously wrote some Python code that creates an interactive network visualization from the OpenCheck data. You can search for your own ORCID ID in the top menu and when you hover over nodes, a link to the respective ORCID page pops up. In the beginning I rendered it with "live" physics. After it got to big, I switched to the Fruchterman-Reingold algorithm.
First commit: 641 nodes with 4995 edges.
2 hours later: 859 nodes with 7922 edges.
6 hours later: 1143 nodes with 12536 edges.
24 hours later: 1652 nodes with 17235 edges.
...
Data source: OpenCheck
Code Packages: pyvis, visjs, igraph, networkx
License: CC0

