- What are the dimensions of the dataset?
- Are there any missing values?
- What attributes and data types it contains?
- How many unique values?
- What time window are we looking at?
- How many different customers have bought a product from the company?
- Which day had the most transactions happening?
- What is the average value of a transaction?
- Which products are most popular?
- Additional notes and observations
- Closing Remarks
- Take me to the Dashboard!
- Banner
- Unique Customers
- Transactions
- Revenue
- Daily Transactions and Cumulative Revenue
- Most Popular Products
- Top 20 Customers
- Top 10 Products - Transactions
- Top 10 Products - Quantity
This document describes my process for the Exploratory Data Analysis (EDA) of the online_retail_II dataset.
TLDR: The present document contains a more throughout description of the process, queries and reasoning i use as starting point for most analysis.
If you are a visual learner or not so much into the "tech-side" of data, there is a dashboard with filters for you to play around and come up with some of your own insights!
You can access the dashboard here:
Online Retail - Dashboard
- AWS RDS Postgres instance
(for more information: https://aws.amazon.com/rds/postgresql/)
- Metabase on Heroku
(for more information: https://www.metabase.com/docs/latest/operations-guide/running-metabase-on-heroku.html)
SELECT
    'online_retail' AS table,
    (
        SELECT COUNT(*)
        FROM online_retail

    ) as rows,
    (
        SELECT COUNT(*)
        FROM information_schema.columns
        WHERE table_name = 'online_retail'

) as columns| table | rows | columns |
|---|---|---|
| online_retail | 1,067,371 | 8 |
The dataset has 8 columns and around 1 million rows. Let's see what else we can find...
SELECT 'invoice'     AS column_name, SUM(case when invoice     is NULL then 1 else 0 end) AS null_values FROM online_retail
UNION
SELECT 'stockcode'   AS column_name, SUM(case when stockcode   is NULL then 1 else 0 end) AS null_values FROM online_retail
UNION
select 'description' AS column_name, SUM(case when description is NULL then 1 else 0 end) AS null_values FROM online_retail
UNION
SELECT 'quantity'    AS column_name, SUM(case when quantity    is NULL then 1 else 0 end) AS null_values FROM online_retail
UNION
SELECT 'invoicedate' AS column_name, SUM(case when invoicedate is NULL then 1 else 0 end) AS null_values FROM online_retail
UNION
SELECT 'price'       AS column_name, SUM(case when price       is NULL then 1 else 0 end) AS null_values FROM online_retail
UNION
SELECT 'customer_id' AS column_name, SUM(case when customer_id is NULL then 1 else 0 end) AS null_values FROM online_retail
UNION
SELECT 'country'     AS column_name, SUM(case when country     is NULL then 1 else 0 end) AS null_values FROM online_retail
ORDER BY null_values DESC| column_name | null_values |
|---|---|
| customer_id | 243007 |
| description | 4382 |
| invoice | 0 |
| stockcode | 0 |
| invoicedate | 0 |
| price | 0 |
| quantity | 0 |
| country | 0 |
About a 1/4 of the values are missing from our customer_id column.
Although that may be very relevant because it represents a large fraction of the data and it looks like the main way to identify an unique customer, we still have plenty to work with and to maybe make some assumptions about why is this data missing or what other ways we can identify a customer.
SELECT
    column_name,
    data_type
FROM information_schema.columns
WHERE table_name = 'online_retail'| column_name | data_type |
|---|---|
| invoice | character varying |
| stockcode | character varying |
| description | character varying |
| quantity | bigint |
| invoicedate | timestamp without time zone |
| price | double precision |
| customer_id | double precision |
| country | character varying |
From a quick look at this we can say that this data is about orders made by customers.
-
Products:
stockcode: Categorical / Serial. Possibly the unique ID of a product.price: Quantitative. Assuming its the unitary price of a product.description: Categorical. Description of the product.
-
Customers:
customer_id: Serial. Unique ID of a customer.country: Categorical. Assuming it's the country of origin for an invoice/customer.
-
Orders:
invoice: Serial. Unique ID of each order. A single order can have multiple products.invoicedate: Timestamp. Assuming it's in UTC-0 because most of the customers are from the UK.quantity: Quantitative. Number of unities ordered for a product.
Now that we know more about what data and how much of it we have, it's time to ask some more questions to get a sense of context. We want to use our data to answer some basic who, when, where, what and how many/much questions.
SELECT 'invoice'     AS column_name, COUNT(DISTINCT invoice)     AS unique_values FROM online_retail
UNION
SELECT 'stockcode'   AS column_name, COUNT(DISTINCT stockcode)   AS unique_values FROM online_retail
UNION
SELECT 'description' AS column_name, COUNT(DISTINCT description) AS unique_values FROM online_retail
UNION
SELECT 'quantity'    AS column_name, COUNT(DISTINCT quantity)    AS unique_values FROM online_retail
UNION
SELECT 'invoicedate' AS column_name, COUNT(DISTINCT invoicedate) AS unique_values FROM online_retail
UNION
SELECT 'price'       AS column_name, COUNT(DISTINCT price)       AS unique_values FROM online_retail
UNION
SELECT 'customer_id' AS column_name, COUNT(DISTINCT customer_id) AS unique_values FROM online_retail
UNION
SELECT 'country'     AS column_name, COUNT(DISTINCT country)     AS unique_values FROM online_retail
ORDER BY unique_values DESC
| column_name | unique_values |
|---|---|
| invoice | 53628 |
| invoicedate | 47635 |
| customer_id | 5942 |
| description | 5698 |
| stockcode | 5305 |
| price | 2807 |
| quantity | 1057 |
| country | 43 |
    SELECT
        TO_CHAR(DATE_TRUNC('mon', invoicedate),'Mon/YYYY') AS month,
        COUNT(distinct invoice)                            AS transactions,
        COUNT(distinct customer_id)                        AS customers,
        SUM(price * quantity)                              AS revenue,
        SUM(quantity)                                      AS quantity

    FROM online_retail
    WHERE price > 0 AND quantity > 0
    GROUP BY month
    ORDER BY month DESC

Now we know that this dataset contains data from 53,628 invoices, made by approximately 5942 different customers from 43 countries who bought more than 5 thousand unique products in a two year window from december 2009 to december 2011.
SELECT
    'customer_id' AS column_name,
    COUNT(DISTINCT customer_id) AS n_unique
FROM online_retail| column_name | unique_values |
|---|---|
| customer_id | 5942 |
(note that the real number of unique customer may actually be higher, since nearly 1/4 of all customer_id contain null values)
We can take this one step further and get the top 5 countries with most customers.
SELECT
    country,
    COUNT(DISTINCT customer_id) AS n_unique
FROM online_retail
GROUP BY 1
ORDER BY 2 DESC
LIMIT 5| country | unique_customers |
|---|---|
| United Kingdom | 5410 |
| Germany | 107 |
| France | 95 |
| Spain | 41 |
| Belgium | 29 |
Most customers are from the United Kingdom, followed by a few neighbouring countries, this might suggest that the data is from a british online retailer that sells mostly within Europe.
SELECT
    CAST(date_trunc('d',invoicedate) AS DATE) AS day,
    COUNT(distinct invoice)                   AS daily_transactions
FROM online_retail
GROUP BY day
ORDER BY daily_transactions DESC
LIMIT 1| day | transaction_count |
|---|---|
| 2010-11-04 | 219 |
The day with most transaction was november the 4th, 2010 with 219 unique transactions.
Let's se the top 10, it's the same query so we just have to increase the limit of returning rows.
...
LIMIT 10| day | daily_transactions |
|---|---|
| 2010-11-04 | 219 |
| 2011-10-06 | 218 |
| 2010-10-05 | 206 |
| 2009-12-22 | 203 |
| 2010-11-11 | 192 |
| 2010-11-24 | 188 |
| 2011-11-10 | 184 |
| 2010-12-09 | 183 |
| 2010-11-25 | 181 |
| 2010-05-11 | 180 |
Looks like the peak in transaction volume happens by the end of the year, likely due to holliday season. What about on a weekly basis?
SELECT
    CAST(date_trunc('week',invoicedate) AS DATE) AS week,
    COUNT(distinct invoice) AS weekly_transactions
FROM online_retail
GROUP BY week
ORDER BY weekly_transactions DESC
LIMIT 10| week | weekly_transactions |
|---|---|
| 2011-11-14 | 894 |
| 2010-11-01 | 891 |
| 2010-11-22 | 854 |
| 2010-11-08 | 834 |
| 2011-11-28 | 824 |
| 2010-11-29 | 808 |
| 2010-11-15 | 795 |
| 2011-11-07 | 781 |
| 2011-11-21 | 754 |
| 2010-10-18 | 750 |
Seems like november has been the best month for sales on both years.
We will consider the transaction value as the sum of prices times the quantity ordered for any single invoice.
(obs: there are a few prices with negative value and a description of "adjusted bad debit", so we are going to disconsider all negative prices)
The average reduces a series of numbers into a single number, while useful, alone it can lead to misinterpretations. So as to avoid this common pitfall, let's see how are the transaction values distributed along the it's range.
with a as (

    SELECT
        invoice,
        sum(price * quantity)                          AS transaction_value
    FROM online_retail
    WHERE price > 0 and quantity > 0
    GROUP BY 1
    ORDER BY 2 asc

), b as (

    SELECT
        *,
        ntile(4) OVER (ORDER BY transaction_value ASC) AS quartile
    FROM a
)

SELECT
    'First Quartile'                                   AS measure,
    max(transaction_value)                             AS value
    from b
    where quartile = 1
UNION
SELECT
    'Mode'                                             AS measure,
    mode() WITHIN GROUP (ORDER BY transaction_value)   AS value
   FROM b
UNION
SELECT
    'Median'                                           AS measure,
    max(transaction_value)                             AS value
    FROM b
    WHERE quartile = 2
UNION
SELECT
    'Third Quartile'                                   AS measure,
    max(transaction_value)                             AS value
    FROM b
    WHERE quartile = 3
UNION
SELECT
    'Min'                                              AS measure,
    round(min(transaction_value)::numeric,2)           AS value
    FROM b
UNION
SELECT
    'Avg'                                              AS measure,
    round(avg(transaction_value)::numeric,2)           AS value
    FROM b
UNION
SELECT
    'StdDev'                                           AS measure,
    round(stddev_samp(transaction_value)::numeric,2)   AS value
    FROM b
UNION
SELECT
    'Max'                                              AS measure,
    round(max(transaction_value)::numeric,2)           AS value
    FROM b
ORDER BY value ASC| measure | value |
|---|---|
| Min | 0.19 |
| Mode | 15.00 |
| First Quartile | 151.97 |
| Median | 304.32 |
| Third Quartile | 504.90 |
| Avg | 523.30 |
| StdDev | 1517.35 |
| Max | 168469.60 |
SQL is an amazing language and can do most of the work, but it can also get quite verbose for simple things. Using the python library pandas we can obtain the same results with much less typing!
import pandas as pd
sql = """
  SELECT
       distinct invoice,
       sum(price * quantity) as transaction_amount
   FROM online_retail
   where price > 0 AND quantity > 0
   GROUP BY 1
   ORDER BY 2 asc
"""

df = pd.read_sql(sql, engine)
r = df.describe()
r.sort_values('transaction_amount').round(2)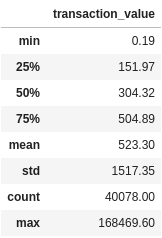

This tell us that while the average transaction is just over $500.00, half of all transactions are under $300.00 and the most common value for a transaction is as low as $15.00.
The standard deviation is roughly 3 times the average, and the maximum price more than $160k, which indicates a large deviation probably due to some large outliers.
In other words, when we ask about averages, we are often looking for a "center of balance" in those numbers. One way to get a feel for this center, is by looking at the skewness of the data, or how unbalanced it is.
With this in mind we know there is a higher concentration of transactions with lower values that decreases fast towards higher values.
let's make this more visual, and plot with the help of some python libraries:
import pandas as pd
from matplotlib import pyplot as plt

sql = """

    SELECT
        invoice,
        sum(price * quantity) AS transaction
    FROM online_retail
    WHERE price > 0 and quantity > 0
    GROUP BY 1
    ORDER BY 2 asc

"""
# the engine param is the actual database api connection.
# I've used the sqlalchemy.create_engine() method for the engine object
# read more at: https://docs.sqlalchemy.org/en/14/core/engines.html
df = pd.read_sql(sql, engine)

# getting the values for our three mains measures of central tendency
mean = df.mean()['transaction']
median = df.median()['transaction']
mode = df.mode()['transaction'].iloc[0]

# plotting the frequency histogram
plt.figure(figsize=(10,5))

# limit x and y axis to improve readability, high-end prices were cut off from the view.
plt.ylim(0,4000)
plt.xlim(-50,2000)

# add labels to each axis
plt.ylabel('Frequency')
plt.xlabel('Transaction Amount')

# the actual histogram method
plt.hist(x=df['transaction'], bins=5000)

# plot the lines with central tendencies
plt.axvline(mean, color='r', linestyle='dashed', linewidth=1)
plt.text(mean + 10, 3600, f'Mean\n{mean:.2f}')

plt.axvline(median, color='r', linestyle='dashed', linewidth=1)
plt.text(median + 10, 3600, f'Median\n{median:.2f}')

plt.axvline(mode, color='r', linestyle='dashed', linewidth=1)
plt.text(mode + 10, 3600, f'Mode\n{mode:.2f}')
With a quick glance at this histogram we can say that the average is 523, but most transactions fall between ~50 and ~300.
What are we going to consider as popular?
- By number of transactions:
SELECT
    stockcode,
    description,
    COUNT(distinct invoice) AS transactions
FROM online_retail
GROUP BY 1, 2
ORDER BY 3 DESC
LIMIT 10| stockcode | description | transactions |
|---|---|---|
| 85123A | WHITE HANGING HEART T-LIGHT HOLDER | 5495 |
| 22423 | REGENCY CAKESTAND 3 TIER | 4261 |
| 85099B | JUMBO BAG RED RETROSPOT | 3320 |
| 84879 | ASSORTED COLOUR BIRD ORNAMENT | 2827 |
| 47566 | PARTY BUNTING | 2699 |
| 21232 | STRAWBERRY CERAMIC TRINKET BOX | 2488 |
| 20727 | LUNCH BAG BLACK SKULL. | 2396 |
| 21931 | JUMBO STORAGE BAG SUKI | 2364 |
| 22411 | JUMBO SHOPPER VINTAGE RED PAISLEY | 2215 |
| 22469 | HEART OF WICKER SMALL | 2174 |
- By total quantity sold
SELECT
    stockcode,
    description,
    sum(quantity) AS total_quantity
FROM online_retail
GROUP BY 1, 2
ORDER BY 3 DESC
LIMIT 10| stockcode | description | total_quantity |
|---|---|---|
| 84077 | WORLD WAR 2 GLIDERS ASSTD DESIGNS | 108545 |
| 85123A | WHITE HANGING HEART T-LIGHT HOLDER | 92453 |
| 84879 | ASSORTED COLOUR BIRD ORNAMENT | 81306 |
| 85099B | JUMBO BAG RED RETROSPOT | 77671 |
| 17003 | BROCADE RING PURSE | 70700 |
| 21977 | PACK OF 60 PINK PAISLEY CAKE CASES | 56575 |
| 84991 | 60 TEATIME FAIRY CAKE CASES | 54366 |
| 22197 | SMALL POPCORN HOLDER | 49616 |
| 21212 | PACK OF 72 RETROSPOT CAKE CASES | 49344 |
| 21212 | PACK OF 72 RETRO SPOT CAKE CASES | 46106 |
- By revenue generated
SELECT
    stockcode,
    description,
    round(sum(price * quantity)::numeric,2) AS revenue
FROM online_retail
GROUP BY 1, 2
ORDER BY 3 DESC
LIMIT 10| stockcode | description | revenue |
|---|---|---|
| 22423 | REGENCY CAKESTAND 3 TIER | 327813.65 |
| DOT | DOTCOM POSTAGE | 322647.47 |
| 85123A | WHITE HANGING HEART T-LIGHT HOLDER | 253541.51 |
| 47566 | PARTY BUNTING | 147948.50 |
| 85099B | JUMBO BAG RED RETROSPOT | 46689.00 |
| 84879 | ASSORTED COLOUR BIRD ORNAMENT | 131413.85 |
| 22086 | PAPER CHAIN KIT 50'S CHRISTMAS | 121662.14 |
| POST | POSTAGE | 112341.00 |
| 79321 | CHILLI LIGHTS | 84854.16 |
| 84347 | ROTATING SILVER ANGELS T-LIGHT HLDR | 73814.72 |
Now, lets try and plot all this information combined to see the performances for the top 10 products, this time with Metabase, our BI tool of choice
 Click Here
to see this chart on Metabase.
Click Here
to see this chart on Metabase.
- Which products show in all three results?
WITH a as (

    SELECT
        stockcode,
        description,
        COUNT(distinct invoice)                 AS transactions
    FROM online_retail
    GROUP BY 1, 2
    ORDER BY 3 DESC
    LIMIT 10

), b as (

    SELECT
        stockcode,
        description,
        sum(quantity)                           AS quantity
    FROM online_retail
    GROUP BY 1, 2
    ORDER BY 3 DESC
    LIMIT 10

), c as (

    SELECT
        stockcode,
        description,
        round(sum(price * quantity)::numeric,2) AS revenue
    FROM online_retail
    GROUP BY 1, 2
    ORDER BY 3 DESC
    LIMIT 10

)

SELECT
    a.stockcode,
    a.description,
    a.transactions,
    b.quantity,
    c.revenue
FROM a
    INNER JOIN b ON a.stockcode = b.stockcode
    INNER JOIN c ON a.stockcode = c.stockcode
ORDER BY quantity DESC| stockcode | description | transactions | quantity | revenue |
|---|---|---|---|---|
| 85123A | WHITE HANGING HEART T-LIGHT HOLDER | 5,495 | 92,453 | 253,541.51 |
| 84879 | ASSORTED COLOUR BIRD ORNAMENT | 2,827 | 81,306 | 131,413.85 |
| 85099B | JUMBO BAG RED RETROSPOT | 3,320 | 77,671 | 146,689.00 |
Who would guess heart hanging light holders would be so popular?!

And even if we filter by unique customers these hanging lights still outperform the other products, being ordered by 1.4k unique customers in more than 20 countries!
SELECT
	stockcode,
	description,
	count(DISTINCT customer_id) AS unique_customers,
	count(DISTINCT country)     AS unique_countries
FROM online_retail
GROUP BY 1, 2
ORDER BY 3 desc
LIMIT 5| stockcode | description | unique_customers | unique_countries |
|---|---|---|---|
| 85123A | WHITE HANGING HEART T-LIGHT HOLDER | 1494 | 23 |
| 22423 | REGENCY CAKESTAND 3 TIER | 1316 | 31 |
| 22138 | BAKING SET 9 PIECE RETROSPOT | 1152 | 31 |
| 84879 | ASSORTED COLOUR BIRD ORNAMENT | 1012 | 19 |
| 22086 | PAPER CHAIN KIT 50'S CHRISTMAS | 896 | 12 |
Negative quantities and prices
While there is just one distinct stockcode and 5 rows where the price is negative, there are more than 4,000 distinct stockcode values where the quantity for that row is negative.
SELECT
    DISTINCT stockcode,
    invoice,
    quantity,
    price,
    description
FROM online_retail
WHERE price < 0
ORDER BY 1| stockcode | invoice | quantity | price | description |
|---|---|---|---|---|
| B | A506401 | 1 | -53594.36 | Adjust bad debt |
| B | A516228 | 1 | -44031.79 | Adjust bad debt |
| B | A528059 | 1 | -38925.87 | Adjust bad debt |
| B | A563186 | 1 | -11062.06 | Adjust bad debt |
| B | A563187 | 1 | -11062.06 | Adjust bad debt |
I've noticed most of the invoices starting with C hold negative quantities except for 1 row, but there are plenty other invoices with negative quantities, at first glance i couldn't see any specific identifier for these negative quantities. Perhaps it has to do with cancelled orders, or returning products.
The best way would be to understand where these stockcodes come from and how they are inputed to the system, but while that may not always be possible, a deeper exploration crossing prices, quantities and descriptions could expose some underlying relationships in the data.
From here on we could continue our exploration, trying to understand all the meaningful relations between products, orders, customers and countries.
There is enough data here alone to learn many things and ask many questions, but like any creative endeavour, one must know when to stop and present what was found so far, get feedback from peers and keep check with relevant stakeholders that rely on your work before going further with the analysis.
Data can tell us a lot, but data alone is not enough, Data Science/Analytics/Engineering is about learning, sharing, questioning and communicating. It's about translation, meaning and memory, about being curious and open-minded.
Good data analytics should feel intuitive and simple, despite how technically challenging it can be to achieve such results.
⇒ Take me to the Dashboard!
The syntax {% raw %}[[ {{ Filter Name }} ]]{% endraw %} is a template syntax used by metabase to allow for dynamic charts using SQL and custom filters.
All the queries in the dashboard contain dynamic filters for month/year and country. The images under each query here show the results for November 2010, but you can input any month from dec/2009 to dec/2011 to see the compiled data for that month.
SELECT concat('You are viewing data from : ', to_char(mon, 'Month YYYY'))
FROM (

    SELECT date_trunc('mon', invoicedate) AS mon
    FROM online_retail
    {% raw %}
    [[WHERE {{Month}}]]
    {% endraw %}
) AS a
LIMIT 1
    SELECT COUNT(DISTINCT customer_id)
    FROM online_retail
    WHERE customer_id IS NOT NULL
    {% raw %}
    [[AND {{Month}}]]
    [[AND {{Country}}]]
    {% endraw %}
SELECT
    COUNT(DISTINCT invoice) AS Transactions
FROM online_retail
{% raw %}
[[WHERE {{Month}}]]
[[AND {{Country}}]]
{% endraw %}
SELECT
    SUM(price * quantity)
FROM online_retail
WHERE price > 0 AND quantity > 0
{% raw %}
[[WHERE {{Month}}]]
[[AND {{Country}}]]
{% endraw %}
SELECT
    day,
    daily_transactions,
    SUM(revenue) OVER (ORDER BY day ROWS BETWEEN UNBOUNDED PRECEDING AND CURRENT ROW) AS cumulative_revenue
FROM (

    SELECT
        DATE_TRUNC('d', CAST(invoicedate AS timestamp)) AS day,
        COUNT(distinct invoice)                         AS daily_transactions,
        SUM(price * quantity)                           AS revenue
    FROM online_retail
    WHERE price > 0 AND quantity > 0
    {% raw %}
    [[AND {{Month}}]]
    [[AND {{Country}}]]
    {% endraw %}
    GROUP BY 1
    ORDER BY 1 DESC

) as a
SELECT
    stockcode,
    description,
    COUNT(distinct invoice) As transactions,
    SUM(quantity)           AS quantity,
    SUM(price * quantity)   AS revenue
FROM online_retail
{% raw %}
[[WHERE {{Month}}]]
[[AND {{Country}}]]
{% endraw %}
GROUP BY 1, 2
ORDER BY 3 DESC
LIMIT 10
SELECT
    customer_id,
    SUM(price * quantity)   AS revenue,
    SUM(quantity)           AS quantity,
    COUNT(DISTINCT invoice) AS transactions
FROM online_retail
WHERE customer_id IS NOT NULL
  AND price > 0 AND quantity > 0
  {% raw %}
  [[AND {{Month}}]]
  [[AND {{Country}}]]
  {% endraw %}
GROUP BY 1
ORDER BY 2 DESC
LIMIT 20
SELECT
    stockcode,
    description,
    COUNT(distinct invoice) AS transactions,
    SUM(quantity)           AS quantity
FROM online_retail
{% raw %}
WHERE {{Month}}
[[AND {{Product}}]]
[[AND {{Country}}]]
{% endraw %}
GROUP BY 1, 2
ORDER BY 3 desc
LIMIT 10
SELECT
    stockcode,
    description,
    COUNT(distinct invoice) as transactions,
    SUM(quantity) as quantity

FROM online_retail
{% raw %}
[[WHERE {{Month}}]]
[[AND {{Country}}]]
{% endraw %}
GROUP BY 1, 2
ORDER BY 4 desc
LIMIT 10