Author: Ian Tulienge

Microsoft is entering the highly competitive movie industry with the goal of producing successful films that generate revenue. However, as a newcomer to the industry, they lack experience and understanding of the factors that contribute to a movie's success. Box office revenue, critical acclaim, and audience reception are key performance metrics, with movie genres playing a significant role in determining success. This project aims to analyze the performance of different movie genres, identify trends and patterns, and provide actionable insights for Microsoft's new movie studio to inform their decisions when creating new films. By understanding the context and factors influencing the movie industry, the project can help Microsoft create successful movies and achieve their goals. Now you will put your new skills to use with a large end-of-Phase project!
For this project, you will use exploratory data analysis to generate insights for a business stakeholder.
Microsoft sees all the big companies creating original video content and they want to get in on the fun. They have decided to create a new movie studio, but they don’t know anything about creating movies. You are charged with exploring what types of films are currently doing the best at the box office. You must then translate those findings into actionable insights that the head of Microsoft's new movie studio can use to help decide what type of films to create.
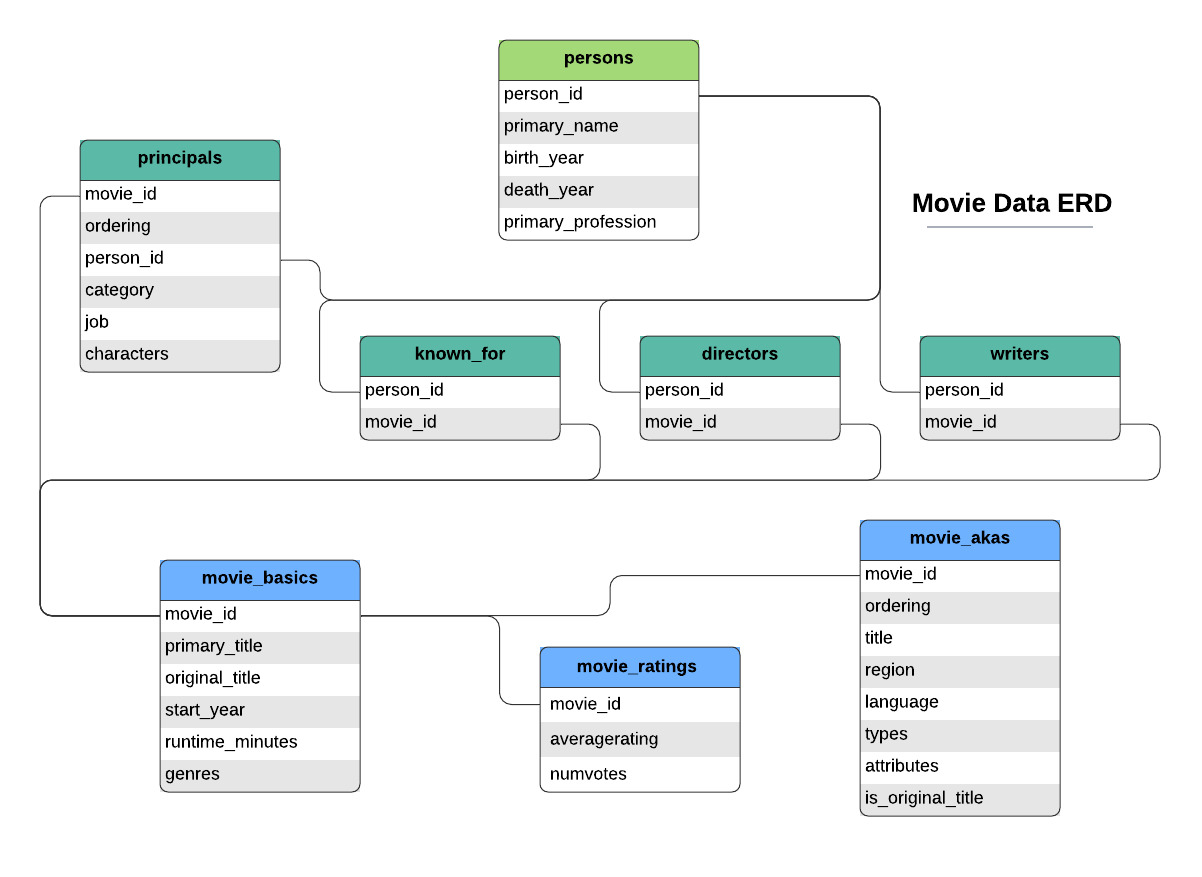
In the folder zippedData are movie datasets from:
Because it was collected from various locations, the different files have different formats. Some are compressed CSV (comma-separated values) or TSV (tab-separated values) files that can be opened using spreadsheet software or pd.read_csv, while the data from IMDB is located in a SQLite database.
This project uses descriptive analysis,correlation matrix to check for relationship between the variables. This provides a useful overview of insights and outcomes to identify resource needs.
The chart indicates that the genre with the most movies currently in production is Drama, followed by Comedy, Action, Horror, Thriller, Adventure, Science Fiction, Romance, Animation, and Crime. This information can be useful for understanding the current trends in movie production and the types of movies that are likely to be released in the near future. It can also provide insights into which genres are more popular among movie producers and investors.
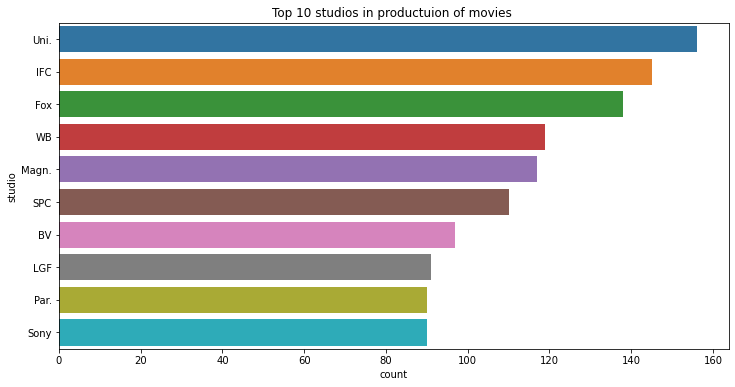
The chart indicates that the studio with the most movies currently in production is Universal Pictures, followed by Warner Bros., Walt Disney Pictures, Columbia Pictures, 20th Century Fox, Paramount Pictures, New Line Cinema, Miramax Films, Touchstone Pictures, and DreamWorks SKG. This information can be useful for understanding the current trends in movie production and the types of movies that are likely to be released in the near future. It can also provide insights into which studios are more active in movie production and which may have more influence in the movie industry.
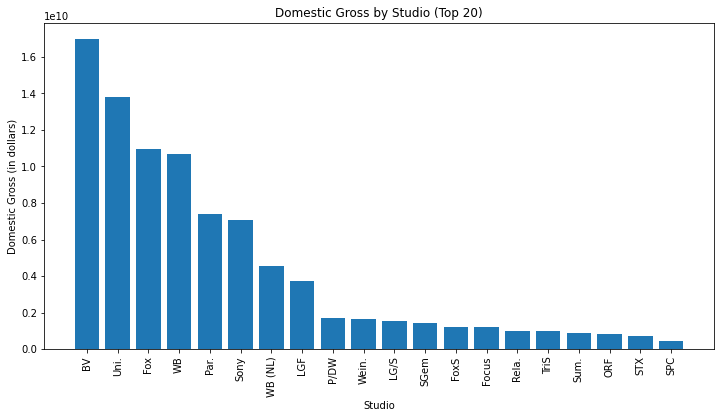
The chart indicates that the studio with the highest domestic gross revenue is BV, followed by Universal Pictures, Fox,Warner Bros,Paramount Pictures, Sony,Columbia Pictures, DreamWorks SKG, Miramax Films, and Lionsgate. This information can be useful for understanding the financial performance of different movie studios and their relative success in the movie industry. It can also provide insights into which studios may have more financial resources and which may be more profitable to work with as a filmmaker or investor.
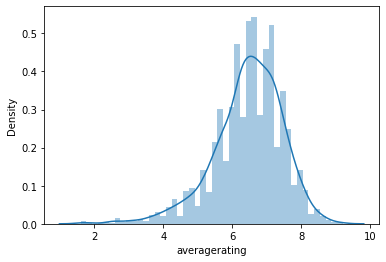
The chart indicates that the most common rating value in the dataset is between 6 and 7, followed by 5 and 8. This information can be useful for understanding the overall quality of movies in the dataset and the types of ratings that are most common among movies. It can also provide insights into the preferences of movie audiences and the factors that contribute to a movie's success or failure.
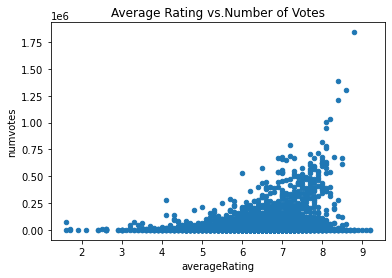
The chart indicates that there is a weak positive correlation between the two variables, with higher-rated movies generally having more votes. However, there are also many movies with a high number of votes but a lower rating, indicating that the popularity of a movie is not always directly related to its quality or critical reception. This information can be useful for understanding the relationship between movie ratings and popularity and for identifying which movies may be more likely to succeed in terms of audience engagement and overall reception.
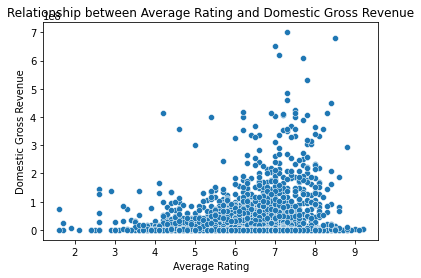
The chart indicates that there is a weak positive correlation between the two variables, with higher-rated movies generally having higher domestic gross revenue. However, there are also many movies with a high domestic gross revenue but a lower rating, indicating that financial success is not always directly related to critical reception or quality. This information can be useful for understanding the relationship between movie ratings and financial performance and for identifying which movies may be more likely to succeed in terms of box office revenue and overall reception.
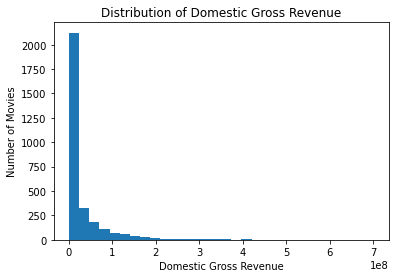
We can see that the majority of movies have a domestic gross revenue of less than $50 million, with a long tail of higher grossing movies. The domestic gross also tends to increase. However, it is also evident that there are many movies with low budgets that have performed well in terms of domestic gross.
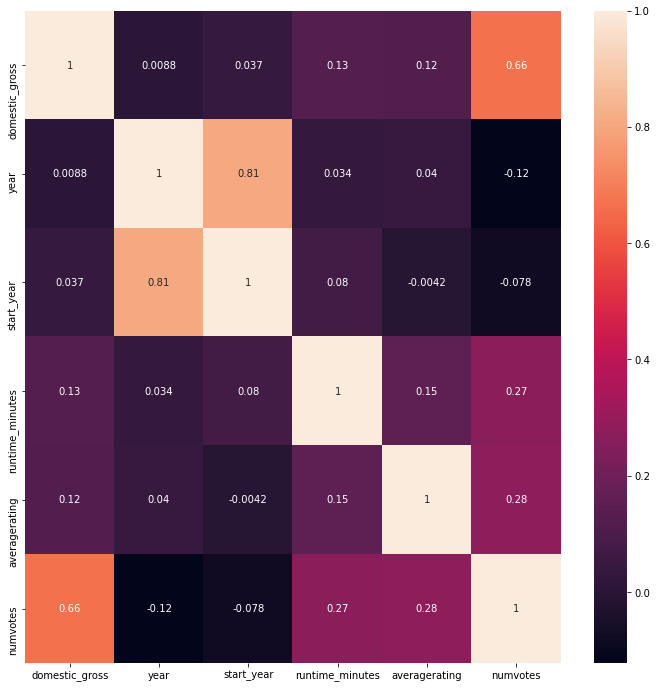
The darker the shade of blue, the stronger the positive correlation between the two variables, while the darker the shade of red, the stronger the negative correlation between the two variables. A value of 1 indicates a perfect positive correlation, a value of -1 indicates a perfect negative correlation, and a value of 0 indicates no correlation between the two variables.
Based on the correlation matrix, we can make the following observations:
- Domestic gross has a strong positive correlation with the number of votes (0.664), indicating that movies with more votes tend to have higher domestic gross.
-
Domestic gross also has a moderate positive correlation with average rating (0.119) and runtime minutes (0.126), indicating that movies with higher ratings and longer runtime tend to have higher domestic gross.
-
Year has a weak positive correlation with start year (0.808) and a weak negative correlation with number of votes (-0.122), indicating that older movies tend to have fewer votes than newer movies.
-
Average rating has a moderate positive correlation with the number of votes (0.278), indicating that movies with higher ratings tend to have more votes.
-
Runtime minutes has a moderate positive correlation with the number of votes (0.266), indicating that movies with longer runtime tend to have more votes.
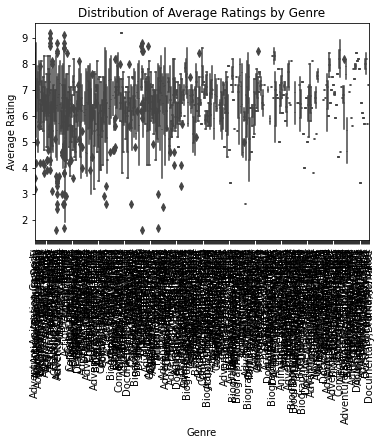
Based on the chart, it seems like documentaries, music, and biography films have the highest average ratings among all genres, while horror and action films have the lowest. This could suggest that audiences are generally more critical of horror and action films, while they are more appreciative of documentaries, music, and biography films. However, it is important to note that this is just an average and there are many individual films within each genre that may not fit this trend. However, there is a lot of variability in the data, so again it is difficult to draw strong conclusions from this plot.
Based on the analysis:
-
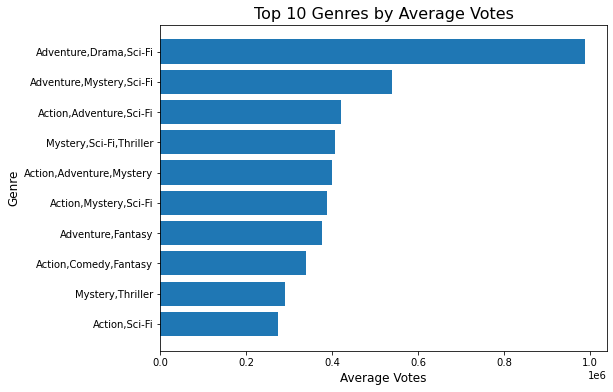
It is recommended that movie producers focus on producing movies in the Drama, Adventure and Sci-Fi genres.
-
Work with successful studios such as BV, Universal, Fox and Warner Bros(WB), and aim for a runtime of around 120 minutes.
-
Consider increasing promotion and advertising efforts for movies with high vote counts to increase the popularity of the movie among audiences.
-
Aim to produce movies with an average rating between 6-7, which appears to be the most common rating value in the dataset.
Overall, it is important to consider the genre, ratings, and studio when planning a movie production or distribution strategy. However, it is important to note that success is not guaranteed and there are other factors that can influence a movie's success, such as marketing, timing of release, and competition in the market.
-
The movie industry is constantly evolving, and Microsoft's new movie studio should remain flexible and adaptable to changing conditions and consumer preferences to stay competitive in the market. Further research and analysis could include exploring the impact of social media and influencer marketing on movie success and analyzing the impact of streaming services on the box office.
-
Conduct further analysis on the top-performing genres and studios: Explore the top-performing genres and studios in more detail to gain a deeper understanding of their success factors and identify any common trends or characteristics that contribute to their success.
-
Analyze the impact of release dates and marketing strategies: Consider exploring the impact of release dates and marketing strategies on movie success to help identify optimal timing and promotional efforts for new movie releases.
-
Develop predictive models: Use machine learning algorithms to build predictive models that can forecast the potential success of a movie based on various factors such as genre, studio, rating, and release date.
-
Collaborate with industry experts: Work with industry experts such as producers, directors, or marketing professionals to gain additional insights and perspectives on the movie industry and potential strategies for success.
See the full analysis in the [Jupyter Notebook](./movie_data analysis-checkpoint.ipynb) or review this [presentation](./presentation content/slide presentation.pdf).
 - project
    |── .ipynb_checkpoints
    |── data
    |   ├── movie_data analysis-checkpoint.ipynb
    |── images
    |── presentation content
    |── .canvas
    |── .gitignore
    |── CONTRIBUTING.md
    |── LICENSE.md
    ├── README.md
    └── movie_data analysis-checkpoint.ipynb