- Create a LabKey Assay Project/Folder
- Hover over the Project or Folder menu, and click Create Project or Create Subfolder.
- Provide a Name and select type Assay.
- Click Next.
- Set permissions (optional) and click Next.
- Click Finish.
- Create a Signal Data Assay Design
- In the Assay List web part, click New Assay Design.
- On the New Assay Design page, select Signal Data as the assay type.
- Click Next.
- Name is the only required field. (Design default values should work fine.)
- Click the Save & Close button.
Importing data is a two step process:
- Upload the metadata file. (An example metadata file is available at: https://github.com/LabKey/signalData/blob/develop/test/sampledata/signaldata/RunsMetadata/datafiles.tsv)
- Drag and drop the data files (Example data files are available at: https://github.com/LabKey/signalData/tree/develop/test/sampledata/signaldata/SignalDataAssayData/TestRun001)
- Go to the folder where you wish to upload results.
- Add the Signal Data Upload webpart.
- Confirm that File is selected, and click Upload TXT, TSV, XLS, XLSX.

- Specify a Run Identifier (required).

- Drag-and-drop any result files you want to import onto the dropzone.

- Click the Save Run button.

To view chromatograms for the results, follow these instructions:
- Go to the folder where your results reside.
- On the Assay List webpart, click the name of the Signal Data assay you created.
- Select the run(s) you want to look at, using the checkboxes.
- Click View Selected Runs.

- Select the data run(s) you wish to view from the left.
- Click the
Overlay Selectedbutton.
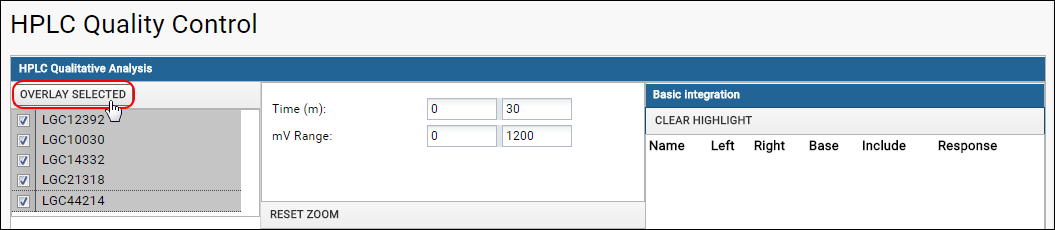
- The left selection pane will close, and the overlayed results will be displayed in the center pane.

- You can zoom into the graph by entering values in the Time and mV Range text boxes, or by drawing a new area inside the graph using the mouse.

Enter values in the right pane to calculate areas under the curves. Select in the name column to highlight different graph lines.

Contact us for details on installing the Signal Data module.