I find Grafana very useful to visualize metrics stored in InfluxDB or Elasticsearch. I recently found a library called Kamon that lets you track some metrics of the machine where you're executing your applications and lets you create your own metrics. I hope this testdrive gives you good ideas for your applications too.
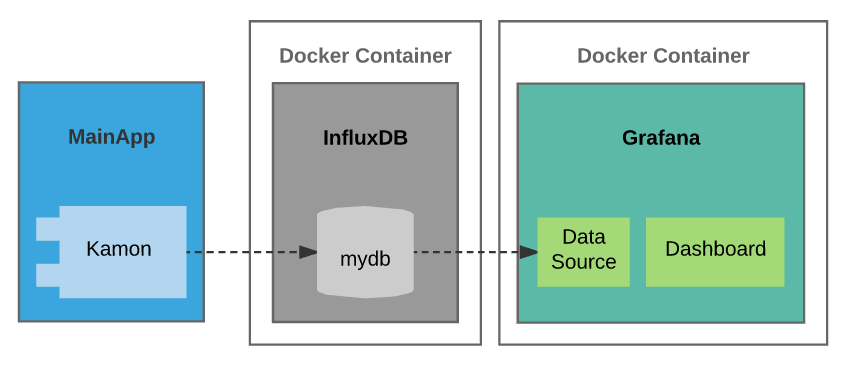
In this Scala project I'm using a library named Kamon to get system metrics. These metrics are sent and stored in InfluxDB and visualized using Grafana.
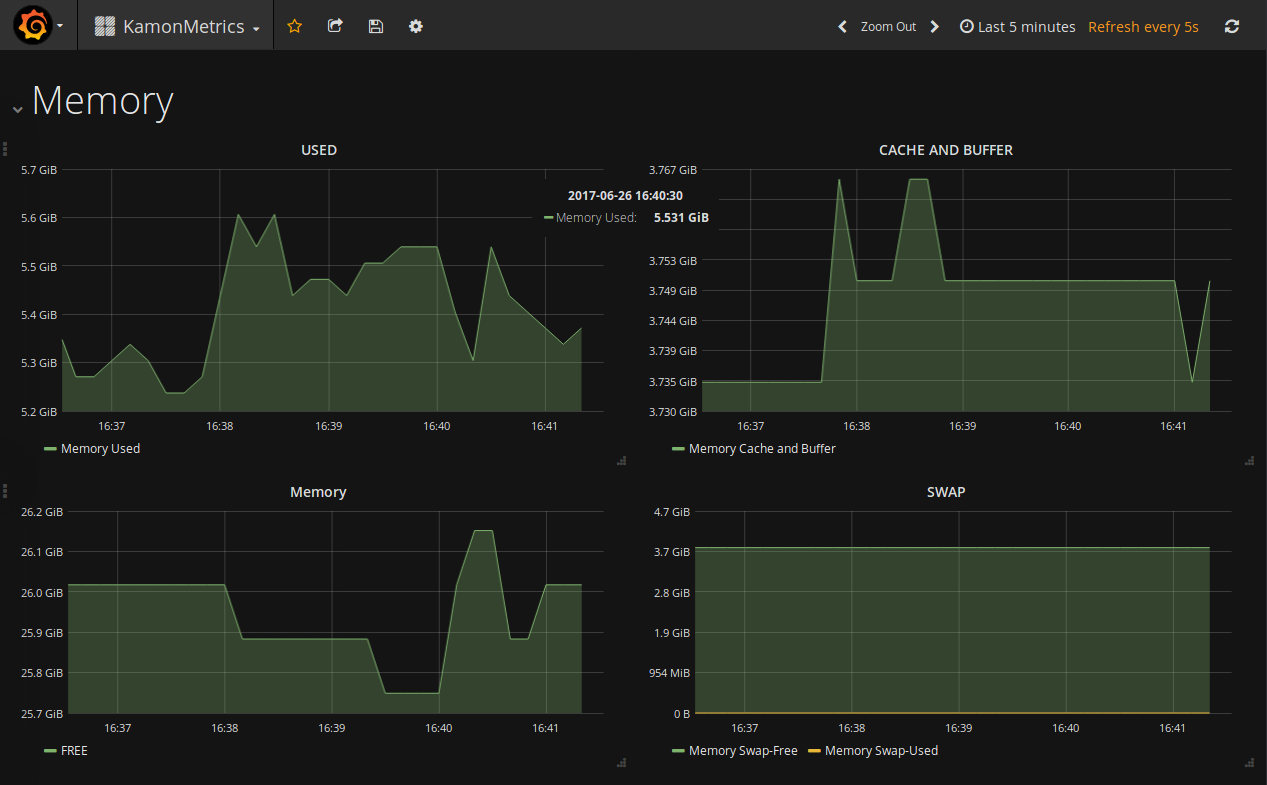
InfluxDB and Grafana are run in a Docker container while the main application runs in local mode (using IntelliJ). The final dashboard looks like this:
In this project you will find the following artifacts in the project/resources folder:
- docker-compose.yml
- KamonMetrics-Dashboard.json
- .png Images
-
Create a folder named
monitor-devand put the filedocker-compose.ymlin it -
Open the console there and start the docker containers with the command
docker-compose up -
(You can stop the containers with
docker-compose stop)
- Access to the InfluxDB container and create a database named
mydb. To do so, you must:
// Get access to the container
docker exec -it monitordev_influxdb_1 /bin/bash

// Get access the InfluxDB's console with
influx

// Create the database
create database mydb

// Exit InfluxDB and container
exit
CTRL + P
CTRL + Q
If your getting an error with the docker exec.. command you can check the Container_ID assigned for the influxDb container with the command: docker ps and use that Container_ID instead of monitordev_influxdb_1
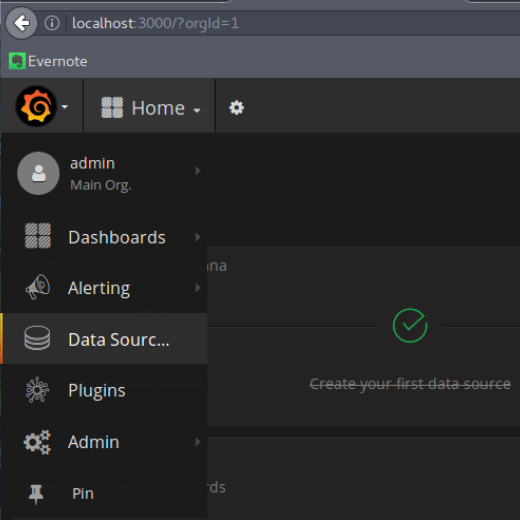
- Login to Grafana's UI
http://localhost:3000/login
user: admin
password: admin
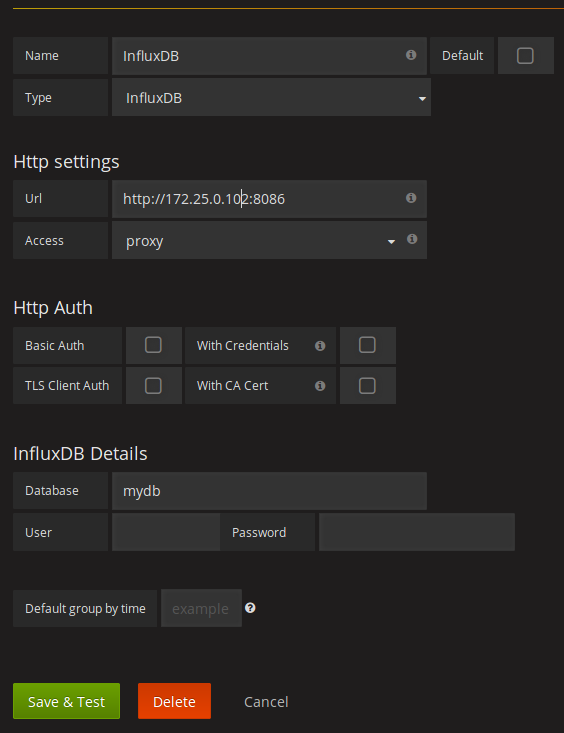
- Create a new Datasource
- Connect it to the InfluxDB container using port 8086
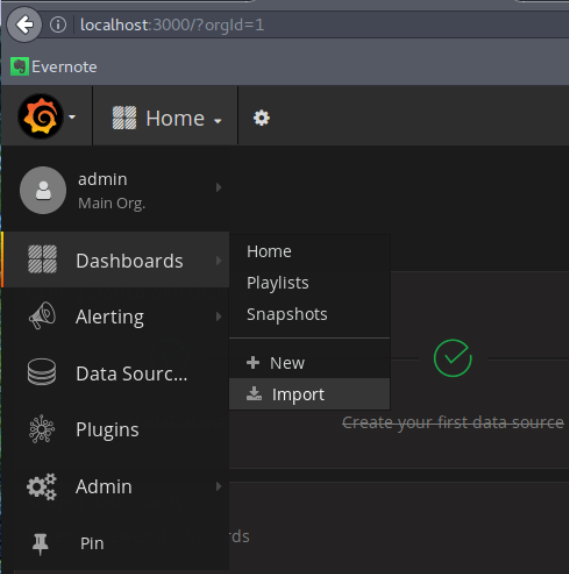
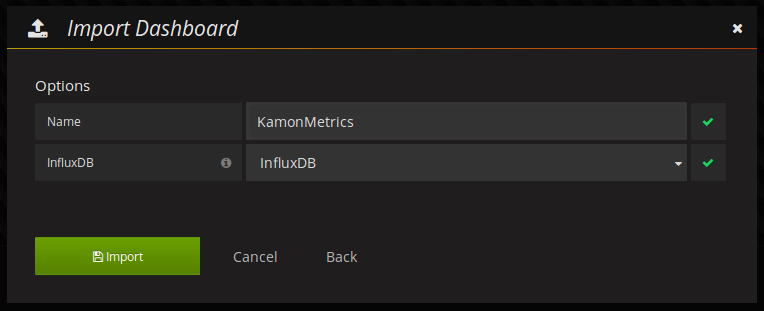
- Go to Dashboards-import and load the file
KamonMetrics-Dashboard.json
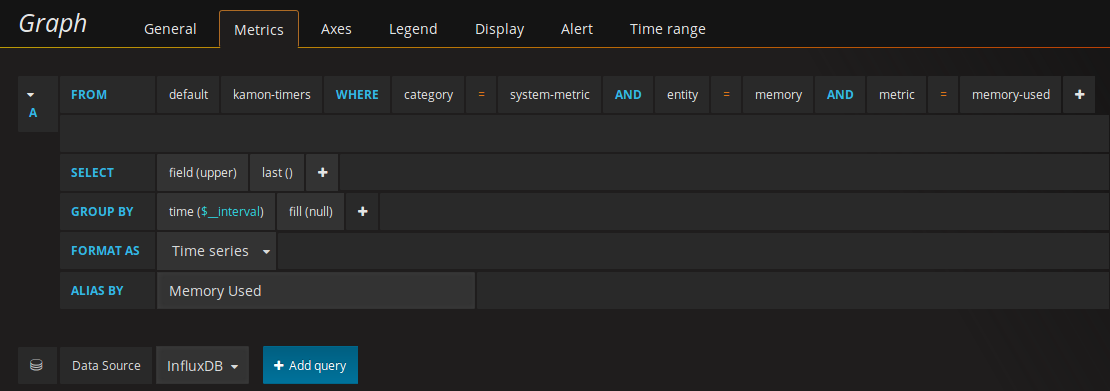
Now you can explore the Histograms I've created and you can create yours based on all the metrics sent by Kamon.
I'm using IntelliJ to do so. After it starts running you can also see the metrics printed in the console.
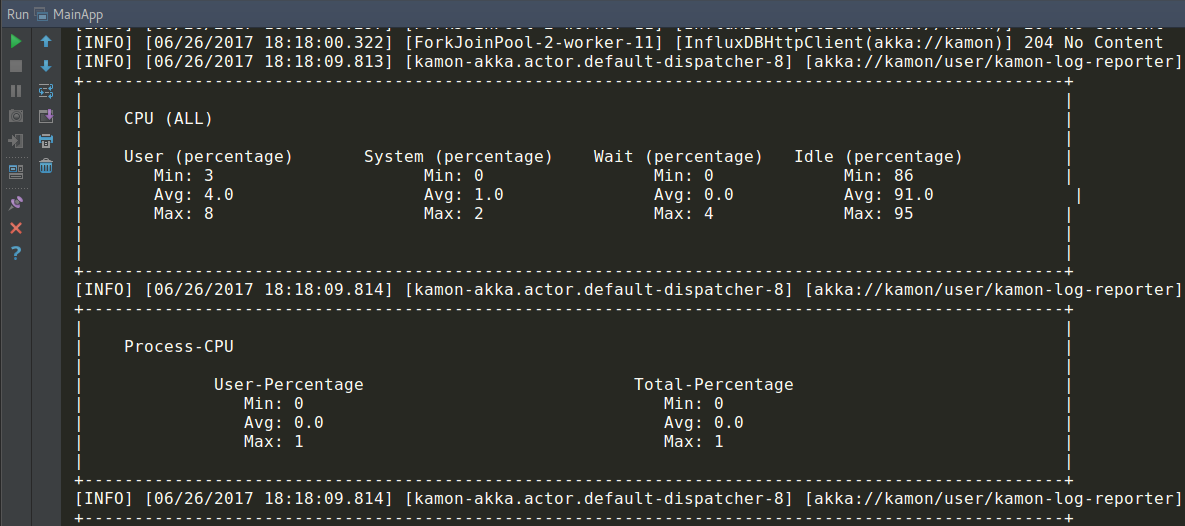
It's built in Scala 2.11.8. Basically it runs until you press ENTER in the console and while active it sends system metrics to InfluxDB to a data base called "mydb"
object MainApp {
  def main(args: Array[String]) {
    Kamon.start()
    StdIn.readLine()
    Kamon.shutdown()
  }
}It's properties are configured in the file application.conf
kamon {
  log-reporter {
    requires-aspectj = no
    auto-start = yes
  }

  system-metrics {
    requires-aspectj = no
    auto-start = yes
  }

  influxdb {
    hostname = "localhost"
    port = "8086"
    authentication.user = "admin"
    authentication.password = "admin"
    database = "mydb"

    max-packet-size = 1024
    application-name = "kamon"
  }
}
I'm using docker-compose to start Grafana and InfluxDB's containers. Here's the content of the file docker-compose.yml.
version: '2'

services:

  grafana:
    image: grafana/grafana
    ports:
      - 3000:3000
    networks:
      mynet:
        ipv4_address: 172.25.0.101

  influxdb:
    image: influxdb
    ports:
      - 8086:8086
    networks:
      mynet:
        ipv4_address: 172.25.0.102

networks:
  mynet:
    driver: bridge
    ipam:
      config:
      - subnet: 172.25.0.0/24
-
Kamon System Metrics Module: http://kamon.io/documentation/kamon-system-metrics/0.6.6/overview/
-
Grafana additional plugins: https://grafana.com/plugins
Thank you