A collection of notebooks demonstrating plotting with matplotlib.
The greatest part of matplotlib and seaborn are their galleries:
If you take nothing else from this session, please know that there are amazing examples that you can copy and paste and run for yourself.
These give you a great jumping off point for learning how to visualize your data.
Visualisation tools change quite regularly, so the first step is to install an anaconda environment with the correct packages.
Don't forget to type y when conda asks you if you want to install some packages 😺
conda create -n nh19-visualization python=3.7 nb_conda_kernels jupyter
Activate that environment and then install all the packages listed in the requirements.txt file in this repository.
If you don't run this command from inside of the repository then change requirements.txt to include the path (relative or absolute) to the file.
conda activate nh19-visualization
pip install -r requirements.txt
Finally, make sure you can see this environment in jupyter lab.
python -m ipykernel install --user --name nh19-visualization
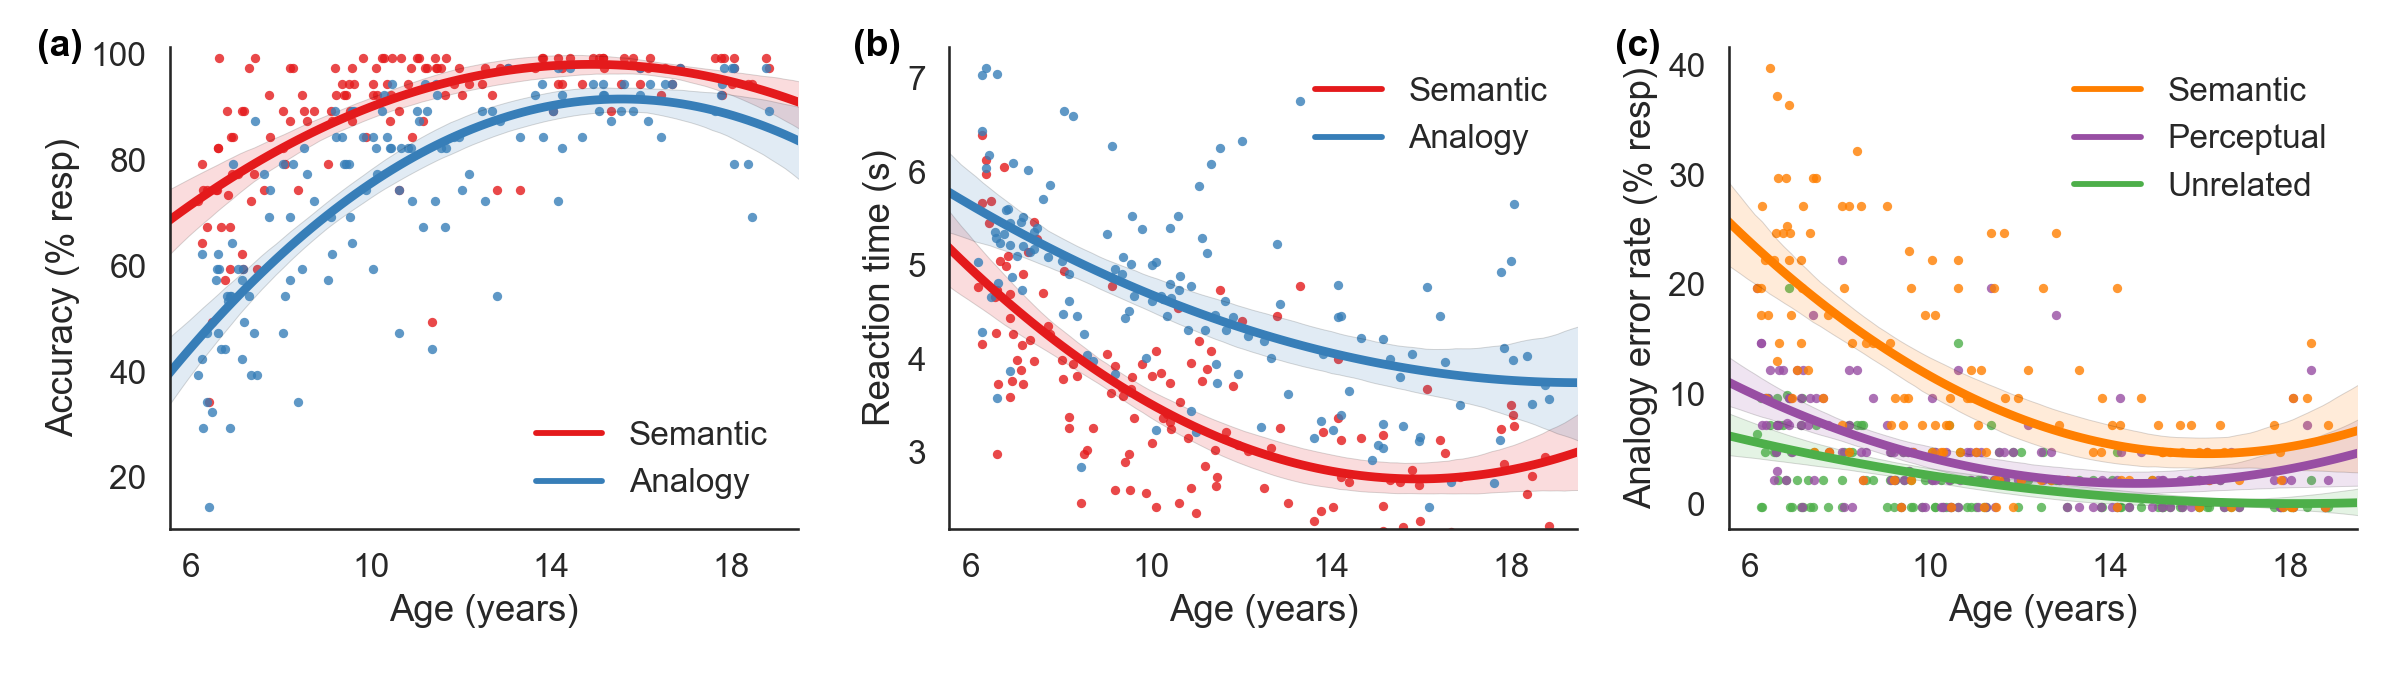
In 2017 Michael Vendetti and I published a paper on "Neuroscientific insights into the development of analogical reasoning". The code to recreate the figures from processed data is available at https://github.com/KirstieJane/NORA_WhitakerVendetti_DevSci2017.
The DataViz_Scatter jupyter notebook is a step by step tutorial to plot figure 2 (shown below) from the paper.
- Tal's Visualization in Python tutorial from last year: https://github.com/neurohackademy/visualization-in-python/blob/master/visualization-in-python.ipynb
- Raincloudplots: https://github.com/RainCloudPlots/RainCloudPlots
- The citation advantage of linking publications to research data: https://github.com/alan-turing-institute/das-public