Trace Swift and Objective-C method invocations of non-final classes in an app bundle or framework. Think Xtrace but for Swift and Objective-C. You can also add "aspects" to member functions of non-final Swift classes to have a closure called before or after a function implementation executes which in turn can modify incoming arguments or the return value! Apart from the loggin functionality, with binary distribution of Swift frameworks on the horizon perhaps this will be of use in the same way "Swizzling" was in days of yore.
Note: none of these features will work on a class or method that is final or internal in a module compiled with whole module optimisation as the dispatch of the method will be "direct" i.e. linked to a symbol at the call site rather than going through the class' vtable.
SwiftTrace is most easily used as a CocoaPod and can be added to your project by temporarily adding the following line to it's Podfile:
pod 'SwiftTrace'This project has been updated to Swift 5 from Xcode 10.2.:
pod 'SwiftTrace', '5.5.0'Once the project has rebuilt, import SwiftTrace into the application's AppDelegate and add something like the following to the beginning of it's didFinishLaunchingWithOptions method:
SwiftTrace.traceBundle(containing: type(of: self))This traces all classes defined in the main application bundle. To trace, for example, all classes in the RxSwift Pod add the following
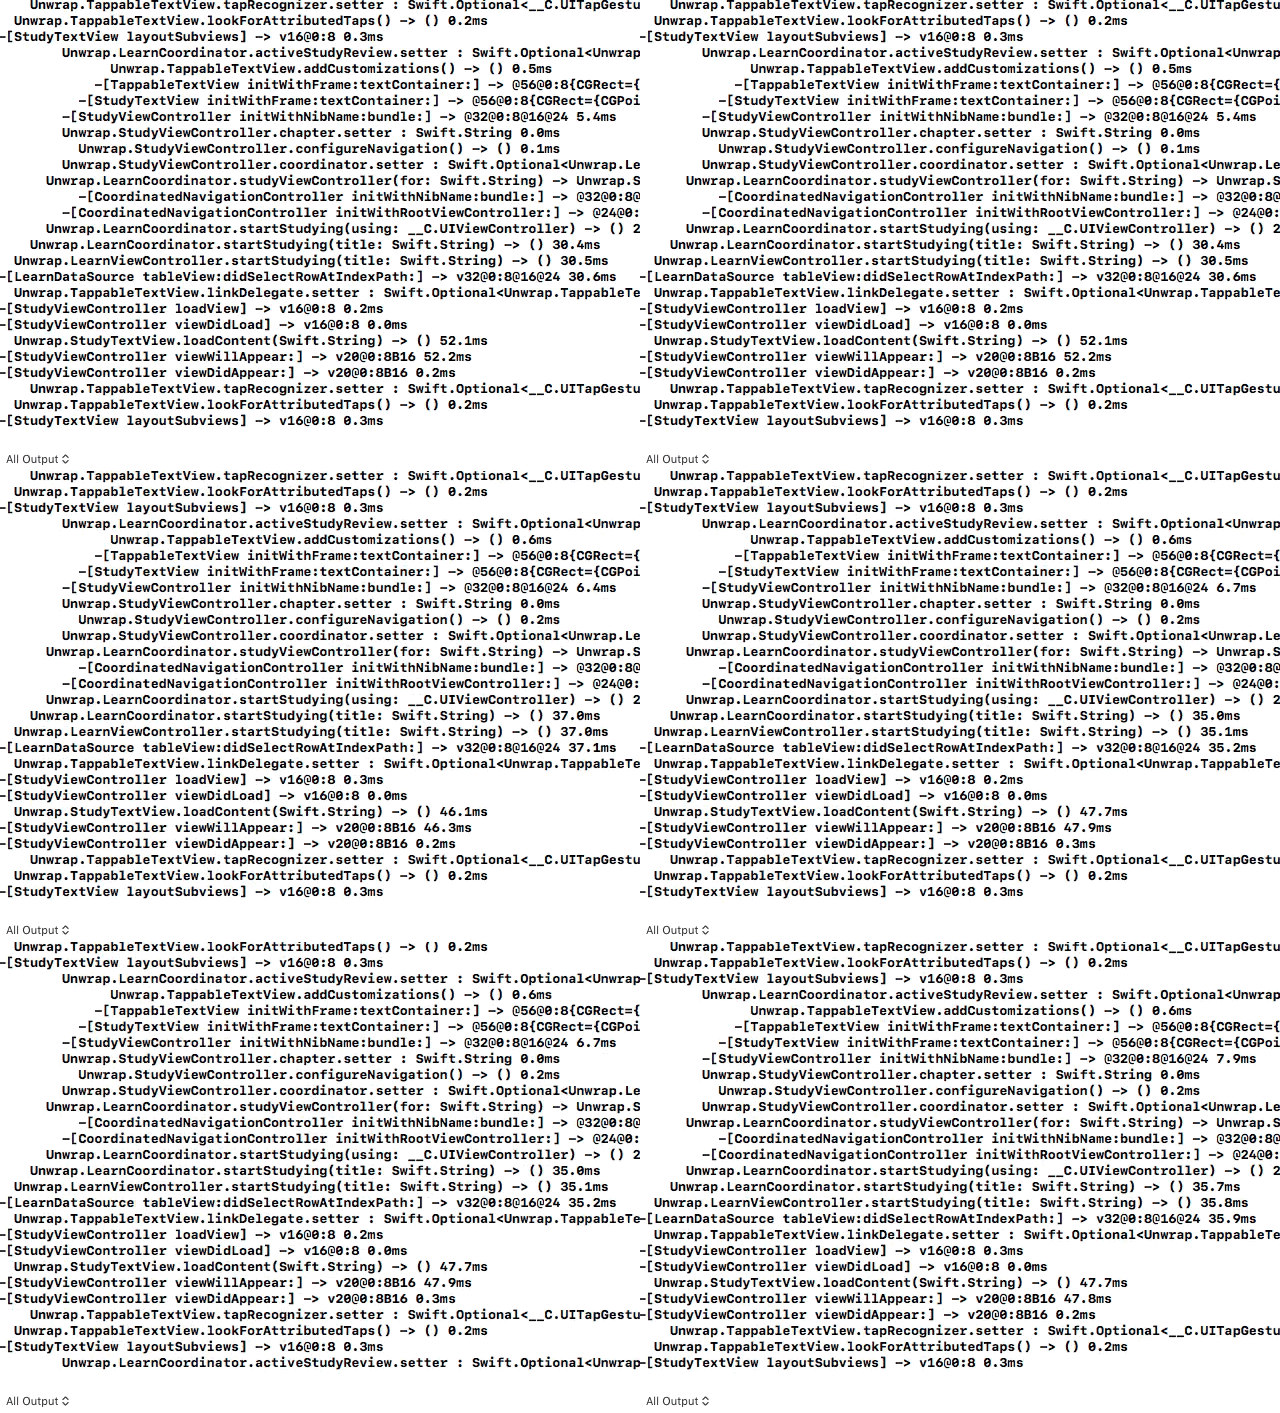
SwiftTrace.traceBundle(containing: RxSwift.DisposeBase.self)This gives output in the Xcode debug console such as that above.
To trace a system framework such as UIKit you can trace classes using a pattern:
SwiftTrace.traceClassesMatching(pattern:"^UI")Individual classes can be traced using the underlying api:
SwiftTrace.trace(aClass: MyClass.self)Output can be filtered using method name inclusion and exclusion regexps.
    SwiftTrace.include(pattern: "TestClass")
    SwiftTrace.exclude(pattern: "\\.getter")
These methods must be called before you start the trace as they are applied during the "Swizzle" phase. There is a default set of exclusions setup as a result of testing, tracing UIKit.
public let swiftTraceDefaultExclusions = "\\.getter|retain]|_tryRetain]|_isDeallocating]|^\\+\\[(Reader_Base64|UI(NibStringIDTable|NibDecoder|CollectionViewData|WebTouchEventsGestureRecognizer)) |^.\\[UIView |UIButton _defaultBackgroundImageForType:andState:|RxSwift.ScheduledDisposable.dispose"
If you want to further process output you can define a custom tracing class:
    class MyTracer: SwiftTrace.Patch {

        override func onEntry(stack: inout SwiftTrace.EntryStack) {
            print( ">> "+stack )
        }
    }

SwiftTrace.patchFactory = MyTracer.selfYou can add an aspect to a particular method using the method's de-mangled name:
    print(SwiftTrace.addAspect(aClass: TestClass.self,
                      methodName: "SwiftTwaceApp.TestClass.x() -> ()",
                      onEntry: { (_, _) in print("ONE") },
                      onExit: { (_, _) in print("TWO") }))
This will print "ONE" when method "x" of TextClass is called and "TWO when it has exited. The two arguments are the patch which is an object representing the "Swizzle" and the entry or exit stack. The full signature for the entry closure is:
onEntry: { (patch: SwiftTrace.Patch, stack: inout SwiftTrace.EntryStack) inIf you understand how registers are allocated to arguments it is possible to poke into the stack to modify the incoming arguments and, for the exit aspect closure you can replace the return value and on a good day prevent (and log) an error being thrown.
Replacing an input argument in the closure is relatively simple:
    stack.intArg1 = 99
    stack.floatArg3 = 77.3
Other types of argument a little more involved. They must be cast and String takes up two integer registers.
    patch.rebind(&stack.intArg2).pointee = "Grief"
    patch.rebind(&stack.intArg4).pointee = TestClass()
In an exit aspect closure, setting the return type is easier as it is generic:
stack.setReturn(value: "Phew")When a function throws you can access NSError objects.
print(patch.rebind(&stack.thrownError, to: NSError.self).pointee)It is possible to set stack.thrownError to zero to cancel the throw but you will need to set
the return value.
Now we have a trampoline infrastructure, it is possible to implement an invocation api for Swift:
    print("Result: "+SwiftTrace.invoke(target: b,
        methodName: "SwiftTwaceApp.TestClass.zzz(_: Swift.Int, f: Swift.Double, g: Swift.Float, h: Swift.String, f1: Swift.Double, g1: Swift.Float, h1: Swift.Double, f2: Swift.Double, g2: Swift.Float, h2: Swift.Double, e: Swift.Int, ff: Swift.Int, o: SwiftTwaceApp.TestClass) throws -> Swift.String",
        args: 777, 101.0, Float(102.0), "2-2", 103.0, Float(104.0), 105.0, 106.0, Float(107.0), 108.0, 888, 999, TestClass()))
In order to determine the mangled name of a method you can get the list for a class using this function:
print(SwiftTrace.methodNames(ofClass: TestClass.self))There are limitations to this abbreviated interface in that it only supports Double, Float,
String, Int, Object and CGRect arguments. For other struct types that do not contain
floating point values you can conform them to protocol SwiftTraceArg to be able to
pass them on the argument list. These values and return values must fit into 32 bytes
and not contain floats.
A Swift AnyClass instance has a layout similar to an Objective-C class with some
additional data documented in the ClassMetadataSwift in SwiftTrace.swift. After this data
there is a vtable of pointers to the class and instance member functions of the class up to
the size of the class instance. SwiftTrace replaces these function pointers with a pointer
to a unique assembly language "trampoline" entry point which has destination function and
data pointers associated with it. Registers are saved and this function is called passing
the data pointer to log the method name. The method name is determined by de-mangling the
symbol name associated the function address of the implementing method. The registers are
then restored and control is passed to the original function implementing the method.
Please file an issue if you encounter a project that doesn't work while tracing. It should be 100% reliable as it uses assembly language trampolines rather than Swizzling like Xtrace. Otherwise, the author can be contacted on Twitter @Injection4Xcode. Thanks to Oliver Letterer for imp_implementationForwardingToSelector used to set up the trampolines. Thanks also to @twostraws' Unwrap and @artsy's eidolon used extensively during testing.
Enjoy!
