Data Source: Kaggle 2016 US Presidential Election dataset
- primary_results_candidates_correlation.py explores the correlations between candidates based on votes fractions they have in the same counties.
The results are saved in CandidateCorrelation folder
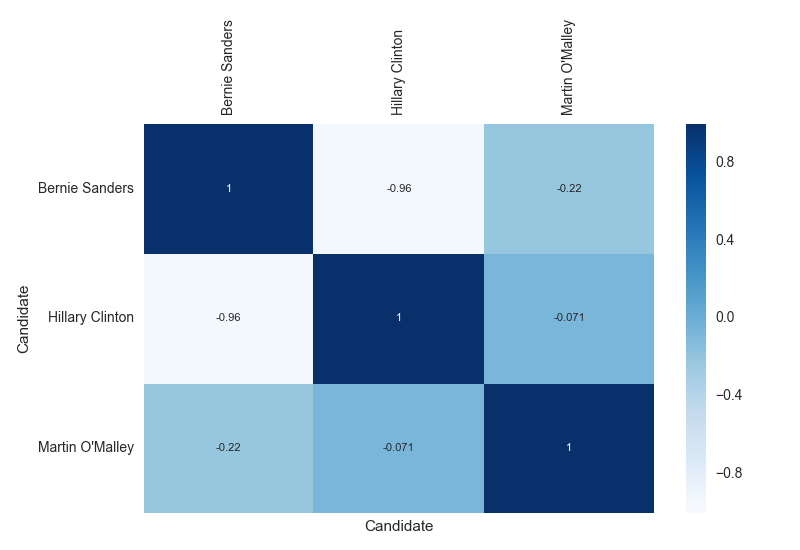
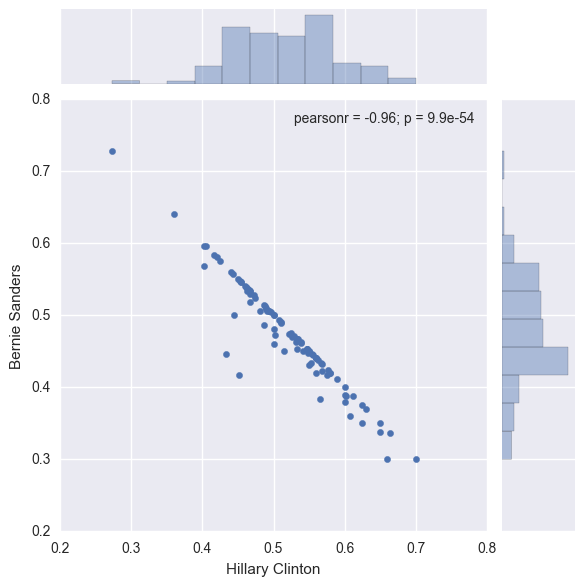
- Most two anti-correlated Democrat party candidates are Hillary Clinton and Bernie Sanders. The script calculates Pearson correlation coeficient, PValue and StdErr
Here is the joinplot of these two candidates:
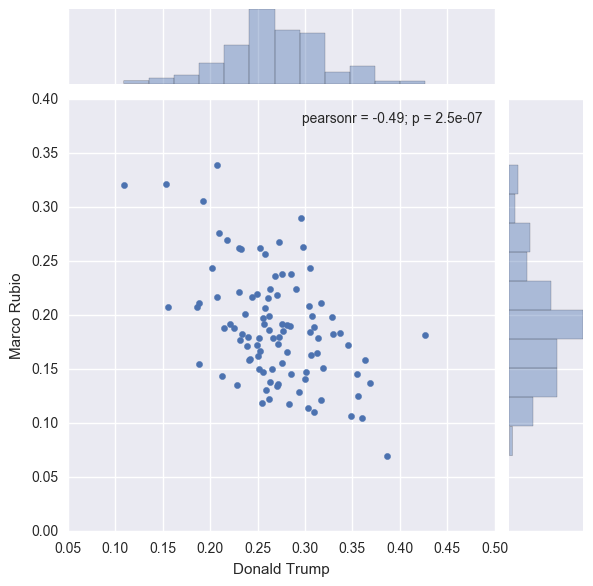
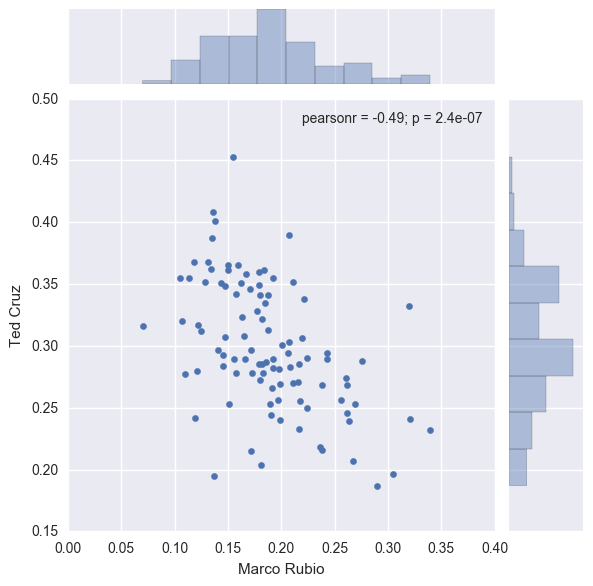
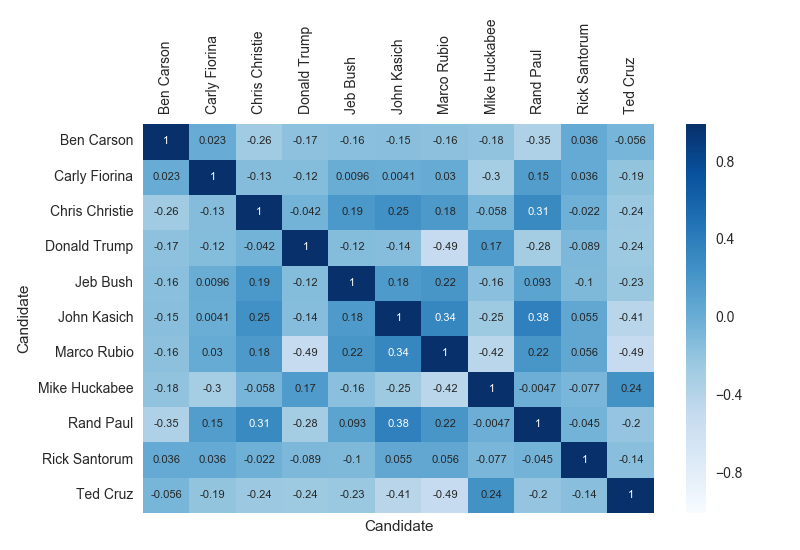
- The more interesting question is anti-correlated Repupublican candidates. According to my analysis they are:
- Donald Trump and Marco Rubio
- Marco Rubio and Ted Cruz
Both pairs have -0.49 Rvalue. The next pair is Marco Rubio and Mike Huckabee with -0.42 Rvalue The data has strong negative correlation, and it's significant as p-value is a lot lesser than 0.001
Here are the joinplots of two first pairs:
- Primary results assume a choice between Democrats candidates only or Republican candidates only
So comparing Democrats to Republicans based on these results does not have a lot of sense
However let's look on the picture as a whole
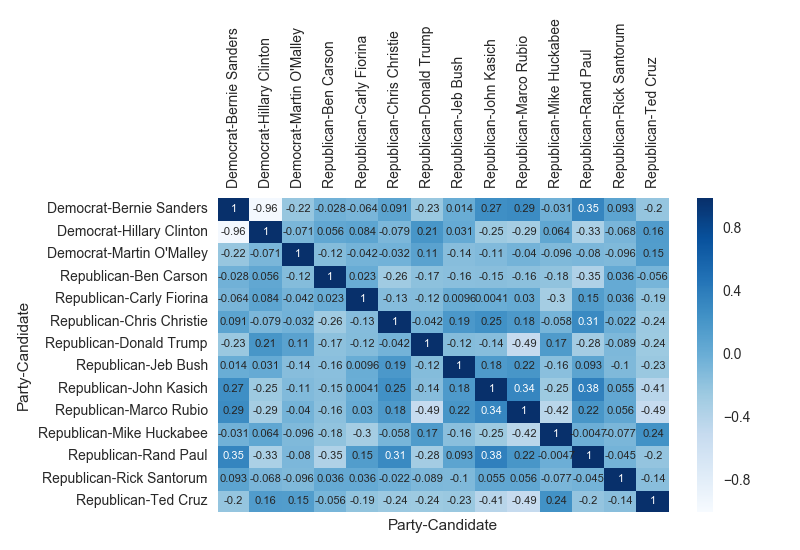
or in this view
Let's look now how high is the PValue for correlations between democrat and republican candidates We can not trust such results
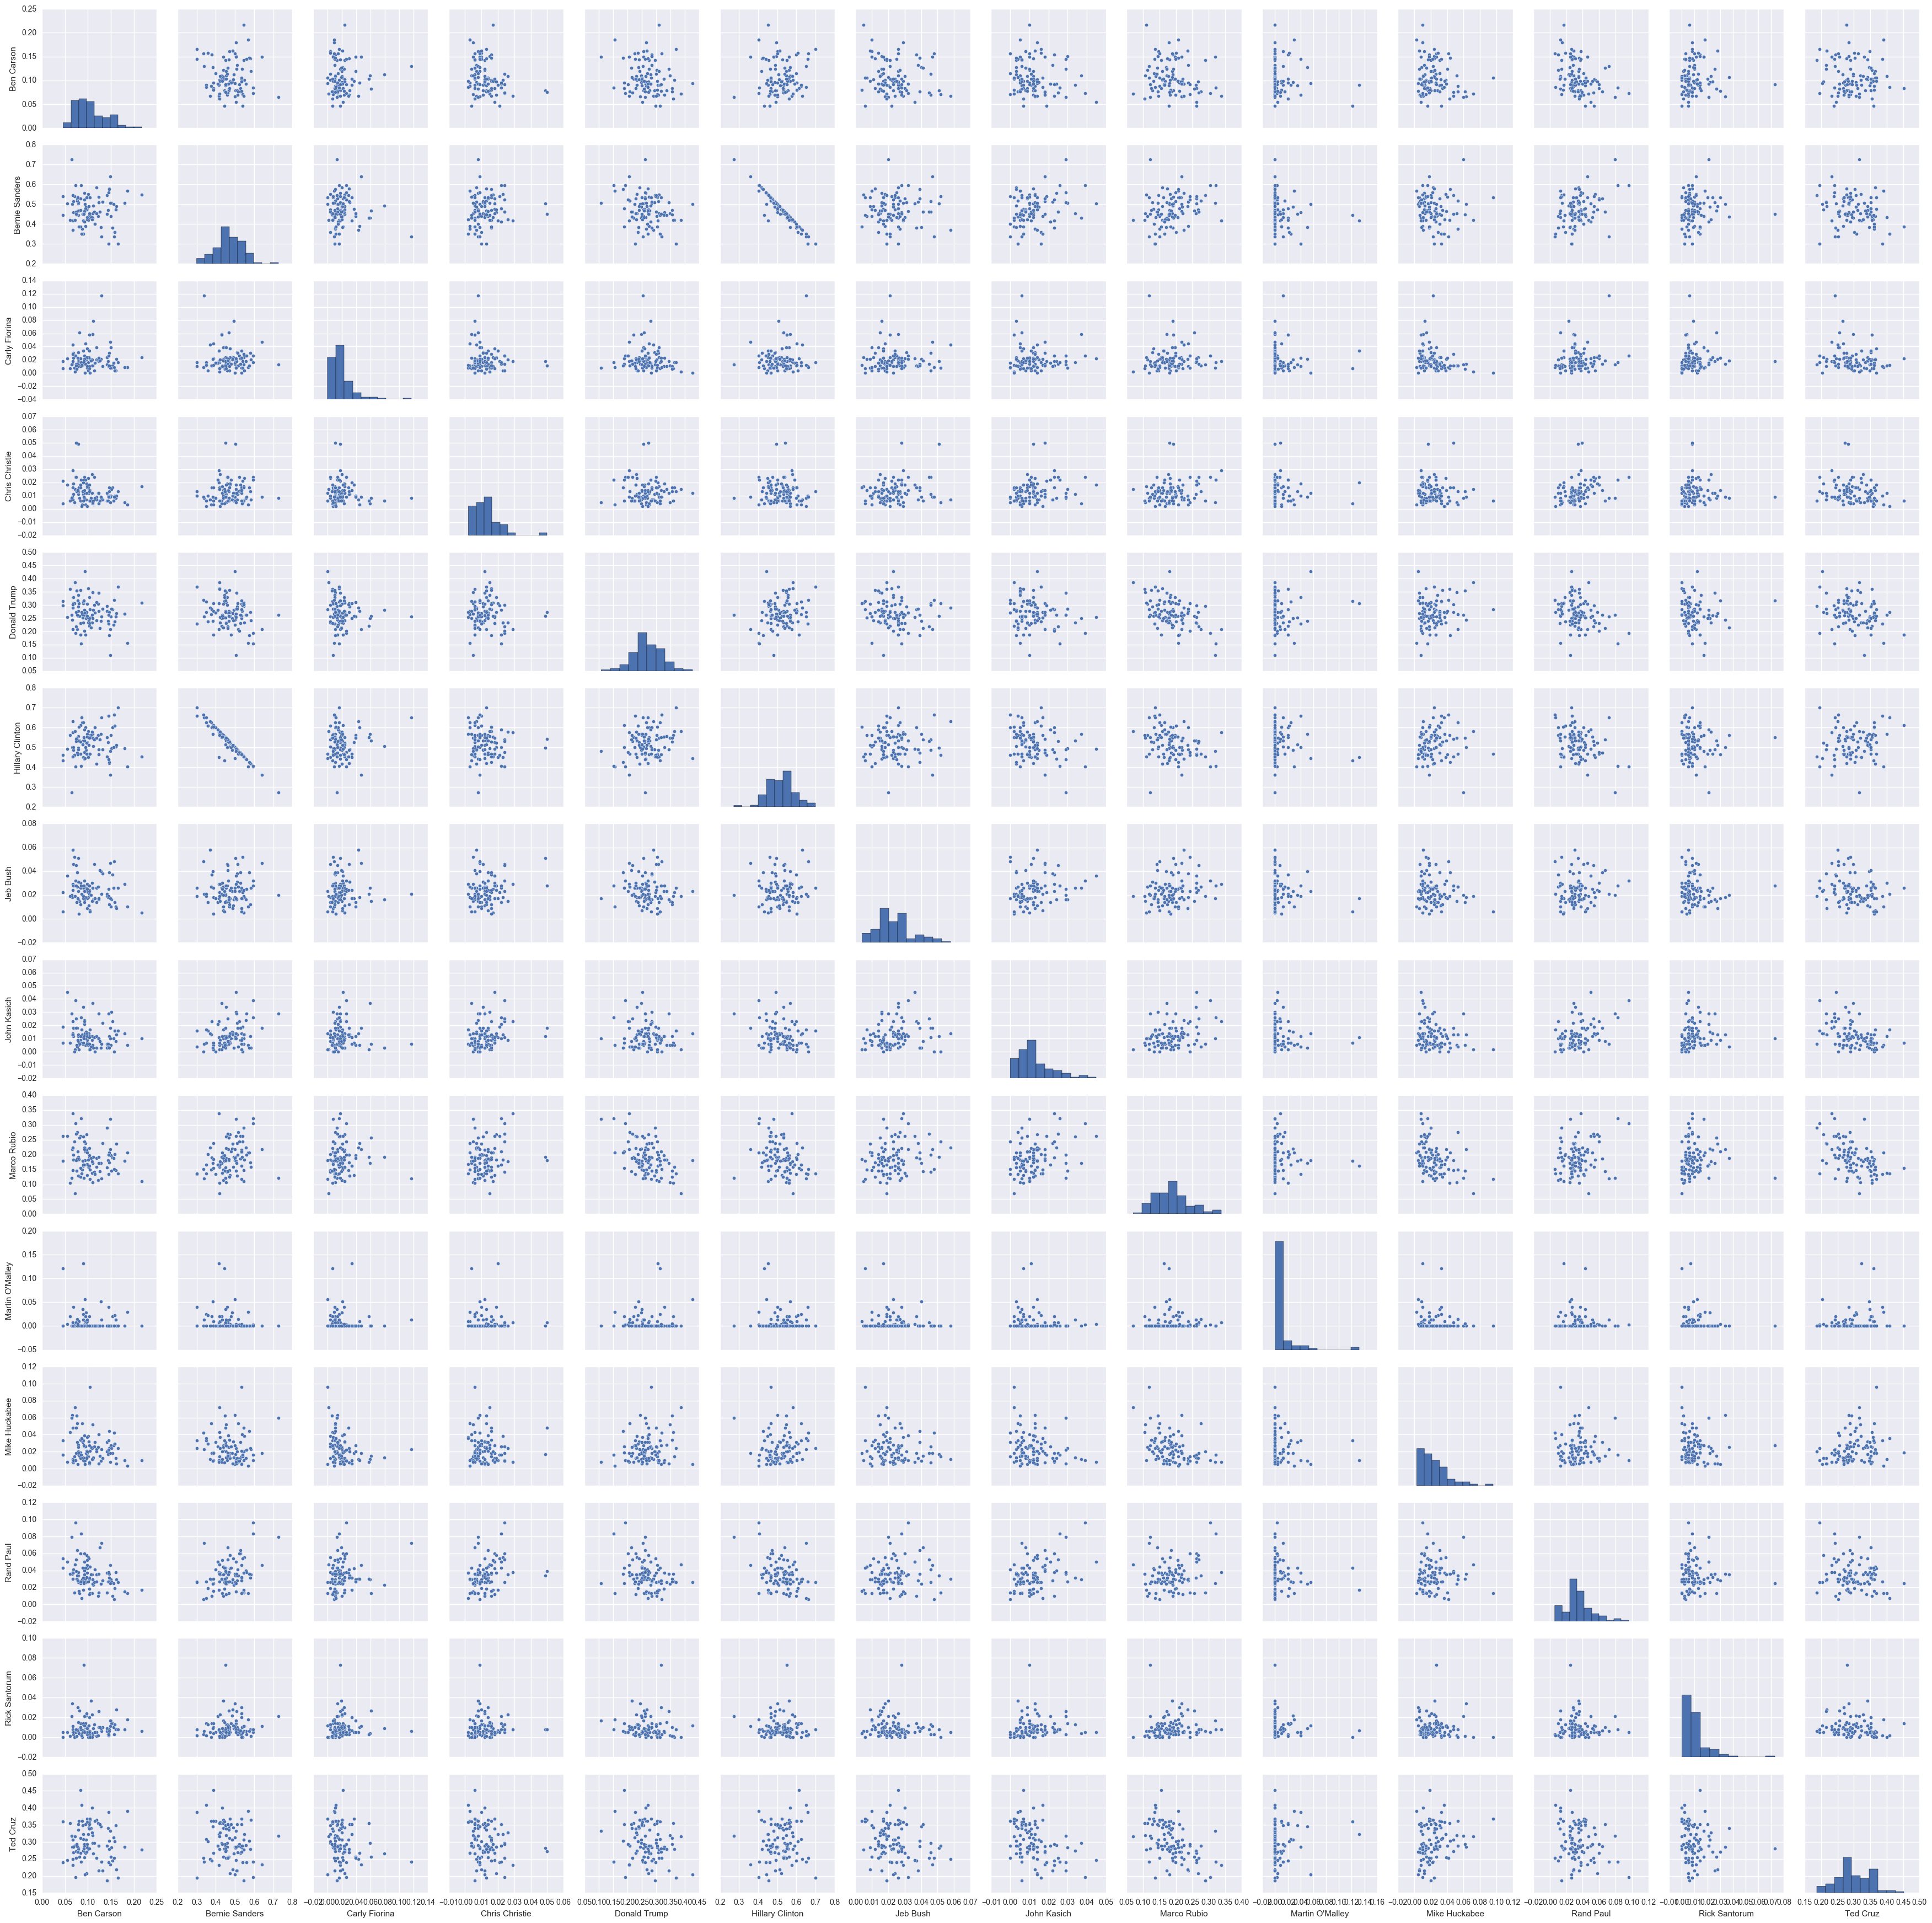
- And at the end the pairplot for the data set:
- Most two anti-correlated Democrat party candidates are Hillary Clinton and Bernie Sanders. The script calculates Pearson correlation coeficient, PValue and StdErr
- county_facts_candidates_correlation.py explores the correlations between candidates and county facts based on votes fractions they have in each county.
The results are saved in FactCandidateCorrelation folder
- There is a strong correlation between percent of Asian and Bernie Sanders votes fraction. In the opposite, Hillary Clinton has anti-correlation with Asian percent and stong positive correlation with White percent.
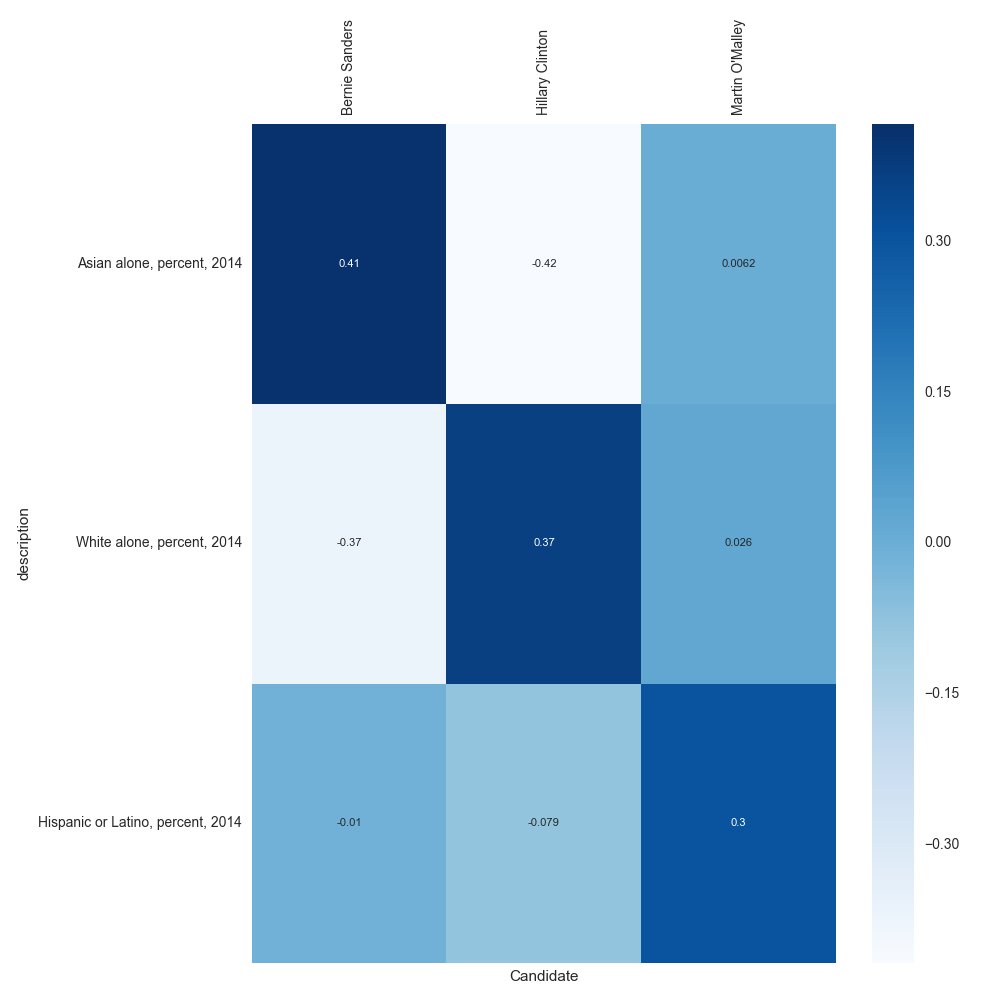
The PValue is small enough to trust the results
- Here is the similar analysis for republicans. the results are more sparse but what we can see the strong positive relationship
between percent of Housing units in multi-unit structures and votes fractions of John Kasich, Marco Rubio and Rand Paul.
There is also the strong correlation between percent of Bachelor's degree or higher and the same republican candidates
The PValue is very low and we can trust the results.
Interesting, Donald Trump has the strong anti-correlated results with the percent of Bachelor's degree or higher Fact with a low PValue
He has a moderate positive correlation with the percent of Persons 65 years and over. However the PValue is high in this case
Marco Rubio fraction votes is strongly anti-correlated with the percent of Persons 65 years and over fact and PValue is very low.
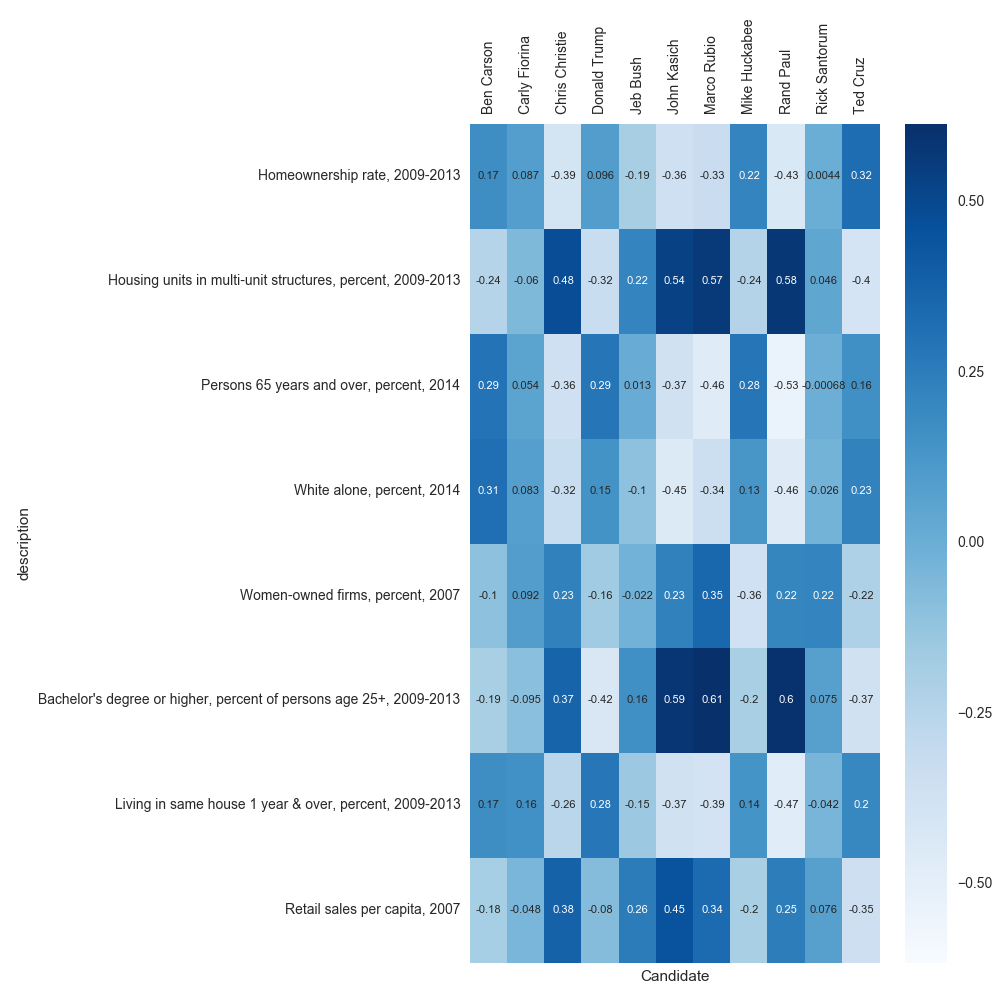
- Here is the full picture: RValue and Pvalue The fact dictionary is here.
- There is a strong correlation between percent of Asian and Bernie Sanders votes fraction. In the opposite, Hillary Clinton has anti-correlation with Asian percent and stong positive correlation with White percent.
- LinearRegression.py predicts primary results fraction votes based on demographic county facts.
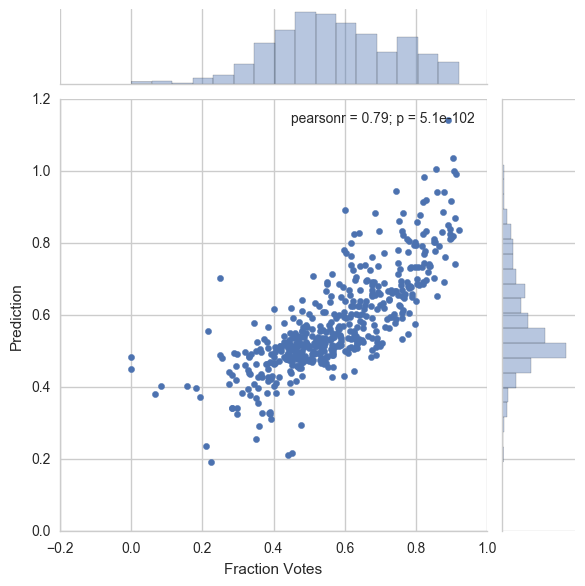
Hillary Clinton and Bernie Sanders fraction votes are most correlated to the county facts.
The variance is above 0.6 for these 2 candidates. The quality of the predicted values for the rest of the candidates
is low with 0.4 and less varience values.
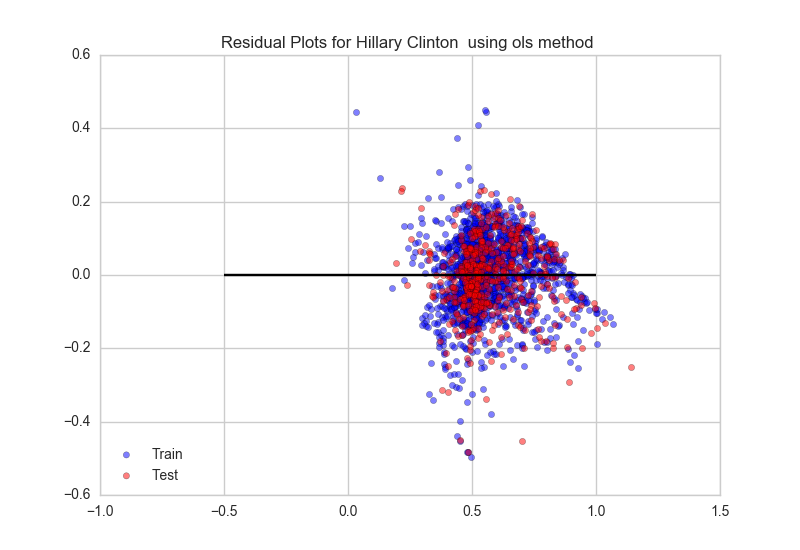
Ordinary least squares method works perfectly fine fo the data. The rest of the method can give a slightly better results but not very significant
Hillary Clinton fraction votes prediction residual plot for ordinary least squares method, not normalize data
Hillary Clinton prediction joint plot for ordinary least squares method, not normalize data
The files with the predicted data and plots for each candidates can be found in LinearRegressionPredictionPrimary folder
Other candidates prediction data models fit for different methods and parameters. More data can be found here
candidate method normalize MSE Train set MSE Test set Variance Hillary Clinton LeastSquares Y 0.011 0.011 0.614 Hillary Clinton LeastSquares N 0.011 0.011 0.614 Hillary Clinton Ridge 0.010 Y 0.011 0.011 0.616 Hillary Clinton Ridge 0.010 N 0.011 0.011 0.614 Hillary Clinton Lasso 0.000 Y 0.012 0.011 0.627 Hillary Clinton Lasso 0.000 N 0.011 0.011 0.618 Hillary Clinton BayesianRidge Y 0.011 0.011 0.620 Hillary Clinton BayesianRidge N 0.011 0.011 0.610 Bernie Sanders LeastSquares Y 0.010 0.010 0.642 Bernie Sanders LeastSquares N 0.010 0.010 0.642 Bernie Sanders Ridge 0.010 Y 0.010 0.010 0.643 Bernie Sanders Ridge 0.010 N 0.010 0.010 0.642 Bernie Sanders Lasso 0.000 Y 0.011 0.010 0.649 Bernie Sanders Lasso 0.000 N 0.010 0.010 0.646 Bernie Sanders BayesianRidge Y 0.010 0.010 0.643 Bernie Sanders BayesianRidge N 0.010 0.010 0.640 Donald Trump LeastSquares Y 0.005 0.006 0.401 Donald Trump LeastSquares N 0.005 0.006 0.401 Donald Trump Ridge 0.010 Y 0.005 0.006 0.426 Donald Trump Ridge 0.010 N 0.005 0.006 0.402 Donald Trump Lasso 0.000 Y 0.005 0.006 0.417 Donald Trump Lasso 0.000 N 0.005 0.006 0.407 Donald Trump BayesianRidge Y 0.005 0.006 0.428 Donald Trump BayesianRidge N 0.005 0.006 0.411 Marco Rubio LeastSquares Y 0.004 0.004 0.228 Marco Rubio LeastSquares N 0.004 0.004 0.228 Marco Rubio Ridge 0.010 Y 0.004 0.004 0.242 Marco Rubio Ridge 0.010 N 0.004 0.004 0.228 Marco Rubio Lasso 0.000 Y 0.004 0.005 0.226 Marco Rubio Lasso 0.000 N 0.004 0.004 0.242 Marco Rubio BayesianRidge Y 0.004 0.004 0.253 Marco Rubio BayesianRidge N 0.004 0.004 0.243 Ted Cruz LeastSquares Y 0.009 0.008 0.326 Ted Cruz LeastSquares N 0.009 0.008 0.326 Ted Cruz Ridge 0.010 Y 0.009 0.008 0.348 Ted Cruz Ridge 0.010 N 0.009 0.008 0.326 Ted Cruz Lasso 0.000 Y 0.009 0.008 0.374 Ted Cruz Lasso 0.000 N 0.009 0.008 0.322 Ted Cruz BayesianRidge Y 0.009 0.008 0.362 Ted Cruz BayesianRidge N 0.009 0.008 0.318 - The rest of scripts were used to generate data for Tableau