cnmaps依赖于cartopy>=0.19.0,因此在安装cnmaps之前请确保cartopy已安装,cartopy的安装方法。
在完成cartopy的安装以后,你可以使用pip来安装cnmaps:$ pip install -U cnmaps
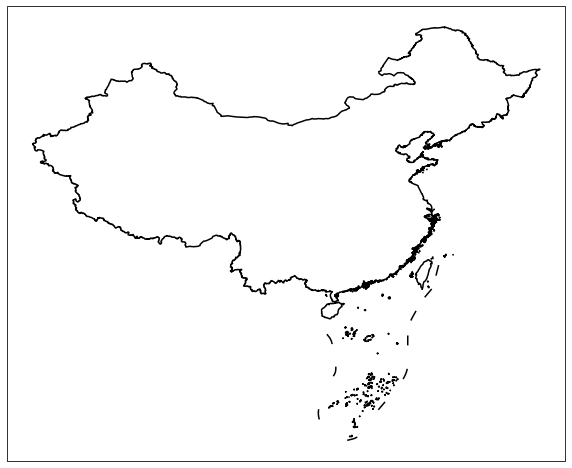
用最简单直接的方式,来绘制你的第一张**地图。
import cartopy.crs as ccrs
import matplotlib.pyplot as plt
from cnmaps import get_adm_maps, draw_maps

fig = plt.figure(figsize=(10,10))
ax = fig.add_subplot(111, projection=ccrs.PlateCarree())

draw_maps(get_adm_maps(level='国'))
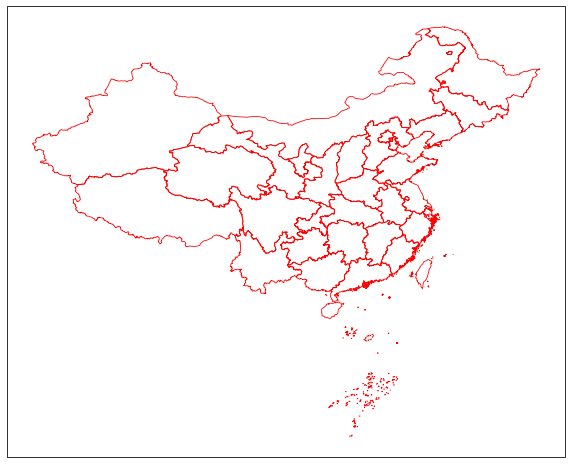
plt.show()cnmaps还可以绘制各省(特区/直辖市)的地图
import cartopy.crs as ccrs
import matplotlib.pyplot as plt
from cnmaps import get_adm_maps, draw_maps

fig = plt.figure(figsize=(10,10))
ax = fig.add_subplot(111, projection=ccrs.PlateCarree())

draw_maps(get_adm_maps(level='省'), linewidth=0.8, color='r')

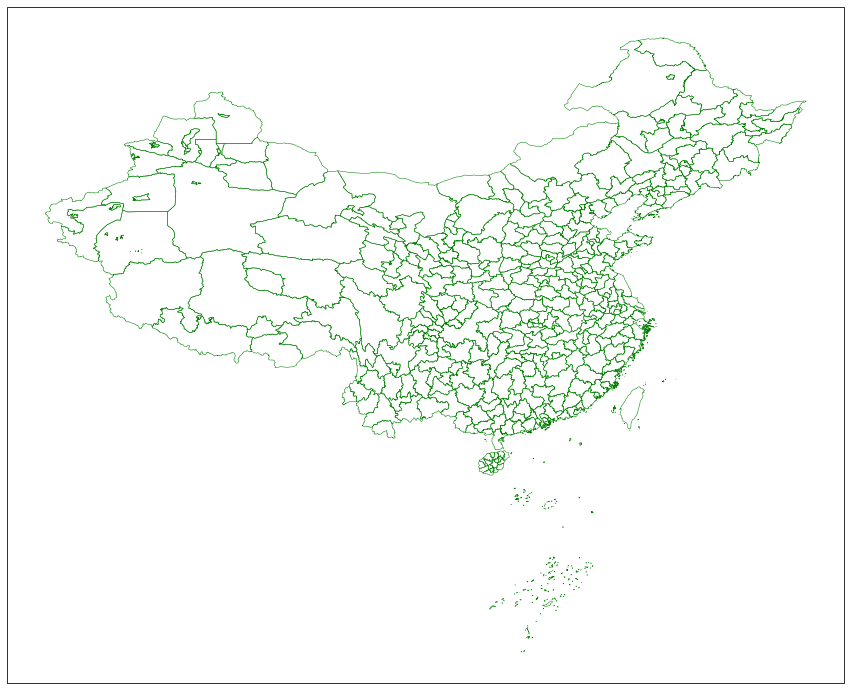
plt.show()cnmaps可以绘制市级的行政区地图。
import cartopy.crs as ccrs
import matplotlib.pyplot as plt
from cnmaps import get_adm_maps, draw_maps

fig = plt.figure(figsize=(15,15))
ax = fig.add_subplot(111, projection=ccrs.PlateCarree())

draw_maps(get_adm_maps(level='市'), linewidth=0.5, color='g')

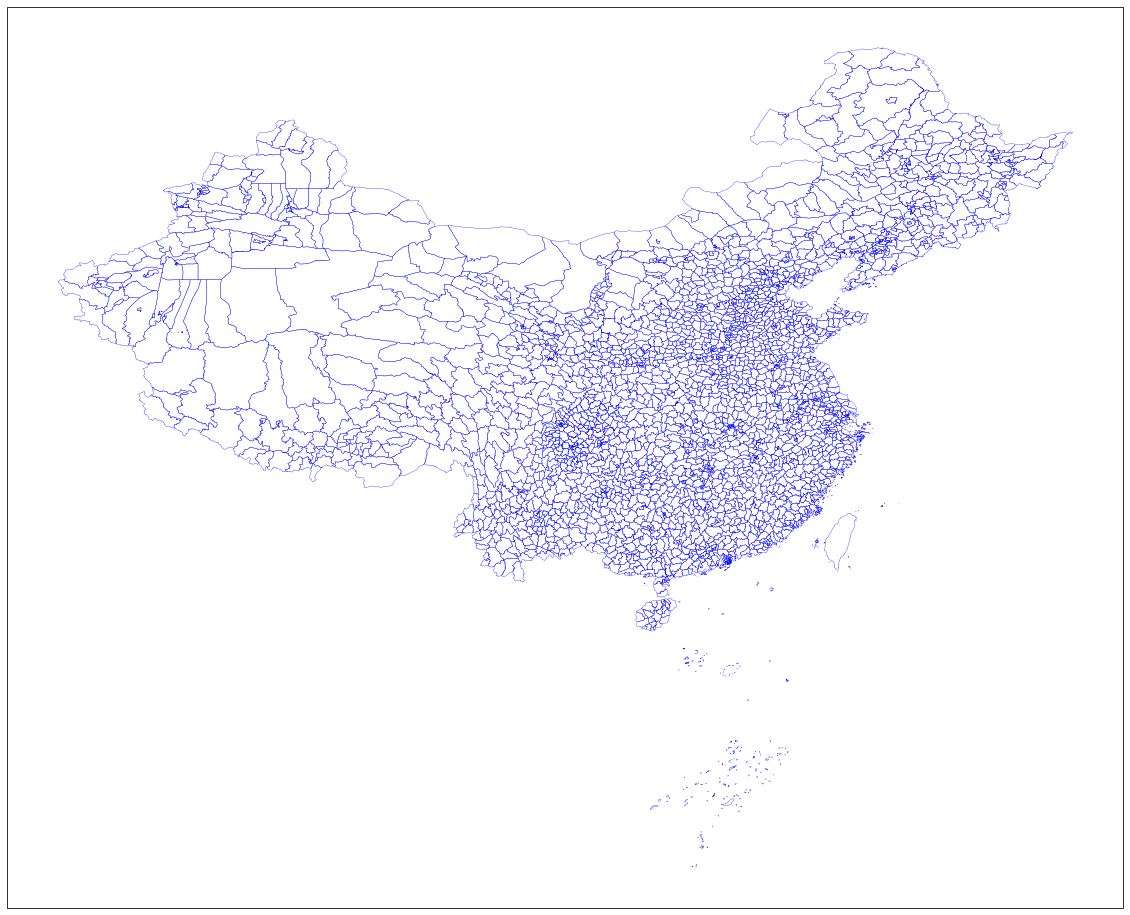
plt.show()cnmaps可以绘制区县级的行政区地图。
import cartopy.crs as ccrs
import matplotlib.pyplot as plt
from cnmaps import get_adm_maps, draw_maps

fig = plt.figure(figsize=(20,20))
ax = fig.add_subplot(111, projection=ccrs.PlateCarree())

draw_maps(get_adm_maps(level='区县'), linewidth=0.8, color='r')

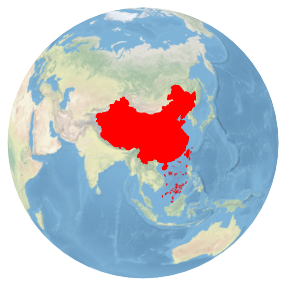
plt.show()本项目的Logo地图是如何绘制的?请执行下面的代码。
import cartopy.crs as ccrs
import matplotlib.pyplot as plt
from cnmaps import get_adm_maps

fig = plt.figure(figsize=(5,5))
proj = ccrs.Orthographic(central_longitude=100.0, central_latitude=30)
ax = fig.add_subplot(111, projection=proj)

ax.stock_img()
china, sourth_sea = get_adm_maps(level='国', only_polygon=True)

ax.set_global()
ax.add_geometries(china, crs=ccrs.PlateCarree(), edgecolor='r', facecolor='r')
ax.add_geometries(sourth_sea, crs=ccrs.PlateCarree(), edgecolor='r')
ax.outline_patch.set_edgecolor('white')

plt.savefig('../static/images/logo-base.png', bbox_inches='tight')针对本项目更多的使用方法,我们还有一份更详细的文档:cnmaps使用指南
本项目适用的地图边界的数据源包括:
- GaryBikini/ChinaAdminDivisonSHP: v2.0, 2021, DOI: 10.5281/zenodo.4167299
海拔高度地形数据来自ASTER数字高程模型,并对原始数据进行了稀释。


