Intrusive Multi-threaded C++ Performance Profiling
-
Multi-Threaded
Profile multiple threads at the same time
-
Intrusive
You choose which Threads, Functions, Scopes, Events + Counters that you want to profile
-
Compiled-out in Production builds
You choose whether to include or compile-out profiling calls with a single define 'PROFILE_ENABLED'
-
Default Text file output
Generates a default text file output, that can optionally be replaced
-
Visualiser
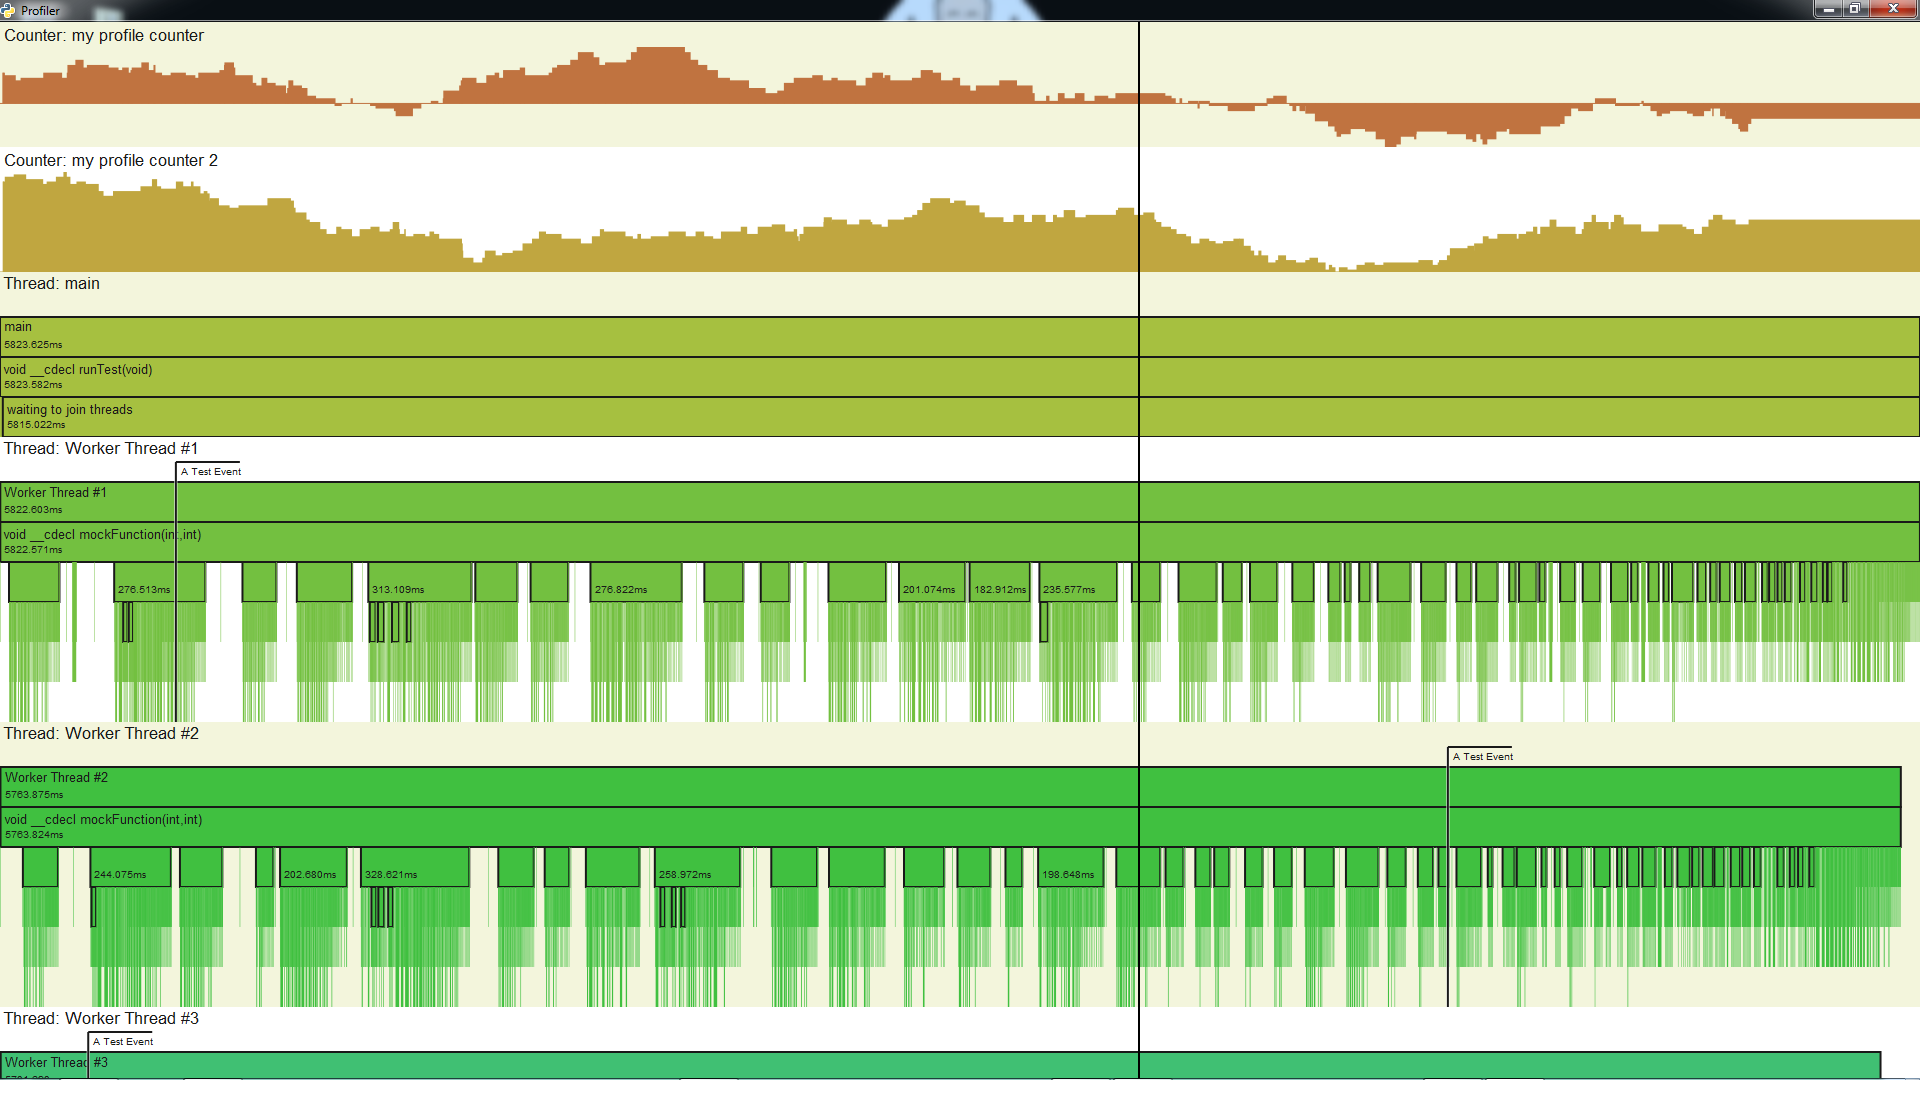
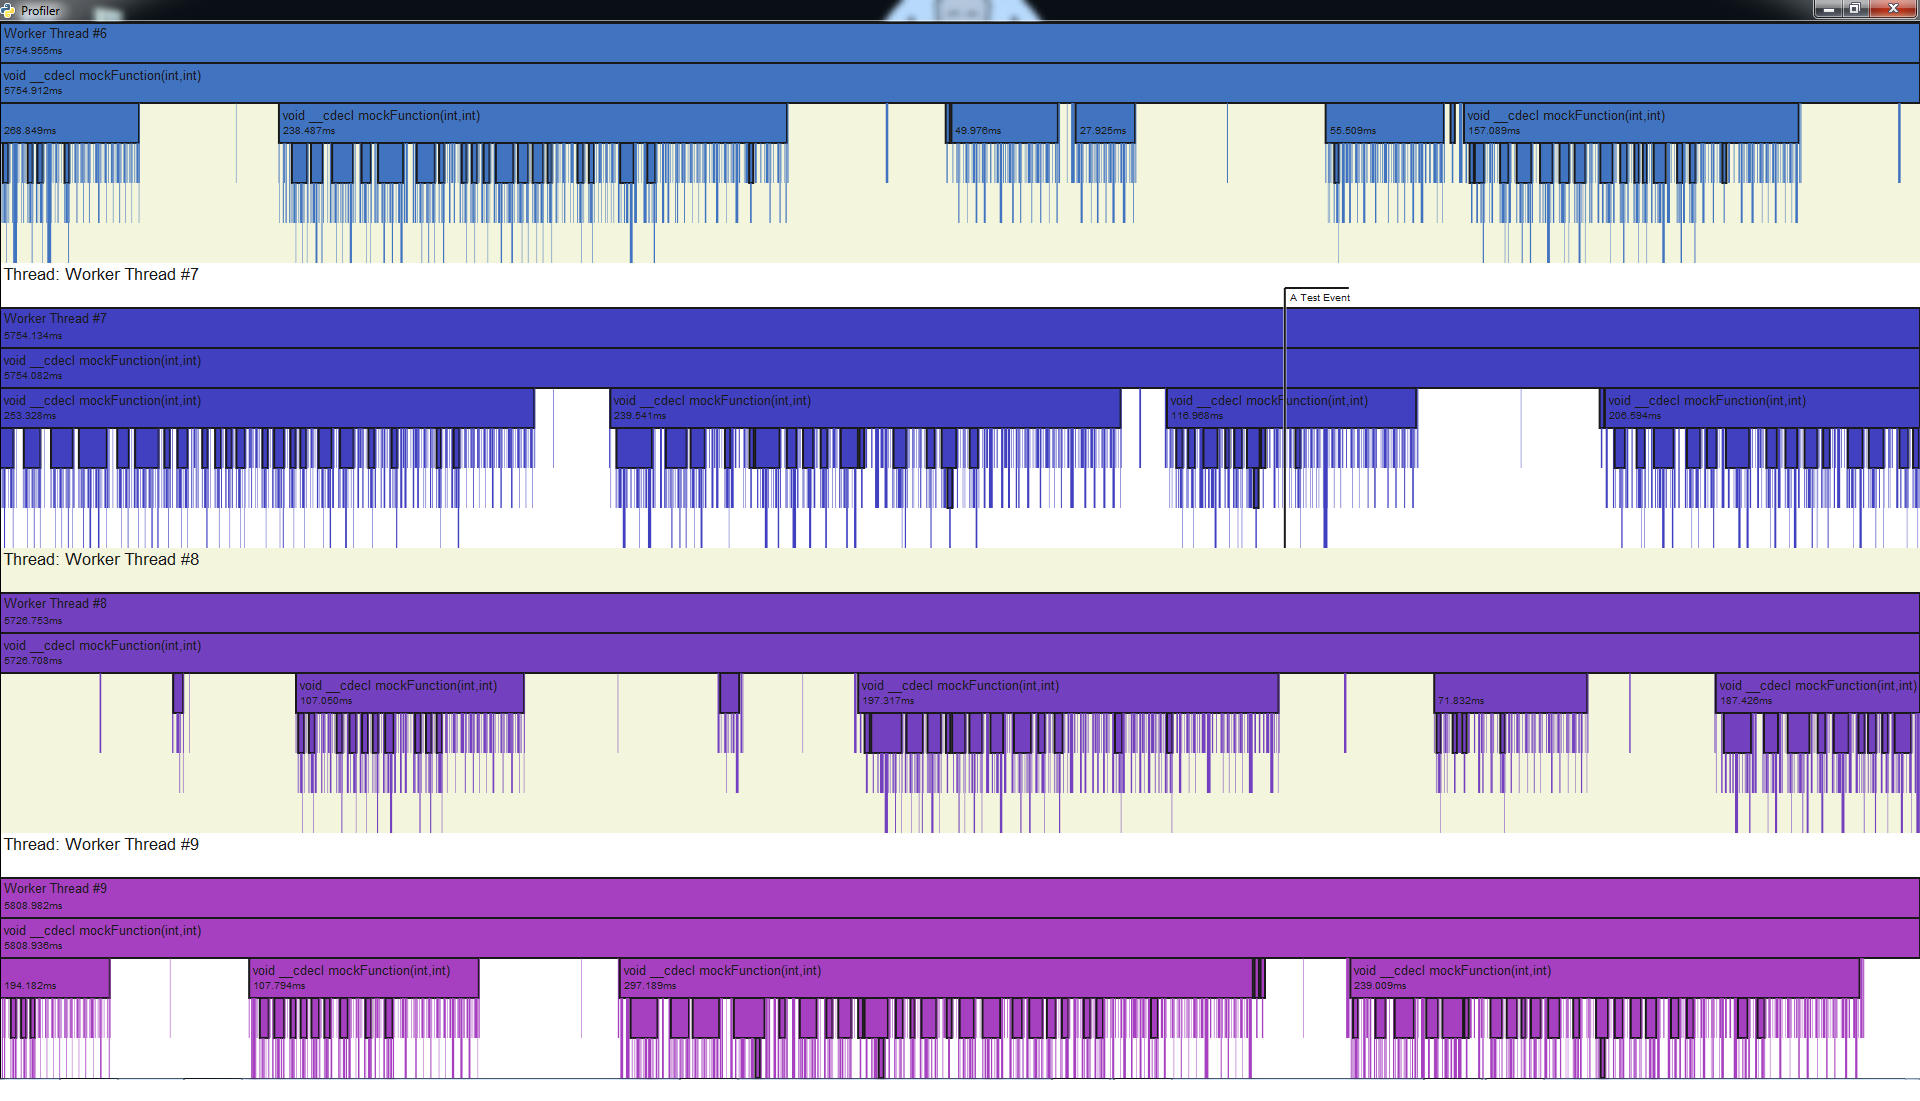
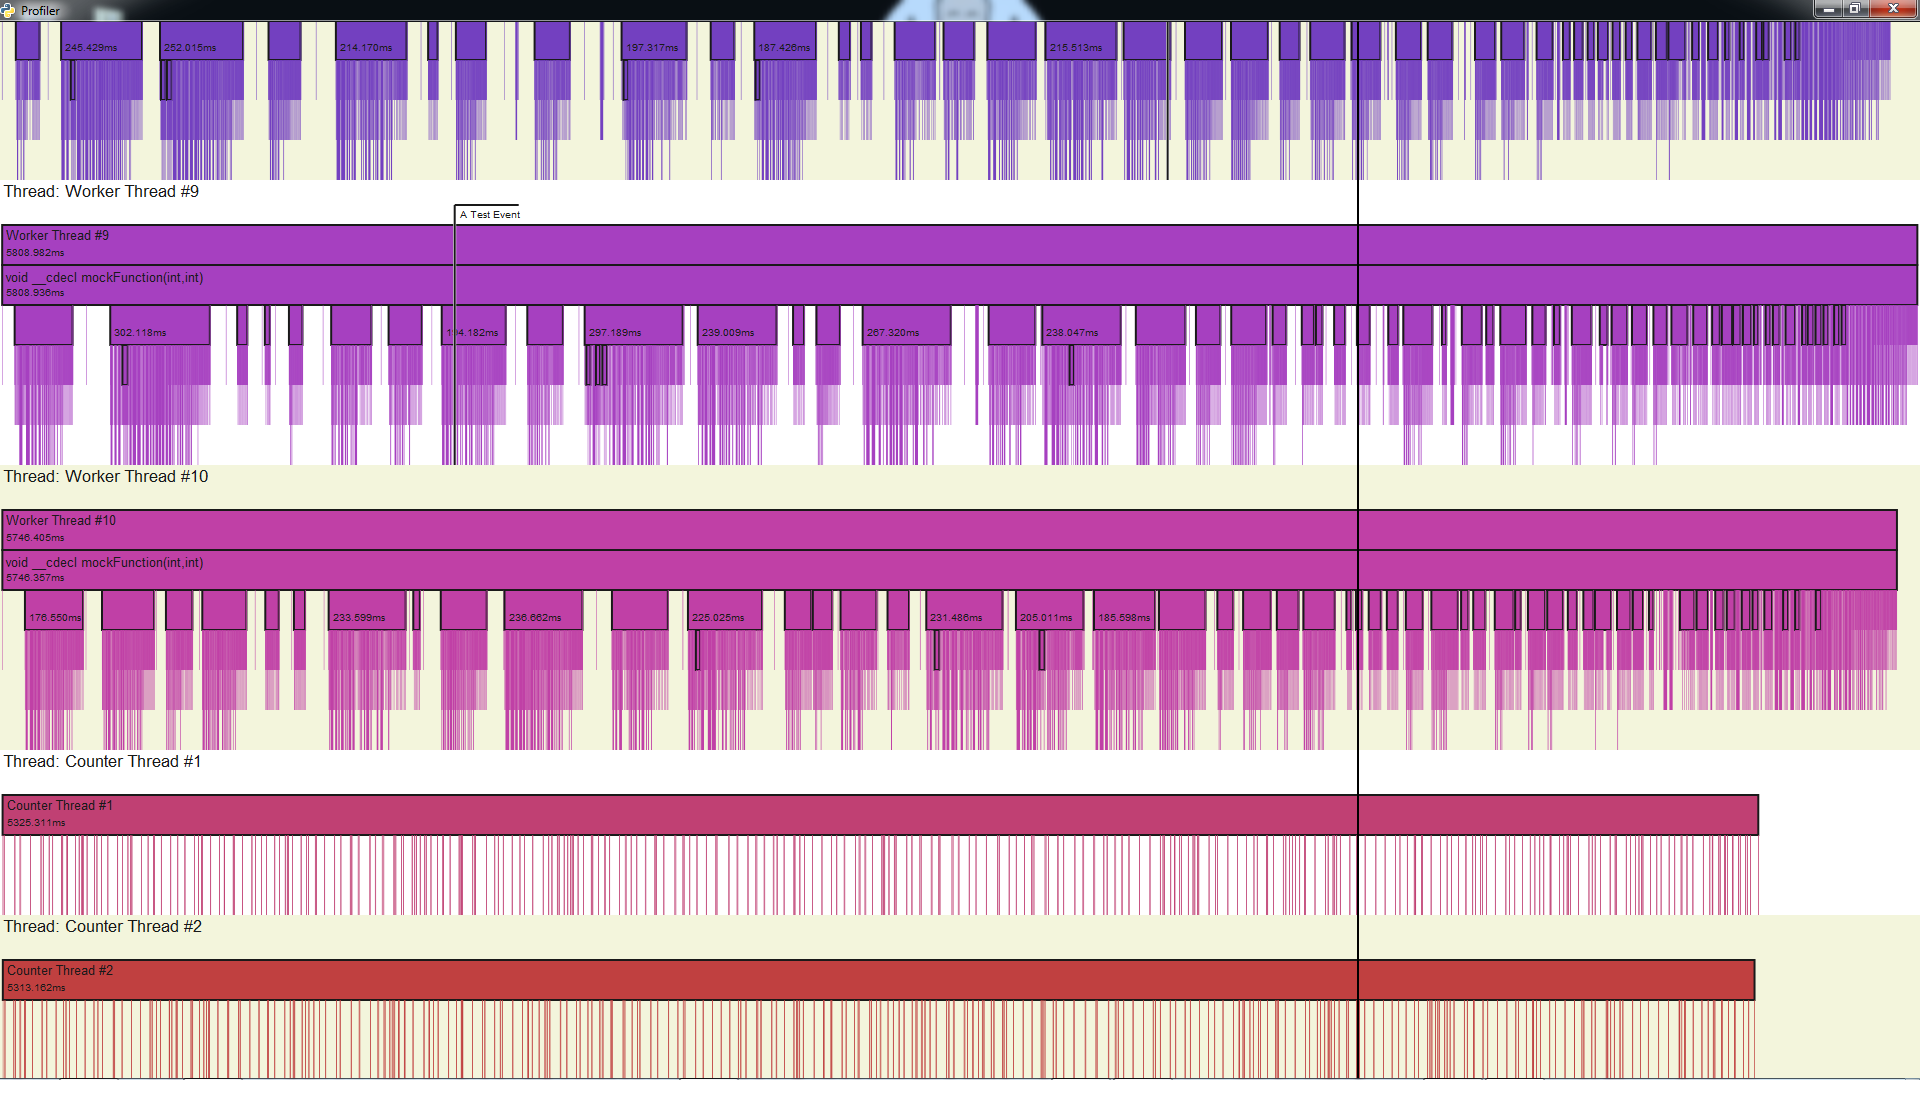
Profile data can be rendered in this profile visualiser
-
C++11
-
Windows
-
Visual Studio (tested on Visual Studio 2017)
The Visual Studio solution includes a sample app that demonstrates how to include intrusive profiling calls into your application.
The solution 'profile\Profile.sln' includes the sample project 'ProfileSampleApp'.
The file ProfileSampleApp demonstrates how to use the profiler in your C++ code:
-
Include "profile\Profile.h"
-
Use the "PROFILE_xxxx" macros to make intrusive profiling calls
(see Usage for description of all "PROFILE_xxxx" macros)
To run the sample, set ProfileSampleApp as the 'Startup Target' and compile + run it.
The sample app should run for approximately 5-10 seconds and generate a profile log file in "profile\ProfileSampleApp\profile.txt"
The profile log file can then be rendered in this profile visualiser
python profiler.pyw --filename ../profile/ProfileSampleApp/profile.txt
-
Implemented intrusively with Macros, so you can control what parts of your C++ application are profiled
-
Profile Multiple Threads
-
Profile Multiple Function calls within each Thread#
- each Function call is captured as a start time + end time + function name
- profiler will track call stack of profiled functions
-
Profile Multiple Events within each Thread
- each Event is captured as a time + a label
- useful for tracking events such as state changes in your application
-
Profile Multiple Counters at global scope
- each counter is tracked as an 'int' value
- useful for tracking quantities such as number of jobs executing concurrently
- Add 'Include' directory to your project's Include Paths
-I profile\Profile\include-
Compile the 'Profile' static library & link it into your project
(use the win32/x64/Release/Debug build as appropriate to match your build settings)
-L profile\Release\Profile.lib- Define the definition PROFILE_ENABLED when you want to enable the profiler + capture profile data
// This is defined by default in the file:
// profile\Profile\include\profile\ProfileSwitch..h

#define PROFILE_ENABLED 1
- Undefine the definition PROFILE_ENABLED when you want to disable the profiler + compile out
// This is defined by default in the file:
// profile\Profile\include\profile\ProfileSwitch.h

//#define PROFILE_ENABLED 1
- Initialise the Profiler in your main thread, before making any profiling calls from your program
PROFILE_INIT(); -
Mark each Thread that you want to profile, before making any profiling calls from it
(note: you can label each thread that you profile)
void myThreadEntryFunction( int arg ) {
    PROFILE_THREAD("My Worker Thread #3");

    /// @todo Do work for this thread + make profiling calls
}
-
Mark each Function that you want to profile, before doing any work in it
(note: The profiler will automatically detect the name of the function being profiled)
void myFunction(int arg) {
    PROFILE_FUNCTION();

    /// @todo Do work in this function
}-
Mark any Scope within a function that you want to profile separately, before doing any work in it
(note: you can label each scope that you profile)
void myFunction(int arg) {
    PROFILE_FUNCTION();

    /// @todo Do work in this function

    {
        PROFILE_SCOPE("the first scope");

        /// @todo do work in this scope that you want to measure separately
    }

    /// @todo Do other work in this function

    {
        PROFILE_SCOPE("the second scope");

        /// @todo do work in this other scope that you want to measure separately
    }

    // @todo Do further work in this function
}- Mark any Event that you want to profile separately
- Events are profiled separately for each thread
- Events are captured as a label and a single timestamp
  if (someSignificantEventHasHappened) {
    PROFILE_EVENT("my event label");
  }
-
Monitor an integer counter
(note: the counter is initialised by default to 0, and can take any 32bit signed integer value)
// define an instance of the counter
// 'myCounter' is a variable, so you can choose whether to make it a global, local or member variable
PROFILE_COUNTER(myCounter);

// initialise your instance of the counter
PROFILE_COUNTER_INIT(myCounter, "my counter name");

// set your counter to a specific value
PROFILE_COUNTER_SET(myCounter, 29);

// increment your counter by a specified value
PROFILE_COUNTER_INC(myCounter, 2);

// decrement your counter by a specified value
PROFILE_COUNTER_DEC(myCounter, 4);
By default, the profiler generates text profile data as specified by the visualiser
Profile data gathered with this profiler can be viewed in this profiler visualiser
-
Replace Visual Studio with Cross Platform cmake
-
Remove mutex use in ProfileConsumerFile to prevent blocking when writing to file
-
Remove dependency on buffering implemented internally in std::ofstream when writing to file


