JianhuaHuang / powerplant_emission_map

shinyLeaflet interaction using powerplants from eGRID

Geek Repo:Geek Repo

Github PK Tool:Github PK Tool

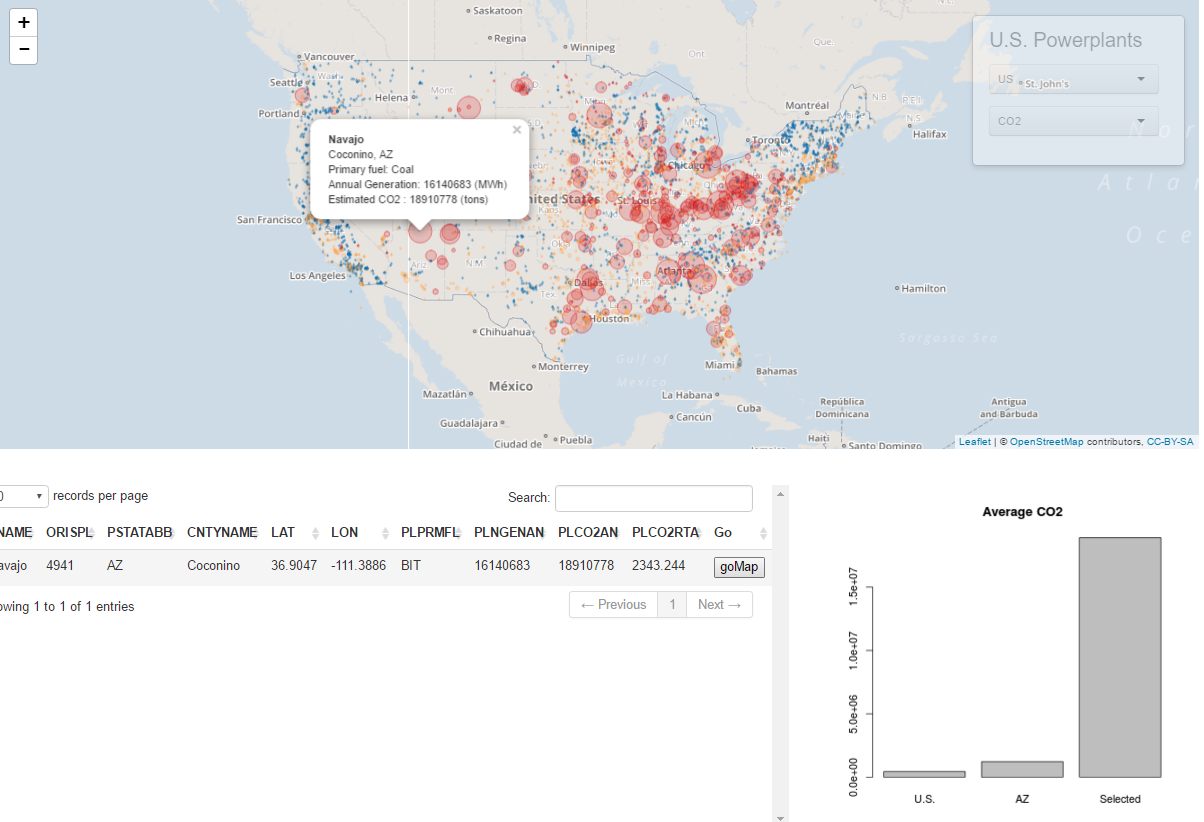
This webiste is designed to visualize the emissions from US powerplants, combing spatial map, data, and figure.

About

shinyLeaflet interaction using powerplants from eGRID


Languages

Language:R 92.6%Language:CSS 7.4%