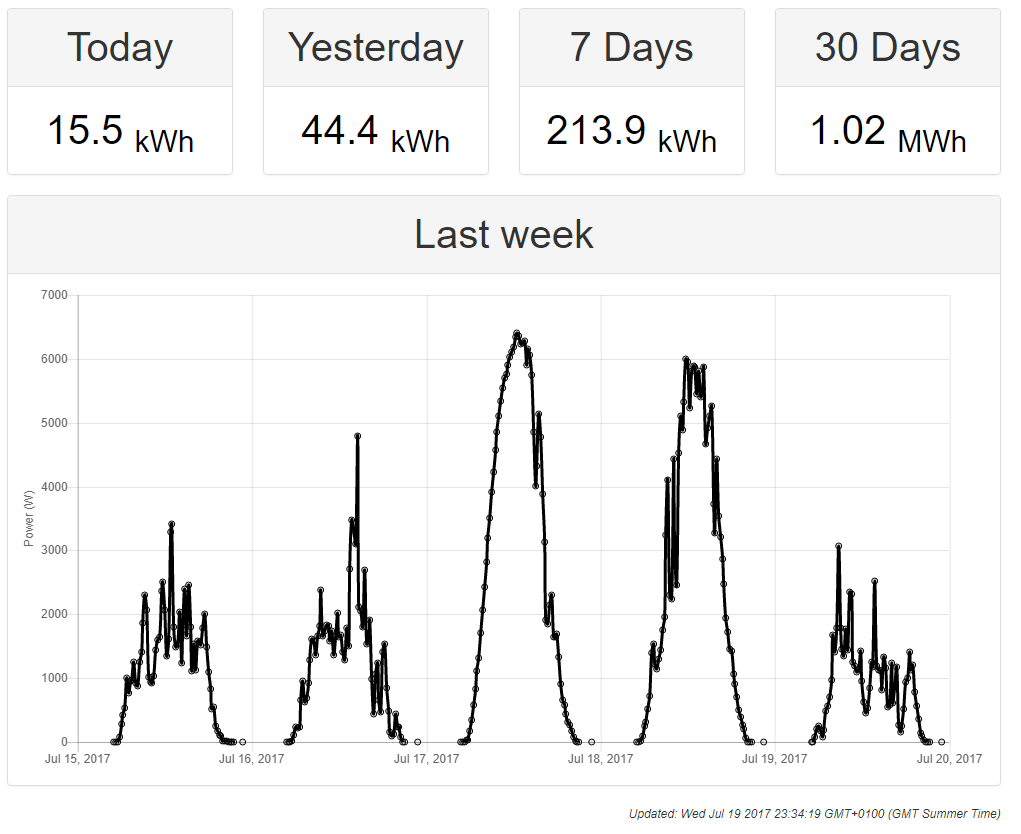
SolarEdge Dashbaord
Website to display data for a solar edge PV array on a display - as an embedded site. Handy for showing data in a foyer screen for example.
Usage
Load https://jbithell.github.io/SolarEdgeESign/index.html in your browser passing code and key as get parameters.
code is your site code, a six digit number
key is your api key, a long alphanumeric string
Display
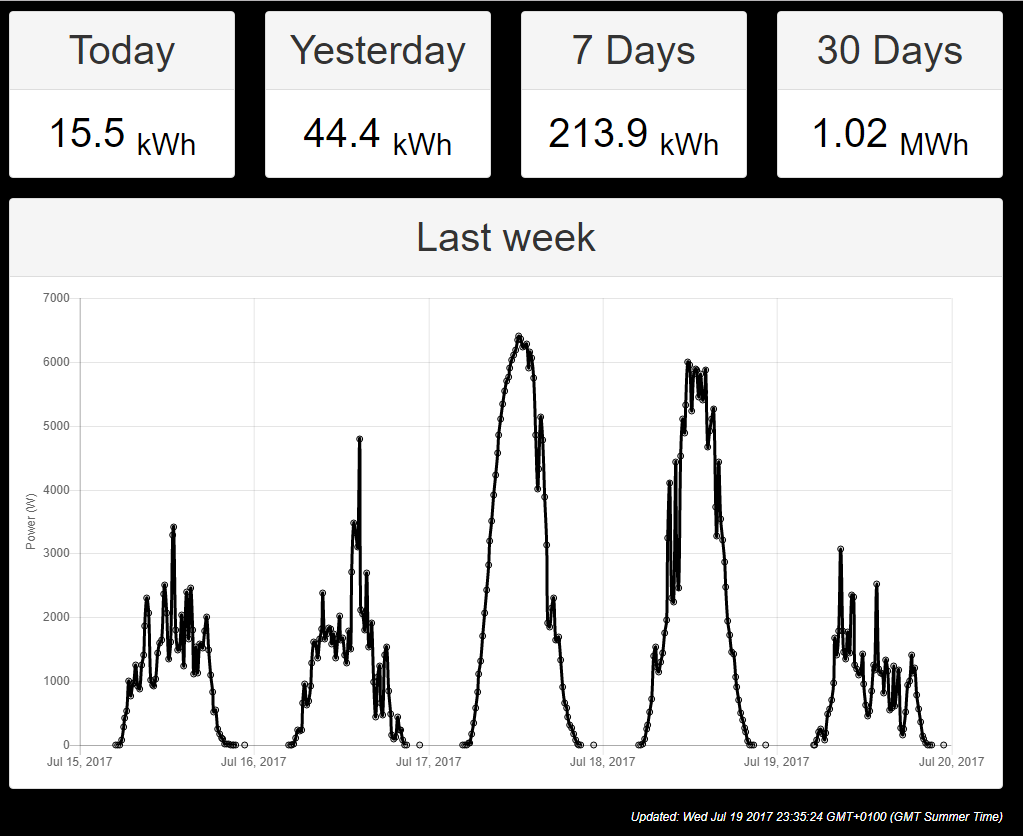
Today the amount generated so far
Yesterday the amount generated in total yesterday
7 Days the amount generated in total over the last 7 days including today
30 Days the amount generated in total over the last 30 days including today
Last week a graph of the last 5 days, including today, in 15 minute intervals - showing the power at that point (in Watts - not Watt hours)
AutoUpdate
The data on the screen is refreshed every 30 minutes (from the time it was first loaded), except between the hours of 9pm and 6am when updates are disabled to save API key quota usage (the data won't change during that time anyway - the sun has gone in!)
Settings
Background Colour
This system supports screens with a black background - just pass &black=true as part of the URL
Show Graph
Pass &graph=true to show the graph
Zoom
Pass &zoom=0.5 to set zoom to 50%. Values between 0.01 and 1 accepted

