Aim of this challenge is to aid school board and mayor of a district make key strategic decisions regarding future school budgets and priorities.
The task was to analyze district-wise standardized test results of students and draw factual conclusions about the trends observed in school performances.
-
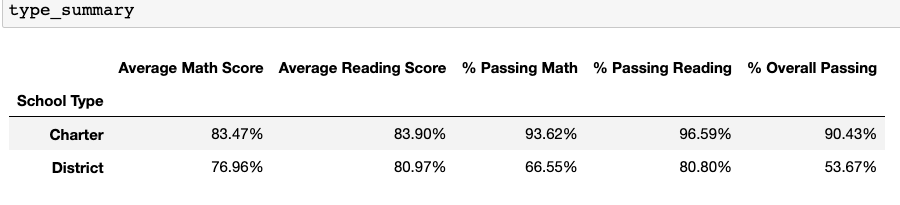
As Charter Schools have more flexibility in adopting advanced learning programs, it is indicative in the overall passing rate of school types. Charter Schools have an increase of 36.76% in overall passing rate in comparison with District Schools.
Note: Overall Passing % for Charter Schools and District Schools is 90.43% and 53.67% respectively
-
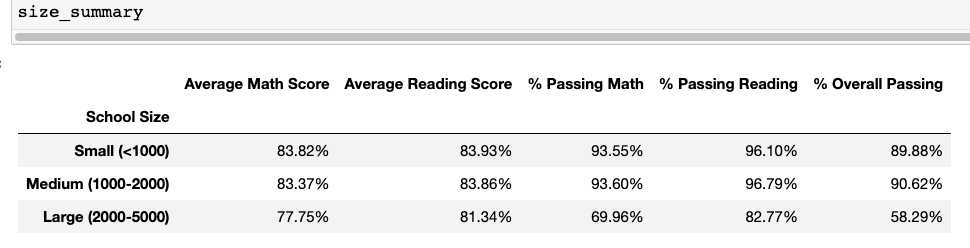
Small and Medium schools (with students ranging from 1000 <= 2000) fare considerably better in comparison to Large schools (with students ranging from 2000 <= 5000).
There is at least a 30% increase in overall passing rate between Large and Small/Medium schools.Note: Overall Passing % for Small, Medium and Large Schools is 89.88%, 90.62% and 58.29% respectively
-
Ironically, a lower spending budget per student indicates students faring exceptionally well. From the spending summary it is evident that a spending budget of < $585 yeilds an overall passing rate of 90.37%, whereas increasing the budget shows a steady decline in the overall passing rate.
The worst performance is student spending budget ranging between $645-680 (with an overall passing rate of 53.53%)
Note: Overall Passing Rate for students is,
<$585: 90.37%, $585-630: 81.42%, $630-645: 62.86% and $645-680: 53.53%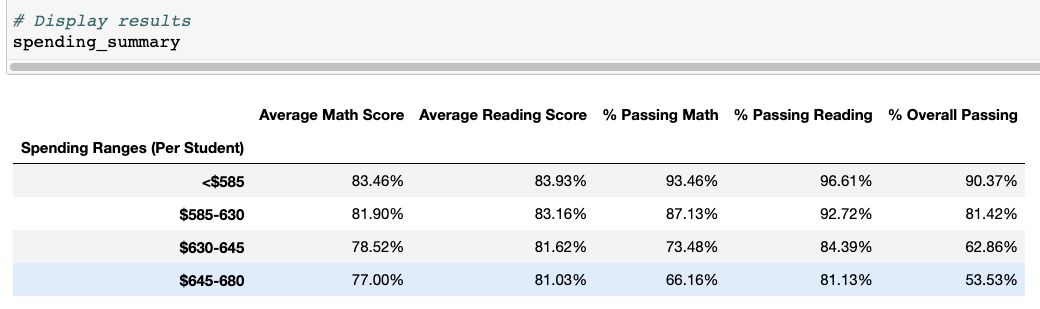
-
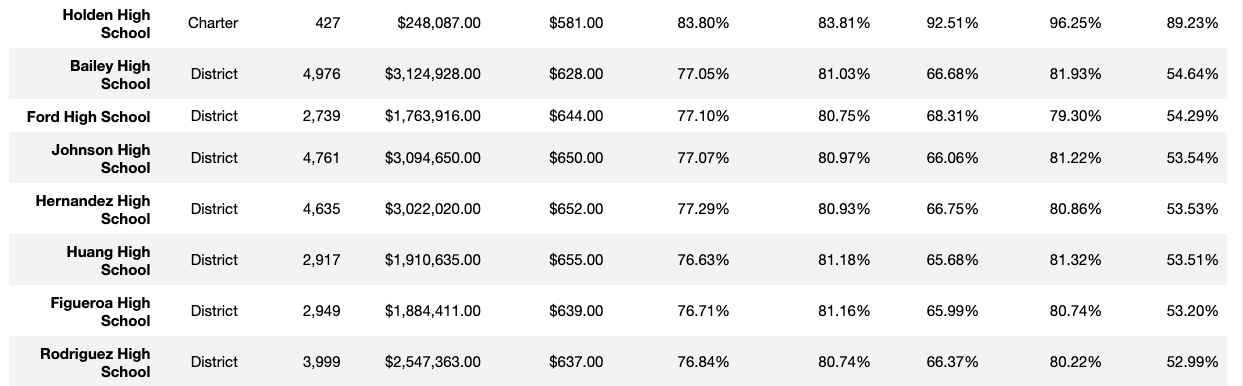
Top performing schools are consistenly Charter Schools, while the bottom performing schools are District Schools.
Charter Schools have an overall passing rate of >= 89%, while
District Schools have an overall passing rate of <= 54%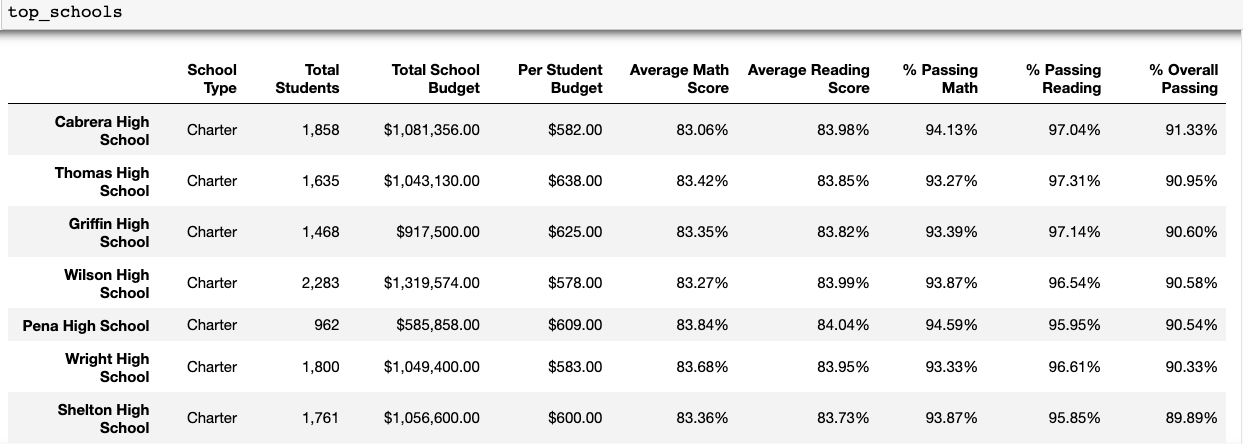


To run this script:
- Copy the git link in your local git repository
- Ensure Resources directory and PyCitySchools.ipynb file are present
- Ensure the respective csv datasets are present in the Resources folder
- Run the script using Jupyter Notebook from PyCitySchools directory and view results
- Be sure to run the entire script using Restart & Run All option from Kernel in Jupyter Notebook to get error free results
- Or, you could alternatively run each block of code individually starting from the very top
- In additon, you could change the csv dataset containing the same columns in Resources folder and run the code to see the results
To write this script, I used the starter code provided and discussed the school summary value calculations with my TAs.
They helped me write a small portion of the logic to calculate some group by objects. I also discussed a small syntax error with my peer, who helped me correct it and get the desired school summary dataframe.
Majority of the work went into understanding the various errors I encountered. I learnt a lot about creating dataframes using group by series and formatting errors when attempting arithmetic manipulation on data (with datatype: object)
https://sparkbyexamples.com/pandas/pandas-map-function-explained/
https://www.methodschools.org/blog/5-differences-between-charter-and-public-schools
https://www.datacamp.com/tutorial/markdown-in-jupyter-notebook
https://builtin.com/data-science/pandas-show-all-columns
https://pandas.pydata.org/docs/reference/api/pandas.set_option.html