Pharmaceutical Squamous Cell Carcinoma (SCC) Treatment Analysis & Visualization
A new pharmaceutical company that specialises in anti-cancer medications. Recently, it began screening for potential treatments for squamous cell carcinoma (SCC), a commonly occurring form of skin cancer. As a senior data analyst at the company, you've been given access to the complete data from their most recent animal study. In this study, 249 mice who were identified with SCC tumours received treatment with a range of drug regimens. Over the course of 45 days, tumour development was observed and measured. The purpose of this study was to compare the performance of Pymaceuticals’ drug of interest, Capomulin, against the other treatment regimens. The executive team has tasked you with generating all of the tables and figures needed for the technical report of the clinical study. They have also asked you for a top-level summary of the study results.
-
Here we have the datasets of pharmaceutical company that specializes in anti-cancer medication with some study results.
-
Perfoming some different operations on the dataset, we found some important observations.
-
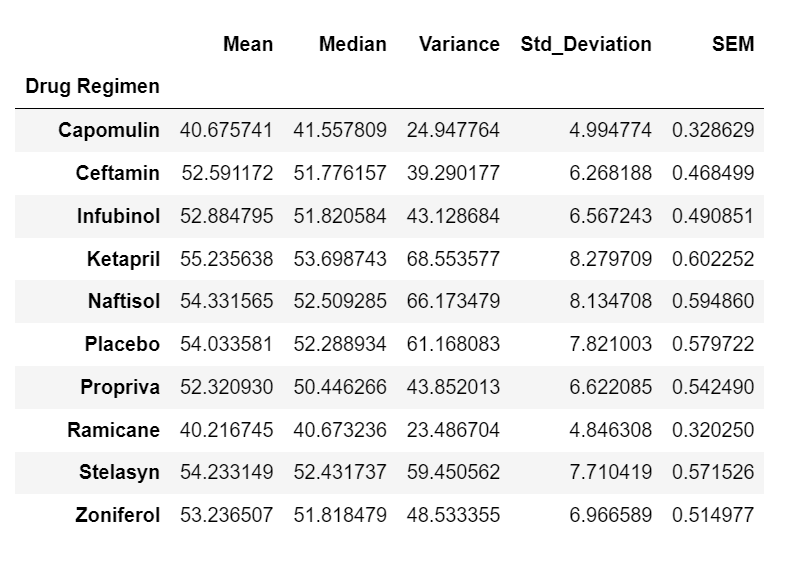
Capomulin and Ramicane drugs have very low varience for overall tumor volume size in the summary dataset. So, these two drugs regimen ca be used for further detail analysis.
-
Ketapril and Naftisol are the two most inconsistent drugs as show high varience. These should not consider the drugs
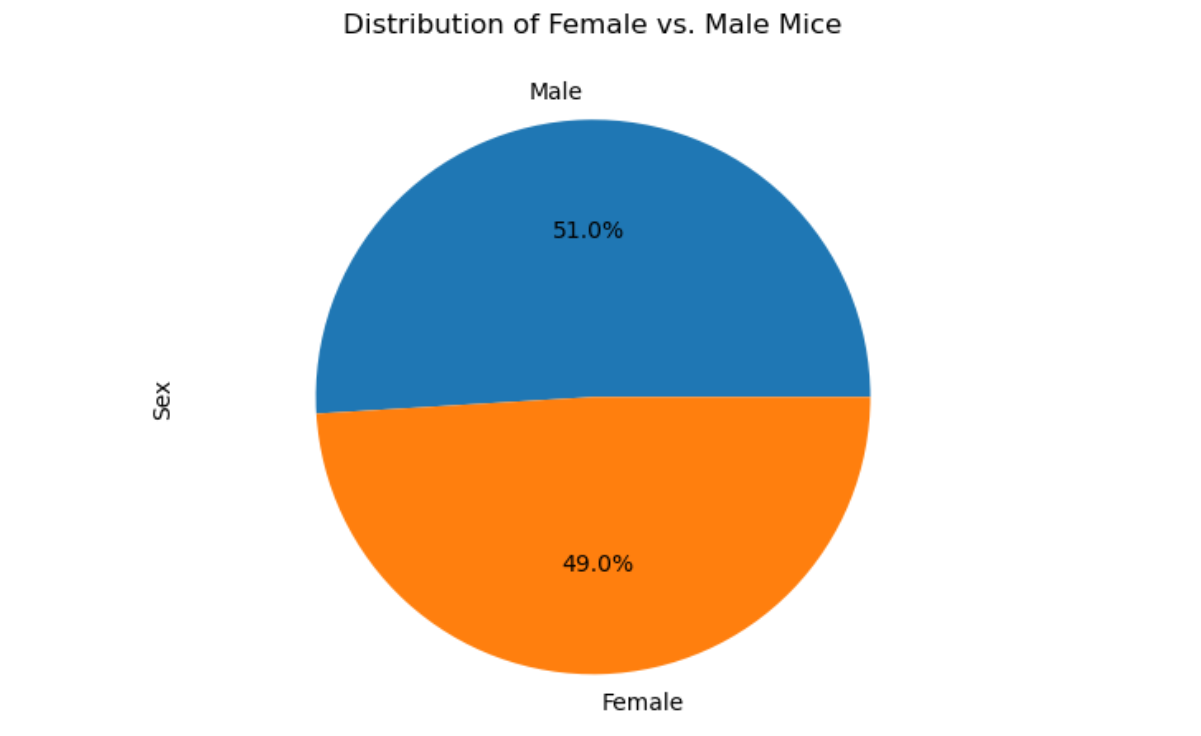
- The level of distribution for male and female mice is quite the same as shown in the pie plot.
-
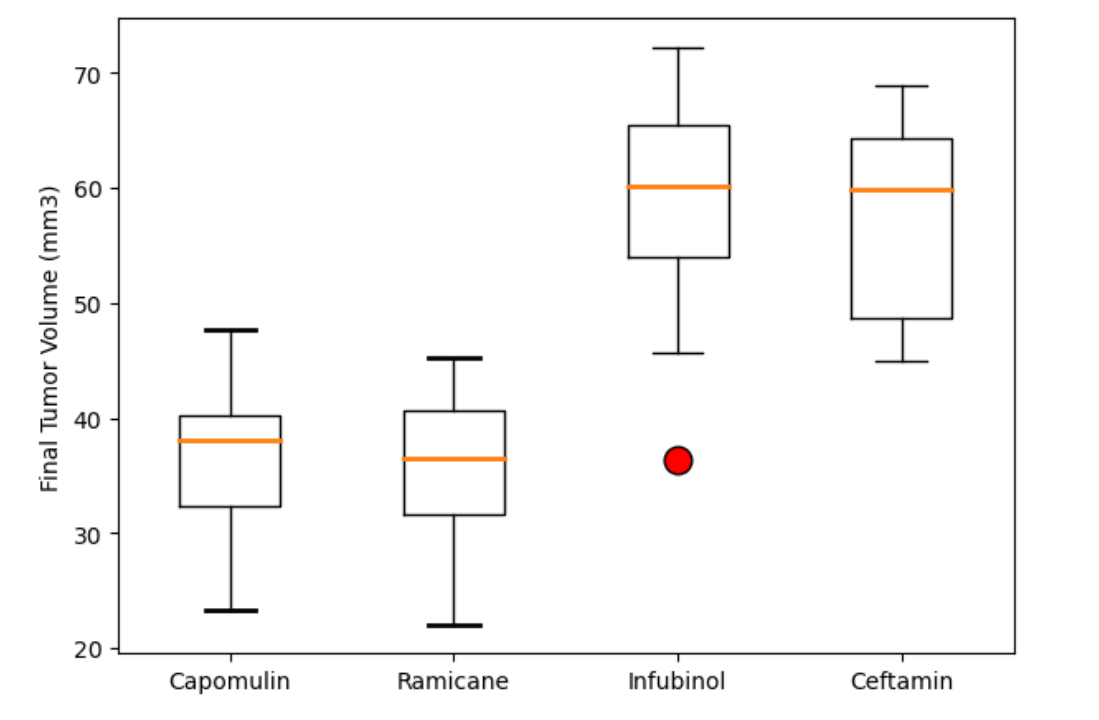
Considering the boxplot for all the fours Dug Regimens, we found that the overall distribution of final tumor volume is less than 40 for Capomulin and Ramicane.
-
The other two medicines i.e Inubinol and Ceftmin has higher distribution for final tumor volume is higher than 60.
-
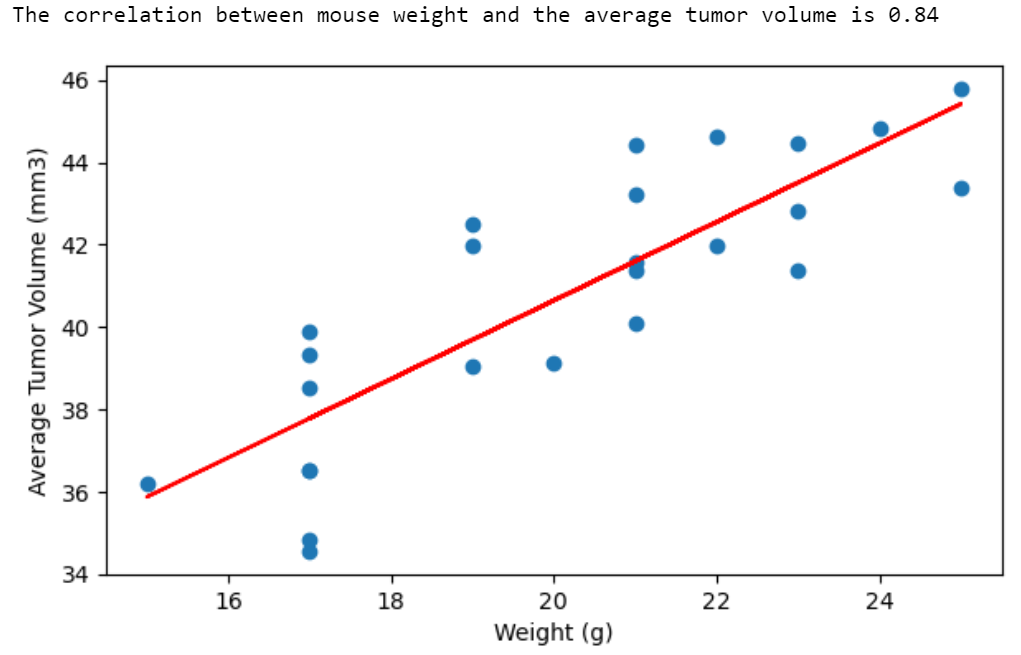
Normally, the average tumor volume is correspondence to the values of weight.
-
The correlation between mouse weight and the average tumor volume is near to 1 i.e. only 0.84


