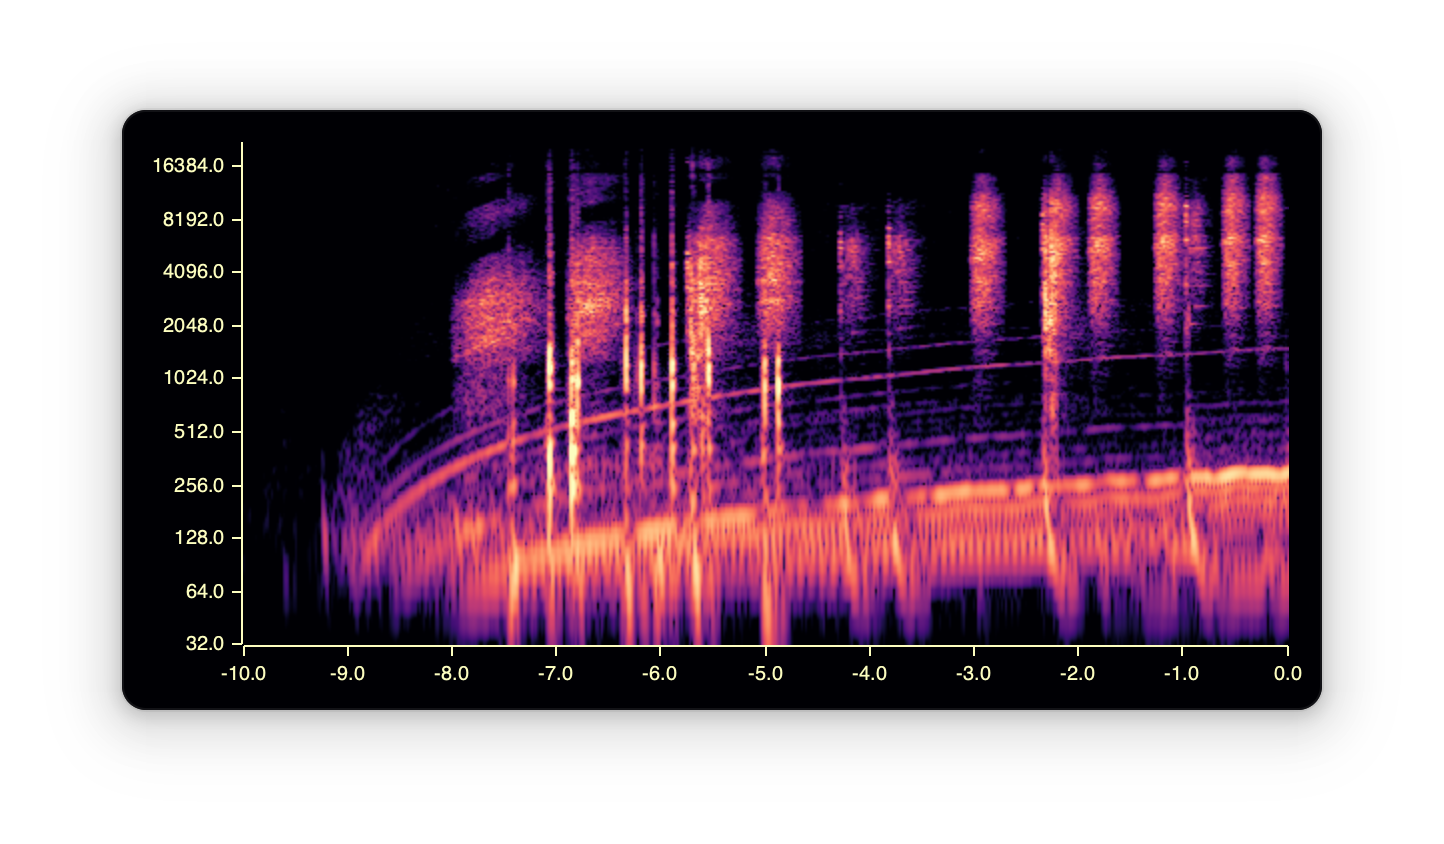
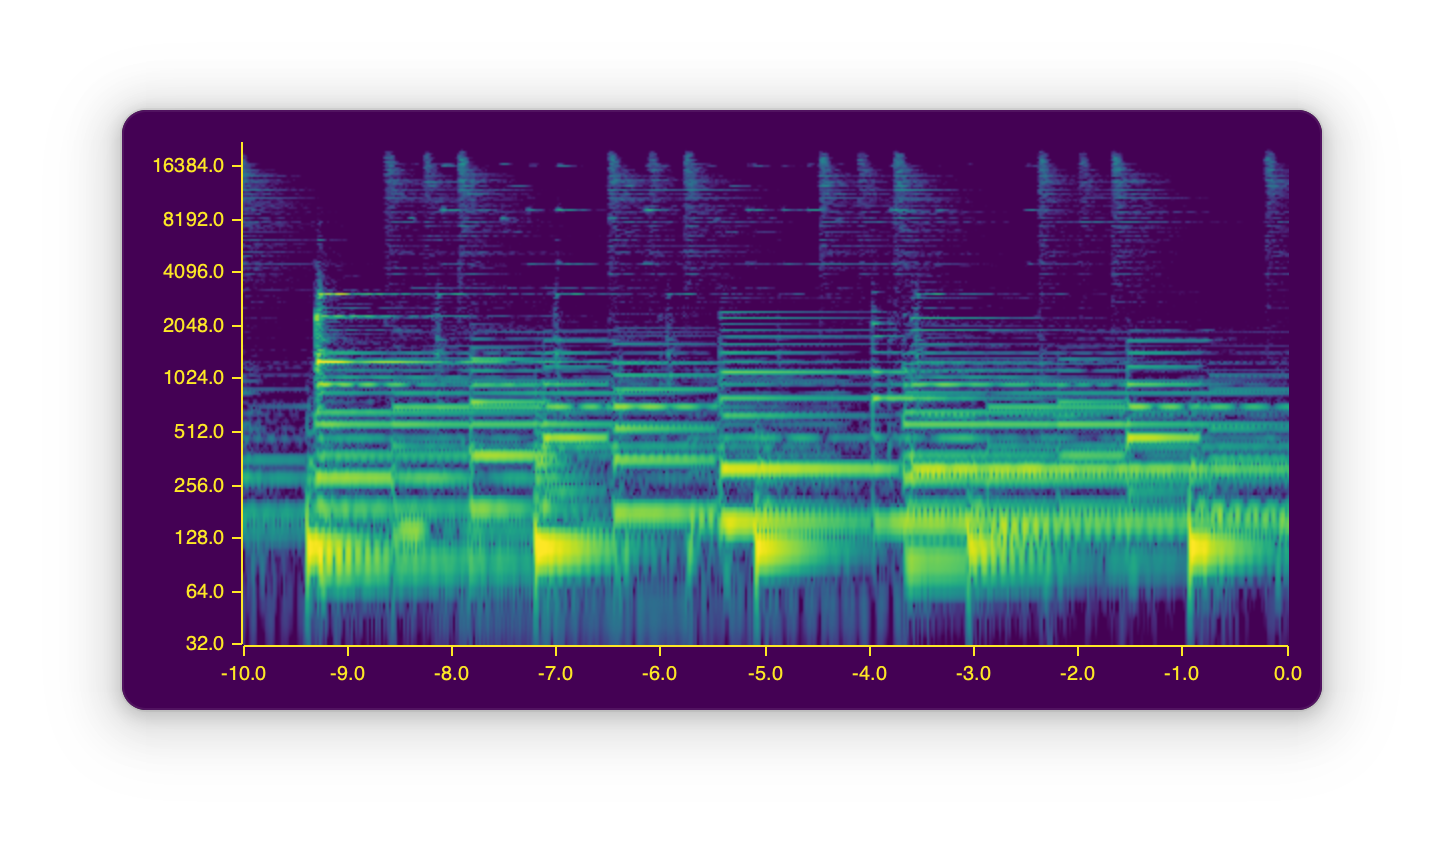
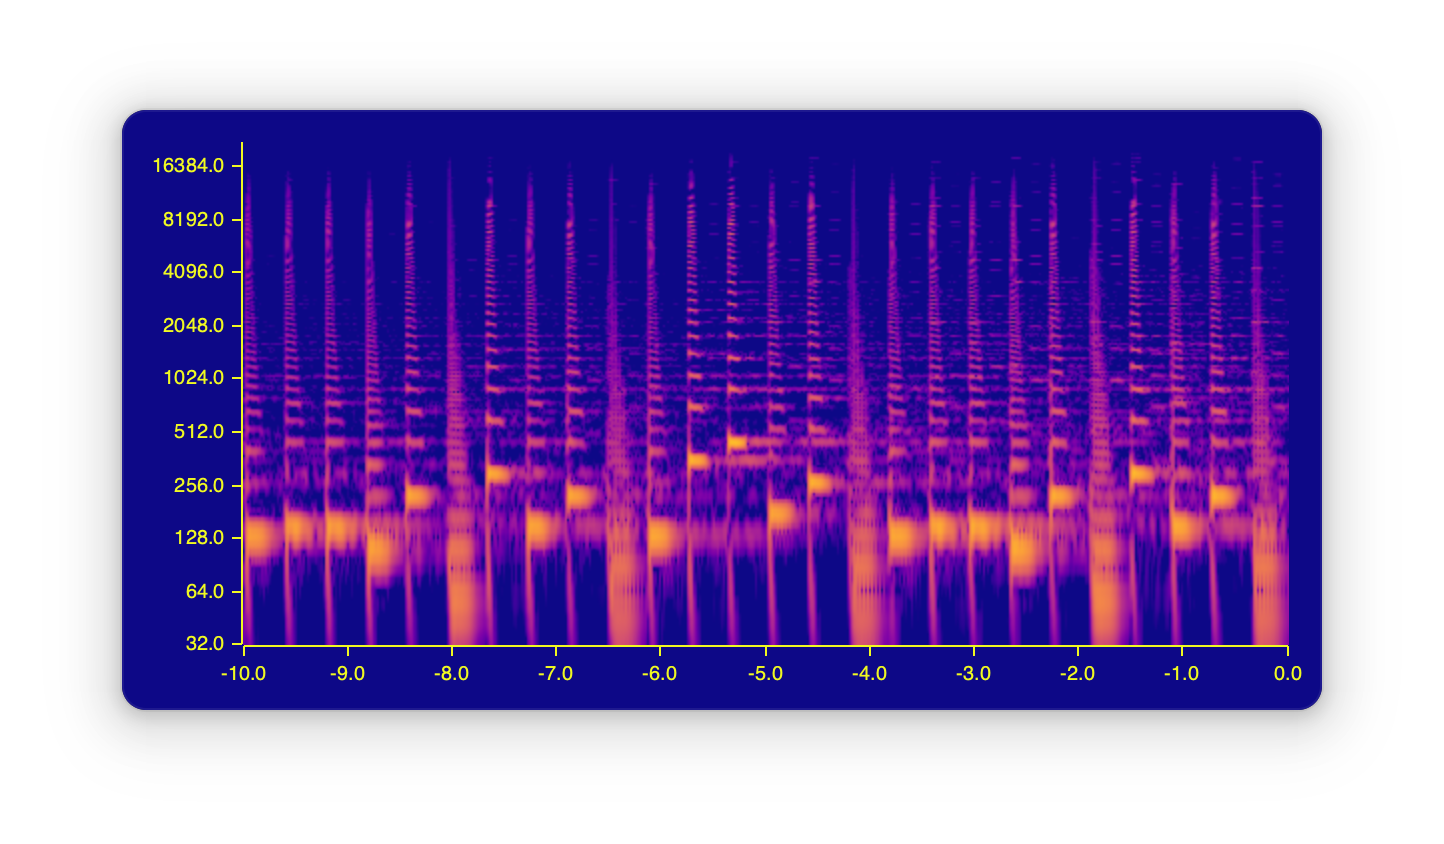
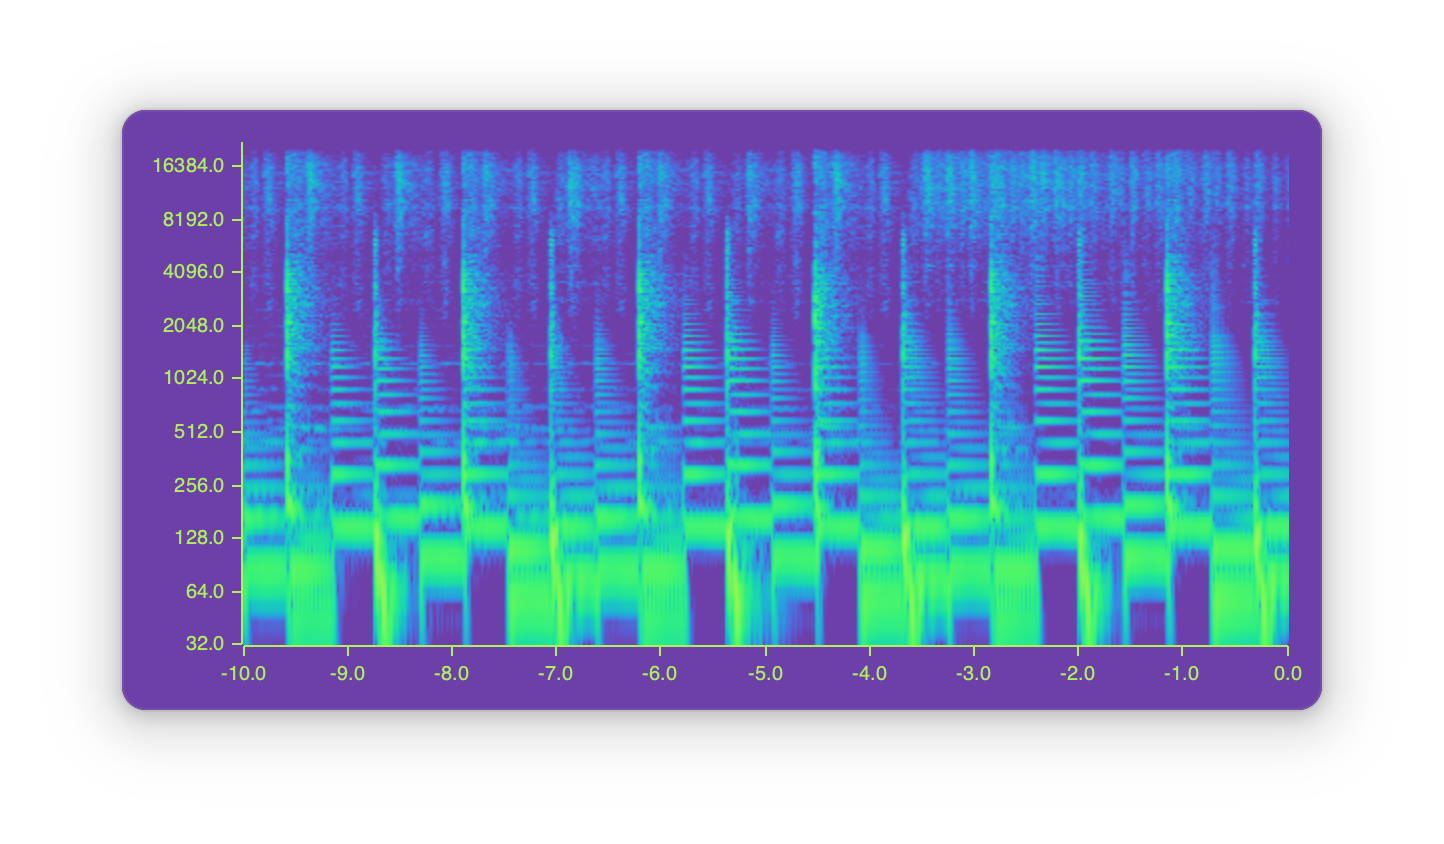
A simple cross-platform live scrolling spectrogram.
When used in combination with a loopback (like blackhole on MacOS), it can view sound from any application.
The program was designed for low latency from the start, meaning that the spectrogram really is live -- sounds should appear on the plot within one frame of hearing them.
It has also been optimized for low power usage; FFTW provides a very well-tuned DFT implementation, and plotting is done with minimal updates to a retained buffer. The end result is a program which uses less than 50% of a single CPU on my M1 mac when built in release mode. These efficiency tweaks have the knock-on benefit of very smooth scrolling with no stuttering at all window sizes.
Hann windowing and input padding are used to produce a high-quality Fourier Transform, and the resulting frequency bins are resampled with cosine interpolation to produce a more readable log-frequency scaled output. This makes it easy to see details across the human range of hearing.
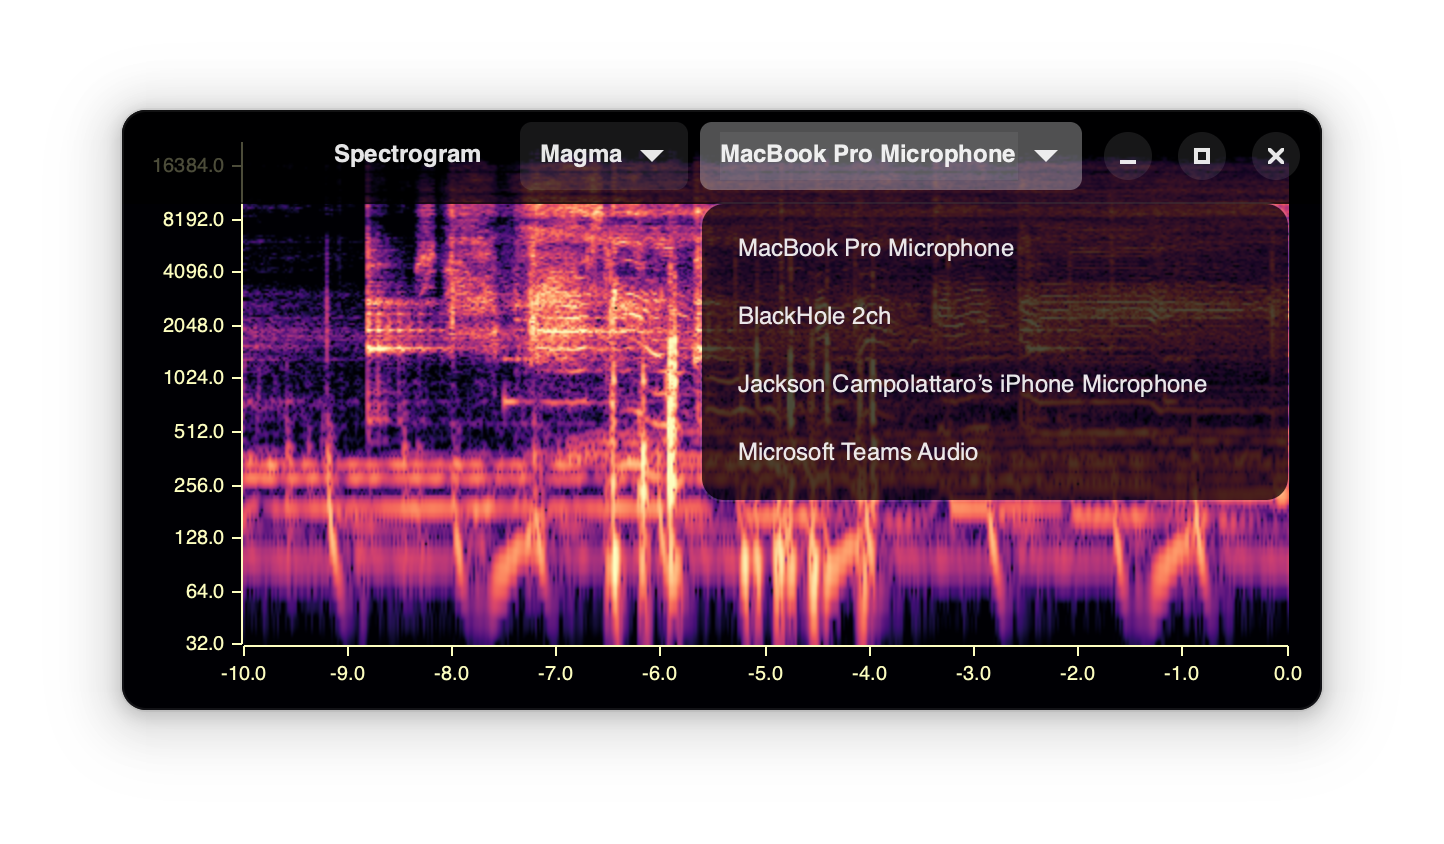 Inputs are discovered using cpal,
and you can seamlessly switch between inputs at runtime.
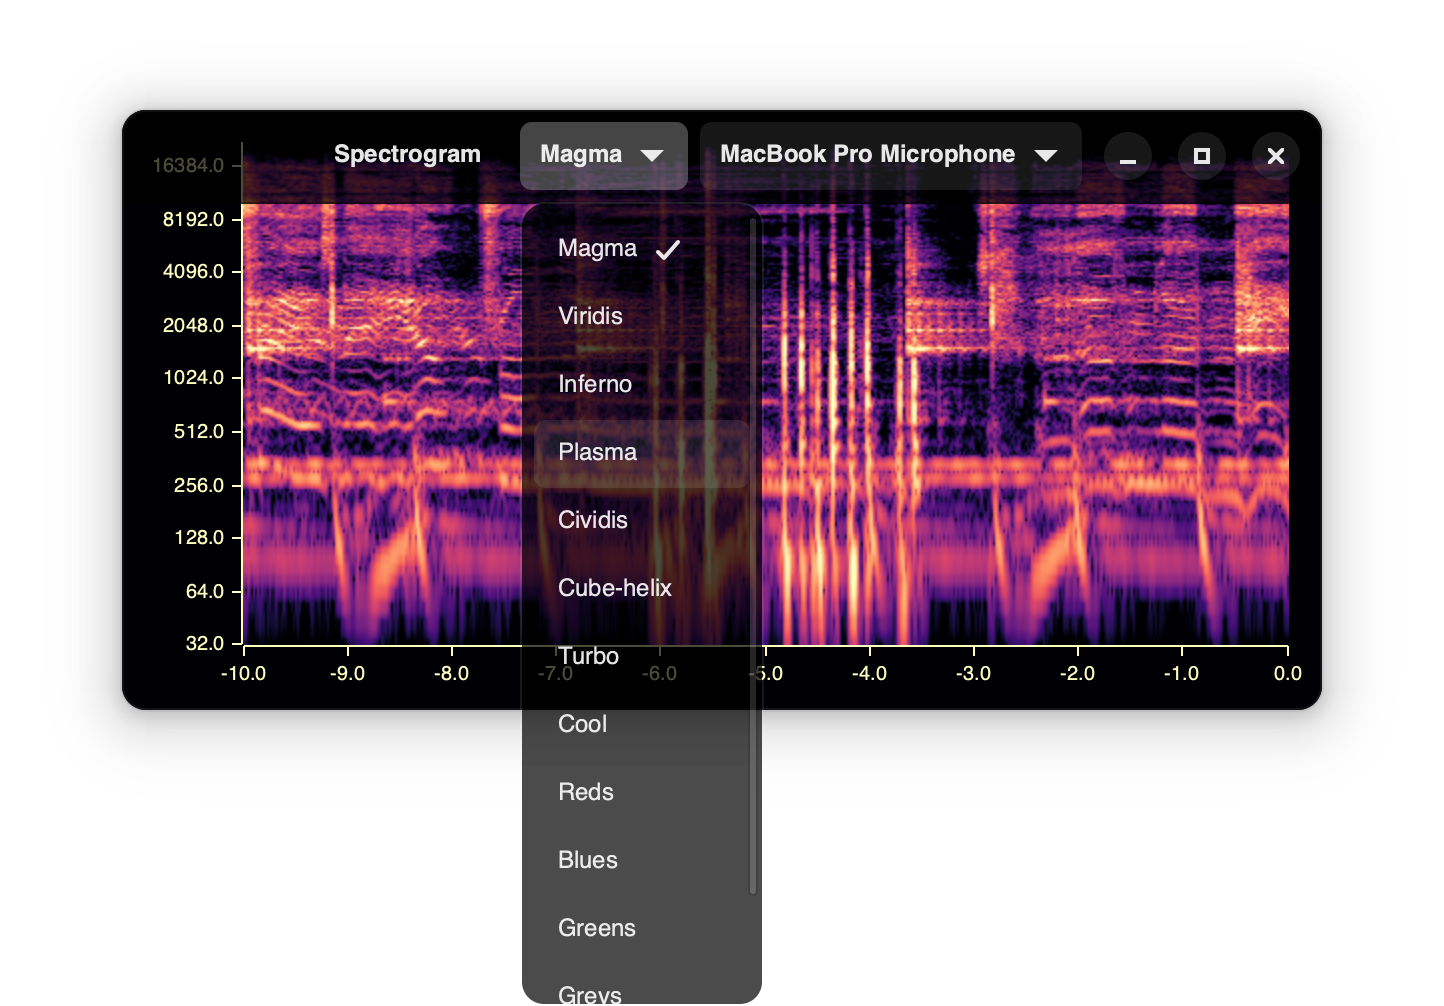 Thanks to colorous,
Matplotlib's diverse selection of gradient color schemes is available to choose from.
