ENM502-2021-hw4
Introduction
The finite element method (FEM) is a widely used method for numerically solving differential equations arising in engineering and mathematical modeling. In this homework, we are going to simulate a reactive solute(a fully developed parabolic flow) in a rectangular channel with FEM.
The equation of the flow could be described as
$$
v(y) \frac{\partial c}{\partial x}=D \nabla^{2} c-k c
$$
where v is is the parabolic flow velocity profile
$$
v(y)=\alpha\left(\frac{H^{2}}{4}-y^{2}\right)
$$
D is the solute diffusion coefficient and k is the (first order) reaction rate constant.
Problem Setup and Formulation Finite Element Method
Here we briefly introduce the steps of finite element method(FEM). See the detailed equation in next two sessions.
- Derive the Weak form by applying the Galerkin's method
- Use FEM to divide the whole grid into elements with unit grid. Write the whole integration into integration of each elements
- Use bilinear elements and express all integrals in terms of integrals over the unit element.
- Use
3x3Gaussian quadrature to evaluate the integral.
Problem Setup and Formulation Weak form of PDE
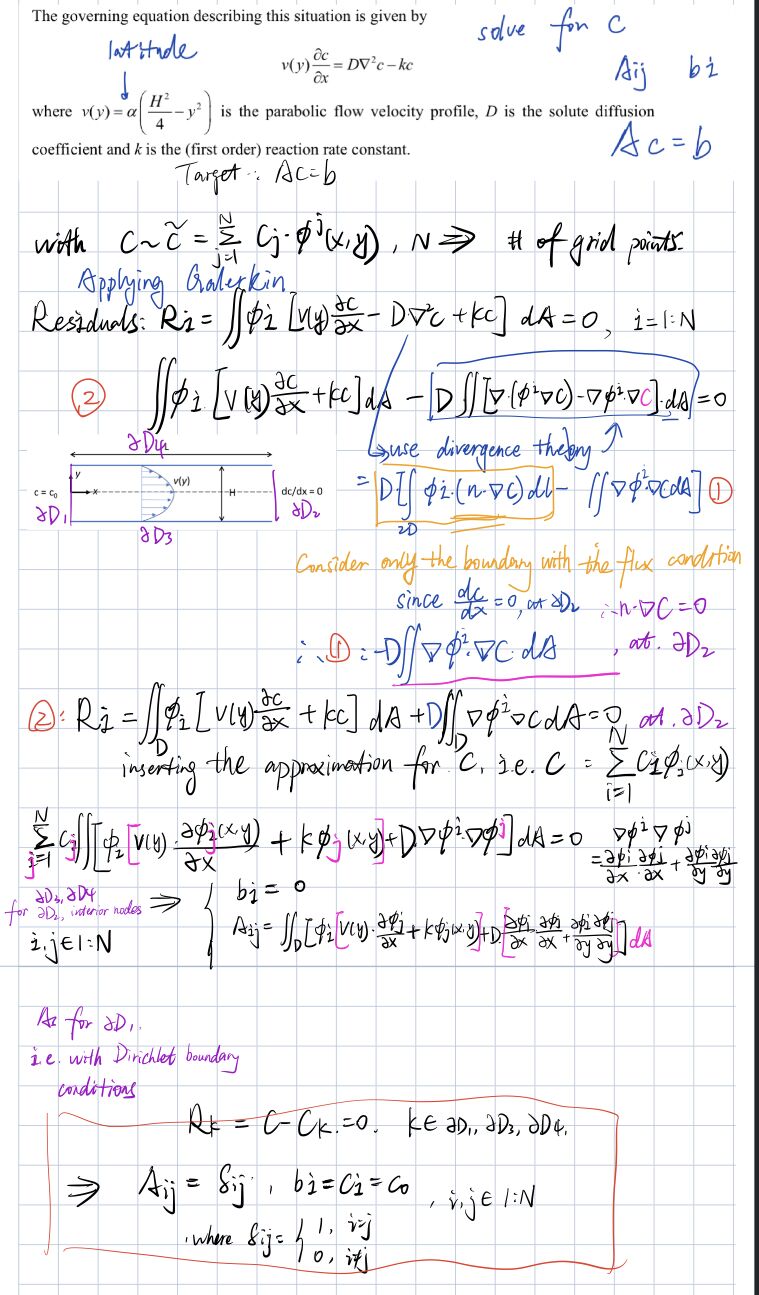
Here we derive the weak form in the form of handwriting.
(made by @Ling Xie)
Problem Setup and Formulation Gaussian Quadrature
Here we derive the Gaussian Quadrature in the form of handwriting.
| Discuss the basis function, the Jacobin matrix(used to map from global to unit element). |
|---|
 |
| Plug in the weight and basis functions |
 |
| The layout of the gauss quadrature. |
 |
(made by @Siyu Zhao)
Result and Discussions Plots and comparison between different parameters
The basic condition is α = 1; D = 1; k = 1 H = 2 and L = 10
Result and Discussions(Accuracy)
Here we define the solution error as the L2-norms between the fine grid and coarse grid.
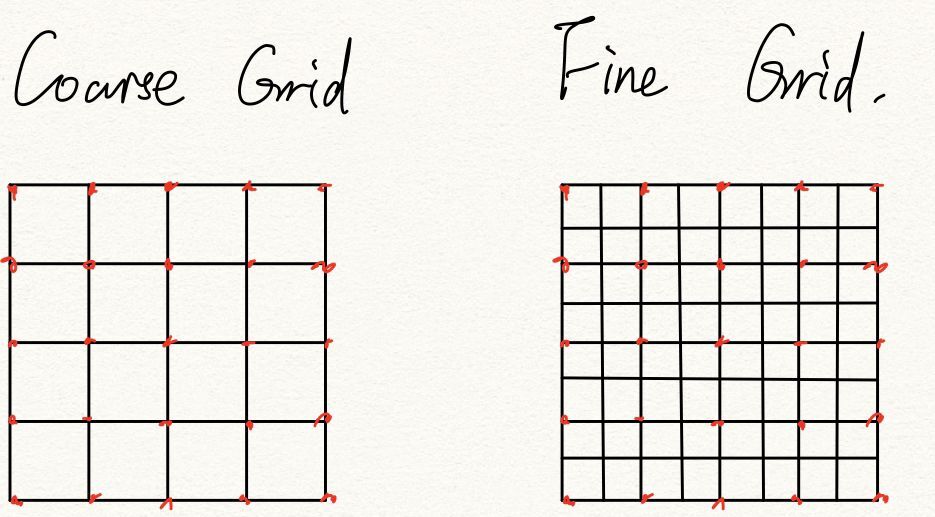
Define the error
Given a coarse grid and a fine grid, which represents the field under different resolution, we calculate the L2-norms between the same place on each grid(the red dot). Under this setting, we could save interpolation step without losing too much accuracy.
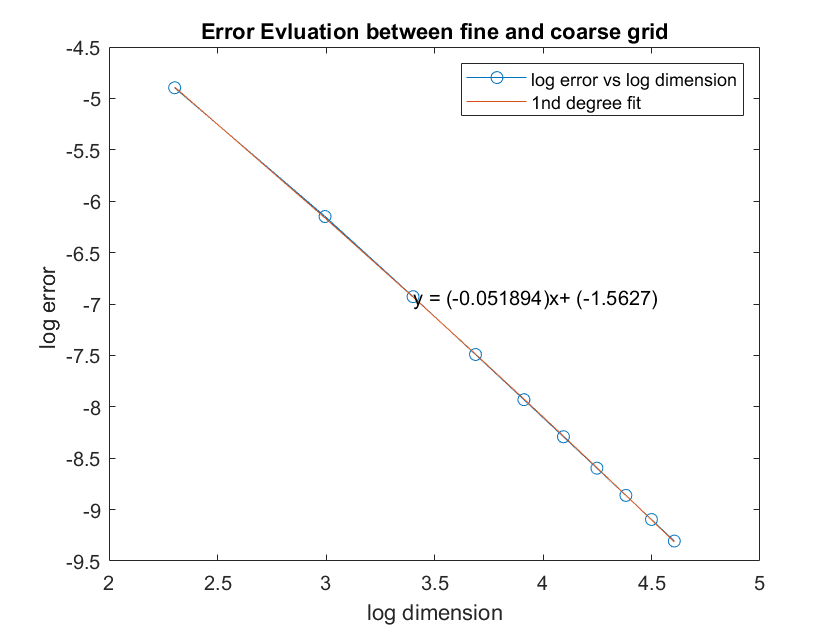
In our expectation and knowledge of error, the error e basically follows C*h^P, where h is our case could be the dimension of the grid, D , k, C and P are both constant.
So we change the dimension of the grid(but keeping the ratio of each grid), use the finer grid as the leading groundtruth to calculate the error of the coarse grid.
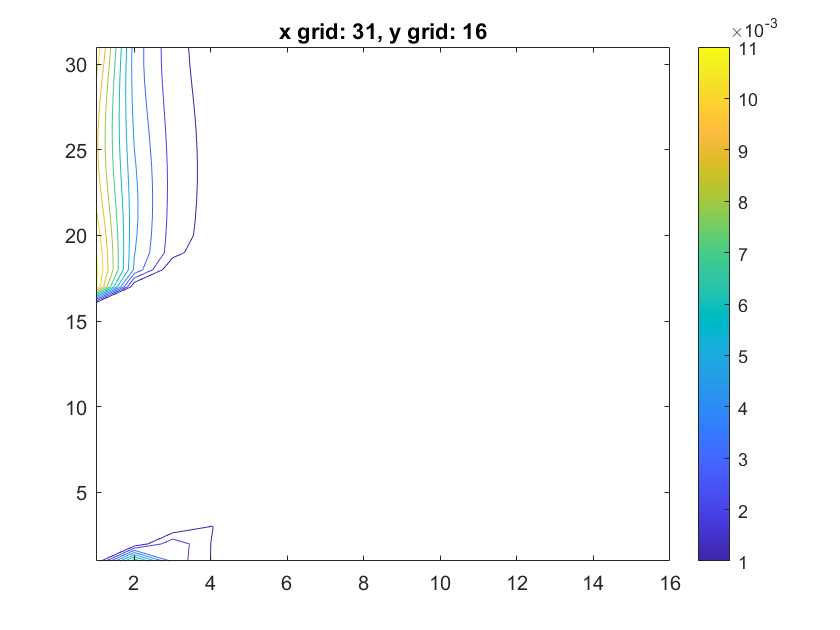
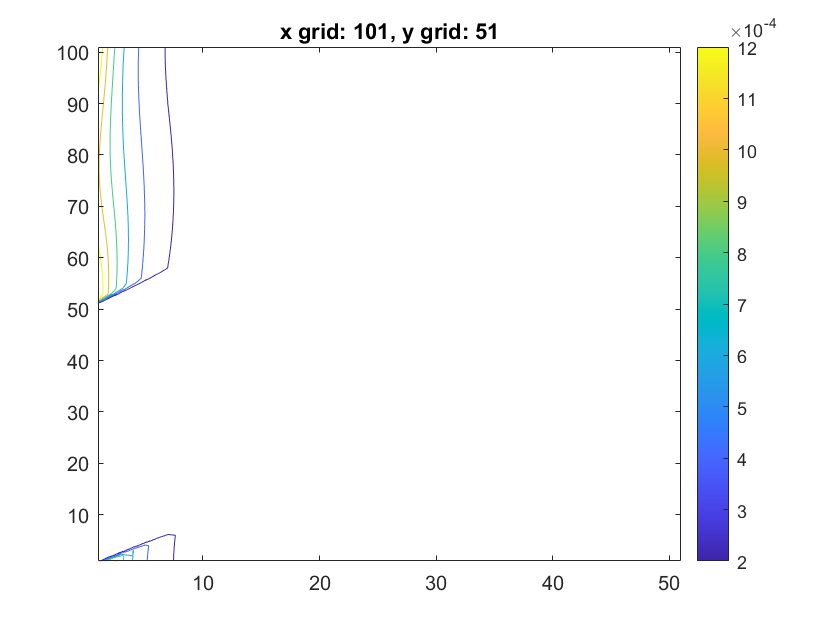
Here we basically show the discrepancy map compared to the ground truth(finer grid).
 |
 |
|---|---|
To our surprise, the difference map isn't symmetric along x or y axis. But as expected, the higher the grid dimension is, the more accurate the results would be.
Extra credits(use FDM method compare )
As required, here we use the FDM method to judge whether the result is relatively right.
As we already know, compared to FEM, FDM is older and is based upon the local Taylor expansion to approximate the differential equations. It has difficulties handling complex geometries(e.g. circles, or places like boundary). But it has less computation cost compared to FEM.
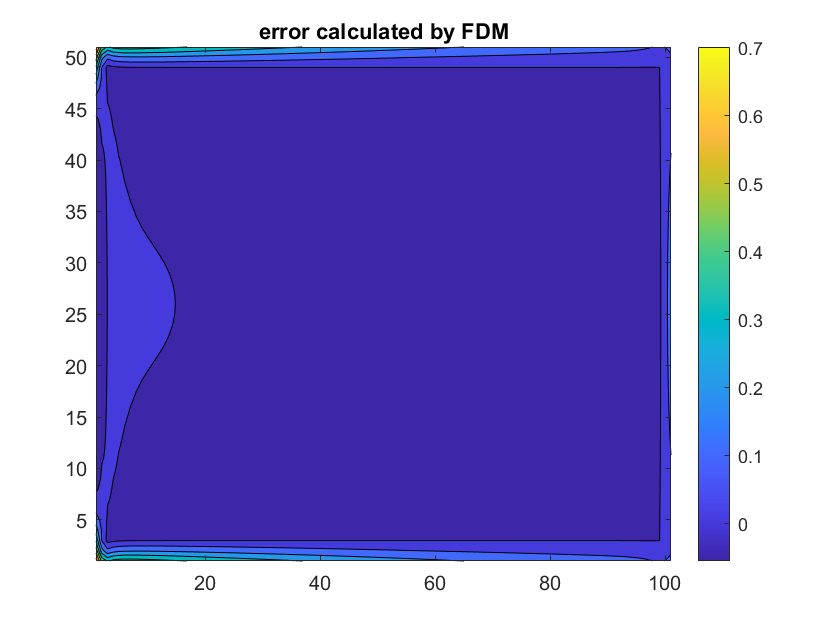
Here we show the difference heatmap between our FEM and FDM results
They are both under conditions of α = 1; D = 1; k = 1 H = 2 and L = 10
As expected, the boundries show a bigger discrepancy, since in FDM the boundries are ill-defined. On the other hand, the left side(where the reaction starts) shows a bit difference. This is probably due to the inaccuracy of the FDM method.
Basically, the results show discrepancies under the tolerance, which justifies the correctness of the FEM results.
Extra Credit 2, non-zero Neumann boundary
In normal setting, we deal with the upper and bottom with no flux boundary conditions. For extra credit, as required, we would like to set the upper as Neumann boundary. See the image below.
For the weak form, we could make some adjustment to the upper boundary elements as below:
So we need adjust for the solver is to add line integral on the upper boundries of the field.
Here we adjust the k and compare the results with Wolfram Mathematica under the same parameters. Here is code in Mathematica to solve the with the boundary condition.
(*define variables*)
d = 1;
k = 16;
alpha = 10;
L = 10;
H = 2;
c0 = 1;
v[y_] = alpha * (H^2 / 4  - (y)^2);
op = d Laplacian[c[x, y], {x, y}] - k *c[x, y] -
   v[y] D[c[x, y], {x, 1}];
cond = DirichletCondition[c[x, y] == c0, x == 0];

sol = NDSolveValue[{op ==
    NeumannValue[0, x == L] + NeumannValue[0, y == -H/2] +
     NeumannValue[k * c[x, y], y == H/2] + cond},
  c, {x, 0, L}, {y, -H/2, H/2}]

Plot3D[%[x, y], {x, 0, L}, {y, -H/2, H/2}]| Our results | Wolfram Mathematica results |
|---|---|
 |
 |
 |
 |
 |
 |
 |
 |
Results and analysis
Here we compare the results when k=0, 2, 4, 16, notice that k is the (first order) reaction rate constant.
When k == 0, our result meets the expectation. Since without the k term, there is no reaction. Here we could visualize a steady flow through the channel(the reason why our result seems not like a flat plane is because the numerical precision).
When k starts to become larger, we could see that the flow concentration starts to drop more and more quickly. Note that we set the upper boundary(y == 1) as a non-zero Neumann boundary, so the fluid tends to leak(react) through the upper boundary. So the flow drops more quickly in the upper boundary.
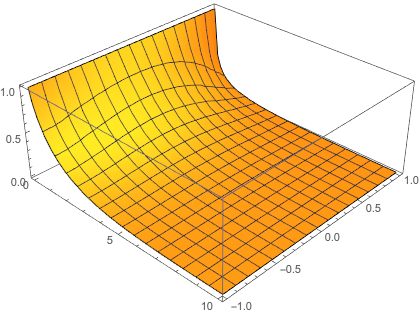
When k == 16, we could see that the results between two solver start to diverge(especially when x == 0). But we think Mathematica has something wrong with the solver setting and our solver seems to be more stable and reasonable since the boundary condition on the left hand side(x == 0)should be hard code to 0. And also intuitively there shouldn't be a steady plane at the start of x-axis.
So we took a further step on Mathematica to see how k would influence the results.
We found that when k >= 4.25 , the incorrect-x-axis-boundary results emerges. In the mean time, our solver seems to be still stable.
k = 4.25 |
k = 5 |
k = 8 |
|---|---|---|
 |
 |
 |
Conclusion
In this project, we use FEM to solve a laminar flow in a rectangular channel with Dirichlet and Neumann boundary conditions.
- FEM Computationally expensive but more accurate compared to FDM.
- Compared to FDM, the cost lies in
- the assembling the
Kmatrix, which depends on several near points(in 2D is4). - The bandwidth of
A(Ax=b) comes larger for FEM, so that solving the linear equation takes relatively more time.
- the assembling the
- Compared to FDM, the cost lies in
- FEM error mainly contrate on the upper left and bottom right in our cases.
- This is probably due to at the very beginning, the concentration is high and Reynold number is relatively high(which depends on density).
Code
Github link
Reference:
http://users.metu.edu.tr/csert/me582/ME582%20Ch%2003.pdf
