First you'll need to find your Anki (v2) collection.
- Tools > Add-ons > Open add-ons folder (or "View Files")
- Navigate a folder up (to the
Anki2directory) - You should see a
/User 1/collection.anki2file
Alternatively you can find it on your filesystem:
- Windows C:\Users\Administrator\AppData\Roaming\Anki2\User 1\collection.anki2
- Mac /Users/USERNAME/Library/Application Support/Anki2/User 1/collection.anki2
Once you've found this file you drag and drop this DB into Anki.Vision.
The data from your collection will be stored locally in your browser until you clear your cache or hit the Reset button.
The current version of Anki.Vision has a few presets to demonstrate the different charts available.
You can also customize a query:
- Graph Settings Currently just lets your change which graph is shown. In future versions there will be unique customizations for each graph type. See screenshots below for graph types
- Data Select one or more data types to be shown on the graph;
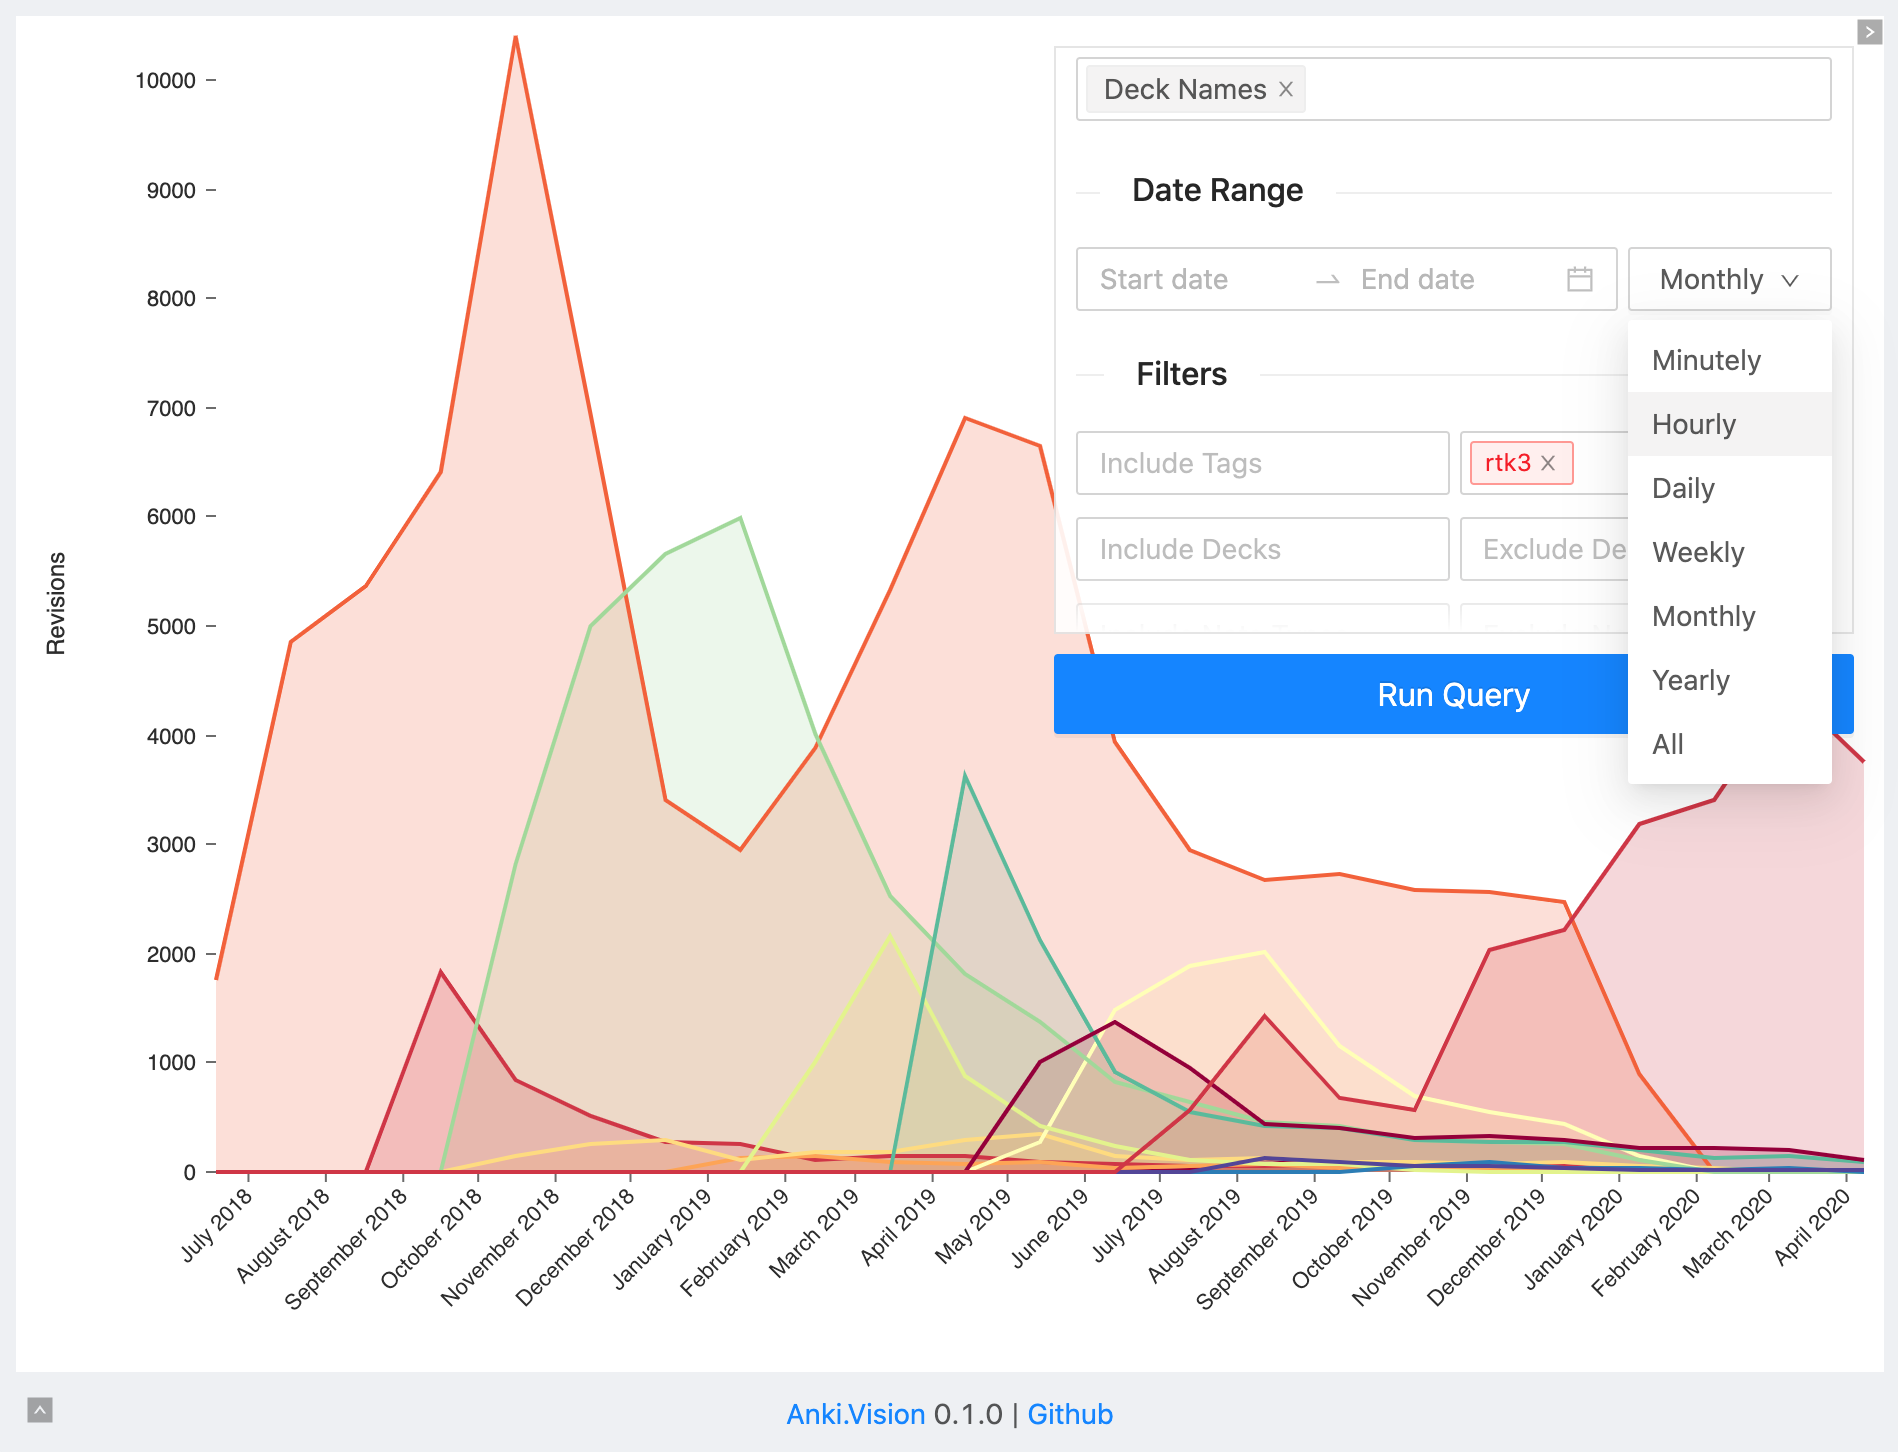
- Date Range Start and End Dates to limit your results (either be left empty)
- Time Period Resolution of your results; Daily, Monthly, Yearly, etc. Be careful not to set too small or you might run out of WAM!
- Filters You can include or exclude specific types from your results
- Tags (for tags, you can manually type out a fuzzy search)
- Decks
- Note Types
- Export Query Data
- Card explorer and card specific stats to help identify tricky cards, etc.
- More graph types
- More graph config options
- Dark Mode
This project was partially motivated by the enjoyment of learning new technologies, the major libraries that helped create Anki.Vision are:
- React
- Next.js
- Typescript
- SQL.js
- TypeORM
- Nivo.rocks (it does)
Currently the codebase is very alpha and needs a bit of refactoring, but if you're ready to dive in feel free to contribute new graphs and stuff.


