IreneVDB / was-het-donker

Heatmap showing monthly sky brightness and moon phase created for "Was het Donker?", a citizen science project in The Netherlands to monitor light pollution

Geek Repo:Geek Repo

Github PK Tool:Github PK Tool

Was het donker?

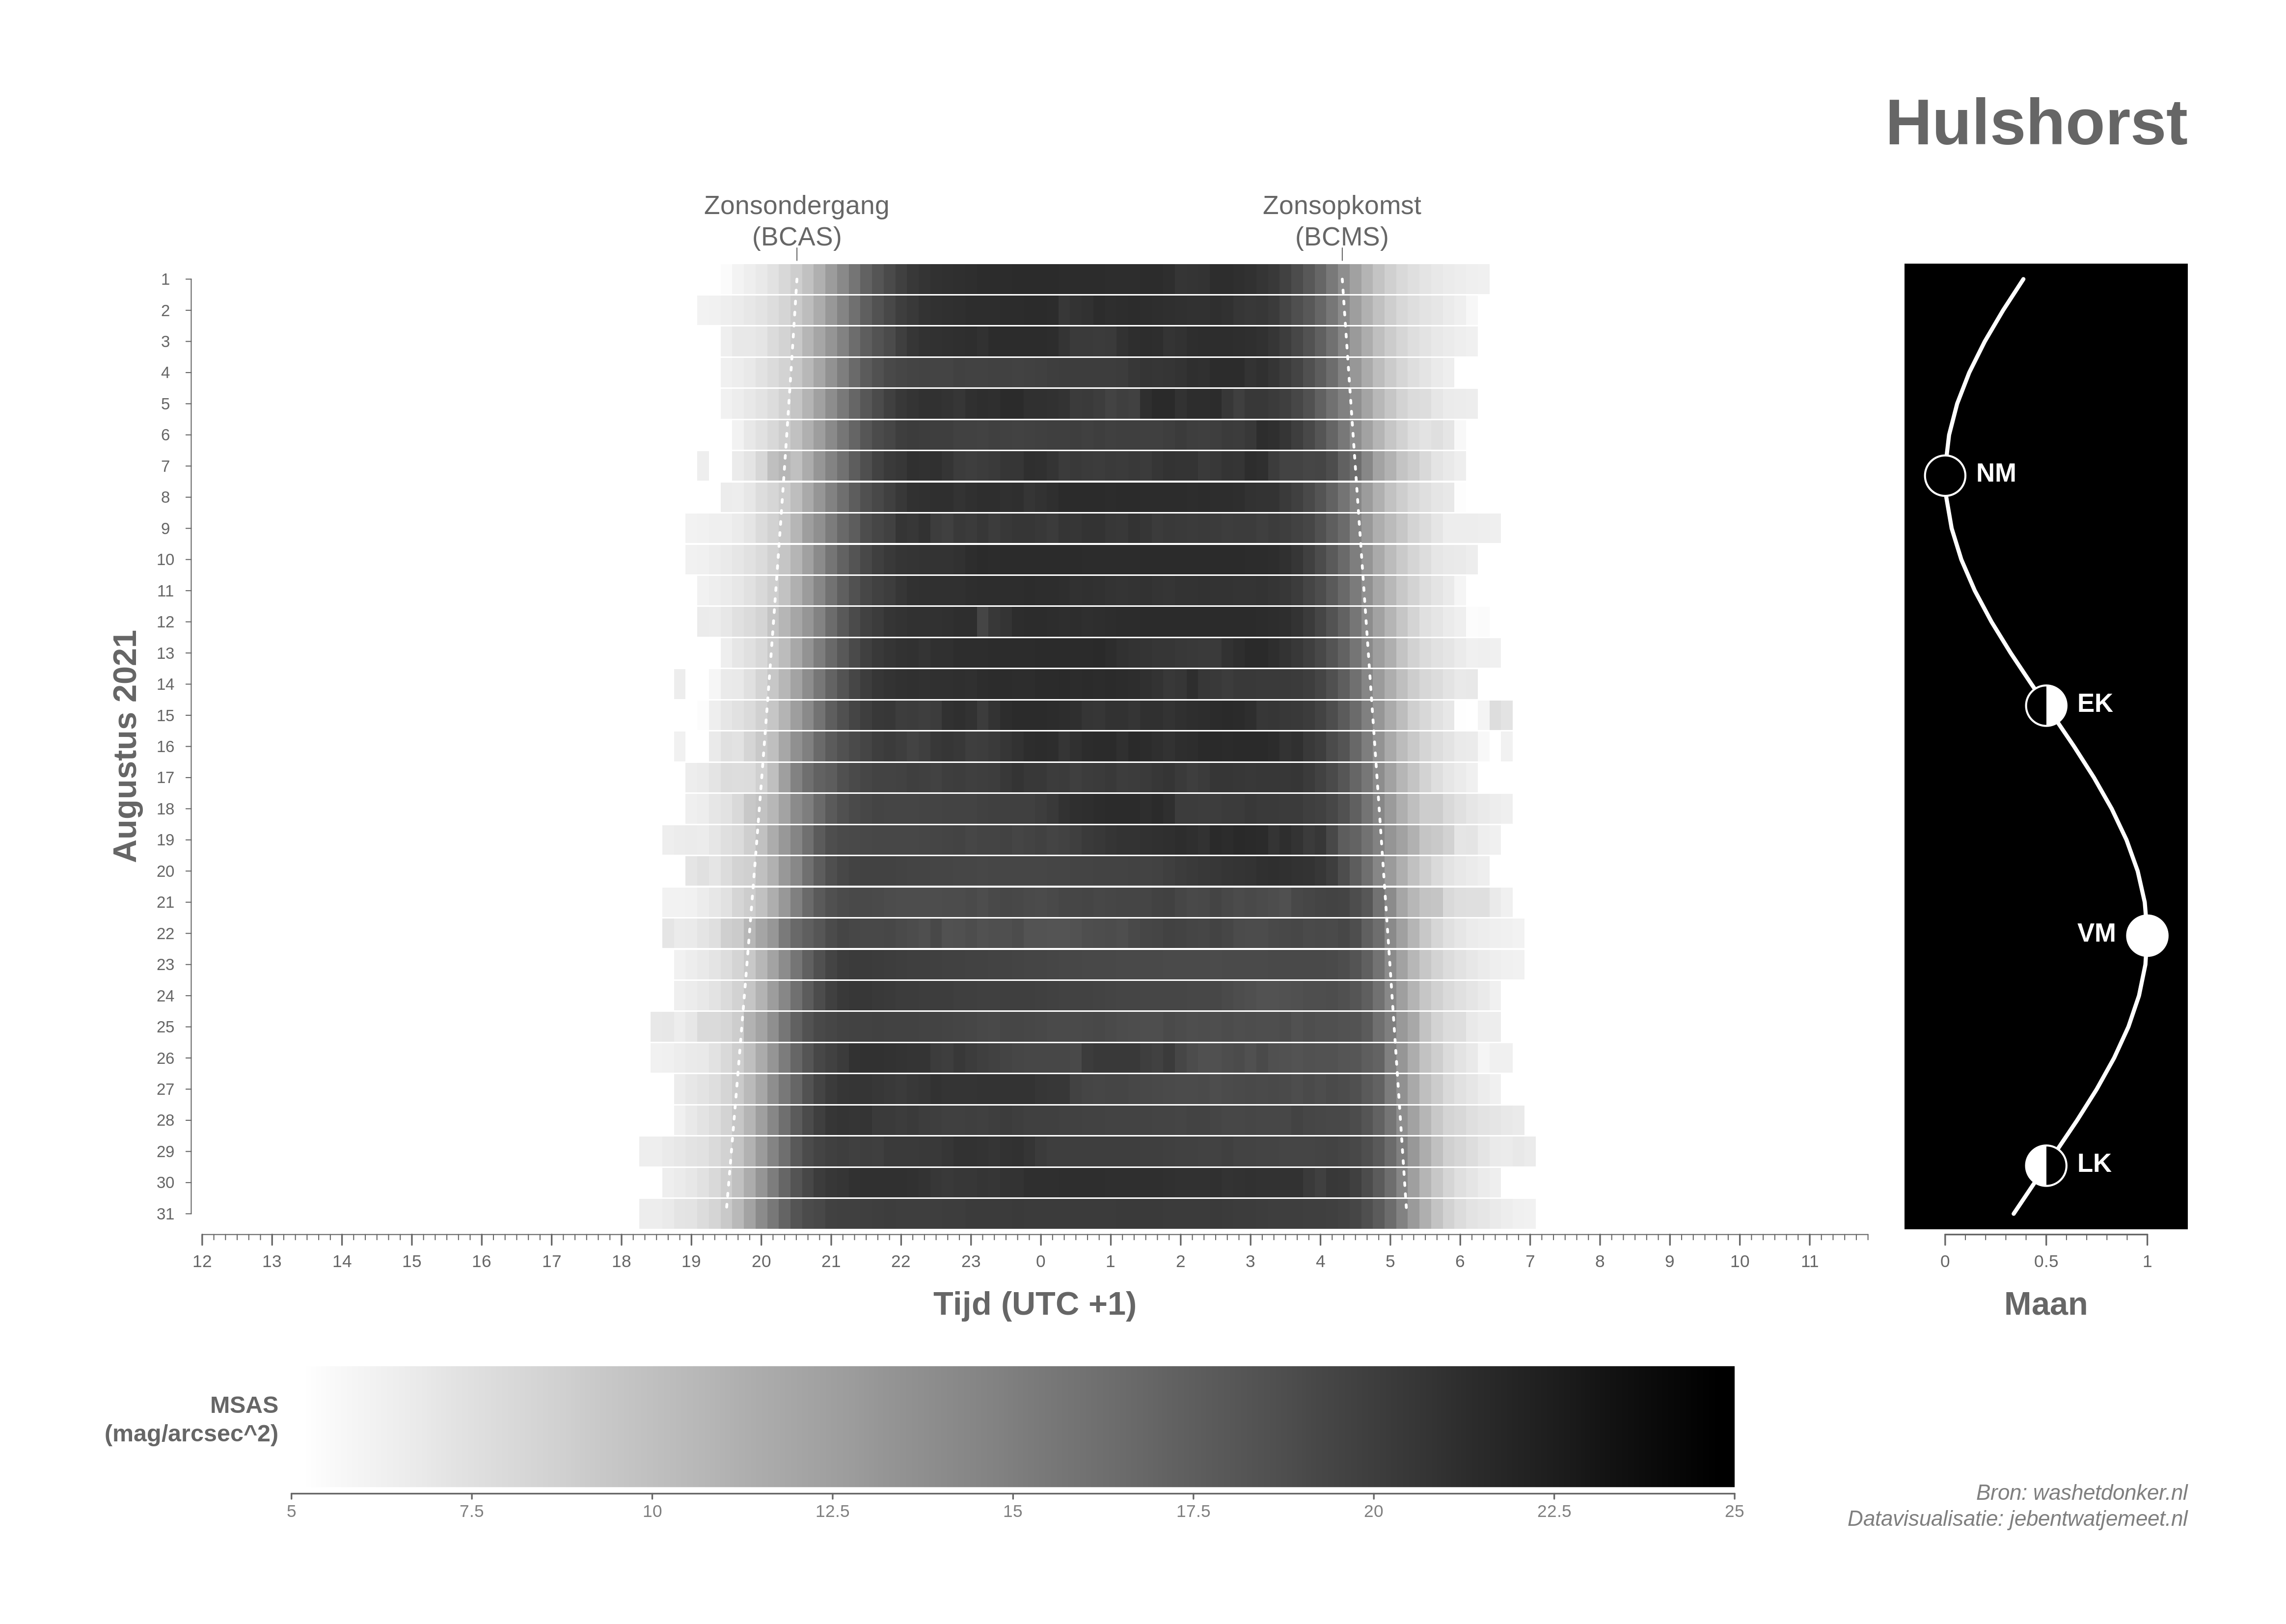
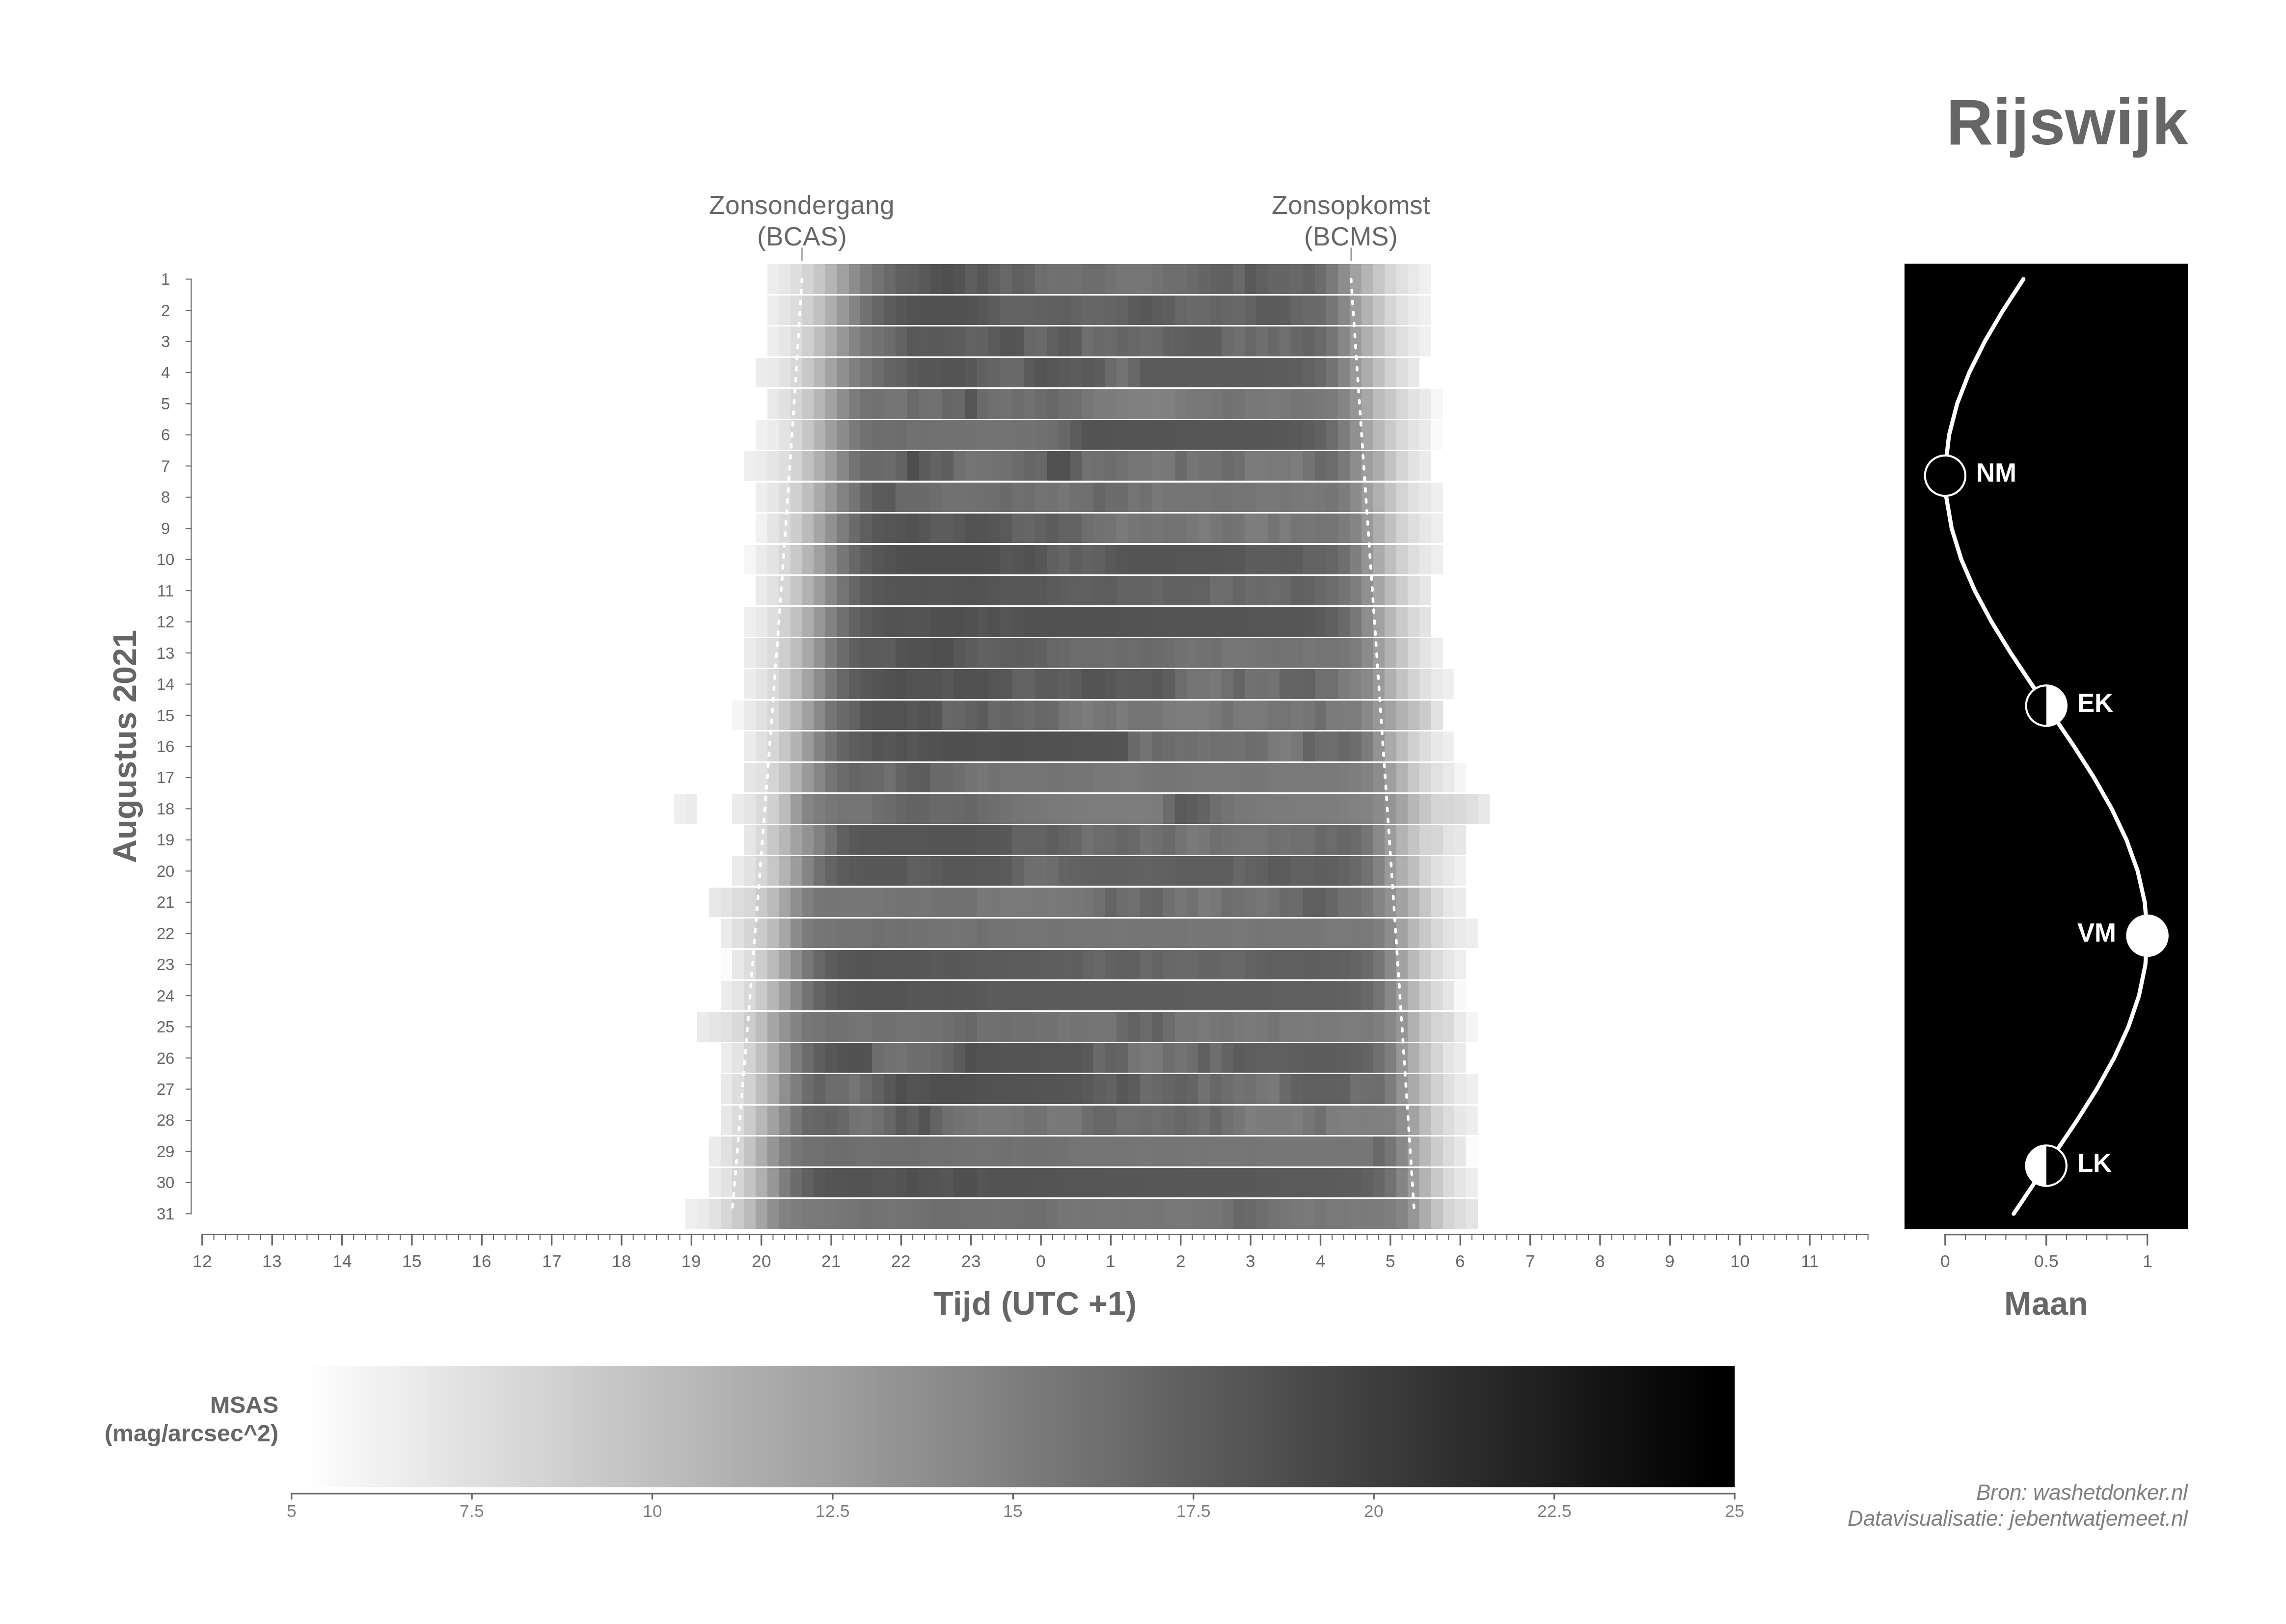
Heatmap created for Was het Donker?, a citizen science project in The Netherlands to monitor light pollution. The visualization shows the monthly sky brightness and moon phase for the various Sky Quality Meters (SQM).

All monthly visualizations can be found on the Washetdonker website

Some examples:


Hulshorst (my back yard 🏡)

Air Brightness in Hulshorst Aug 2021


Rijswijk (urban area with greenhouses 🌃)

Air Brightness in Hulshorst Aug 2021


Vlieland (rural area on sparsely populated island 🌌)

Air Brightness in Hulshorst Aug 2021

About

Heatmap showing monthly sky brightness and moon phase created for "Was het Donker?", a citizen science project in The Netherlands to monitor light pollution


Languages

Language:R 100.0%