Path: https://github.com/Image-Py/gistool
Version: 0.1
Author: YXDragon
Email: yxdragon@imagepy.org
Keyword: gis, modis, rs
Description: a toolkit developed for gis image processing
you must fill the information upon, and you can not remove or insert line, you can write free below.
ImagePy is an image processing framework developed in Python. We can extend it with plugin esaily, This project is a toolkit developed for sea ice rs image processing. Please install ImagePy first, then use Plugins > Install > Install Plugins then input this project's git address. Enter, then ImagePy will install this toolkit automotely.(maybe the gdal lib will got some trouble, please use whl here)
Paper About ImagePy on Bioinformatics:
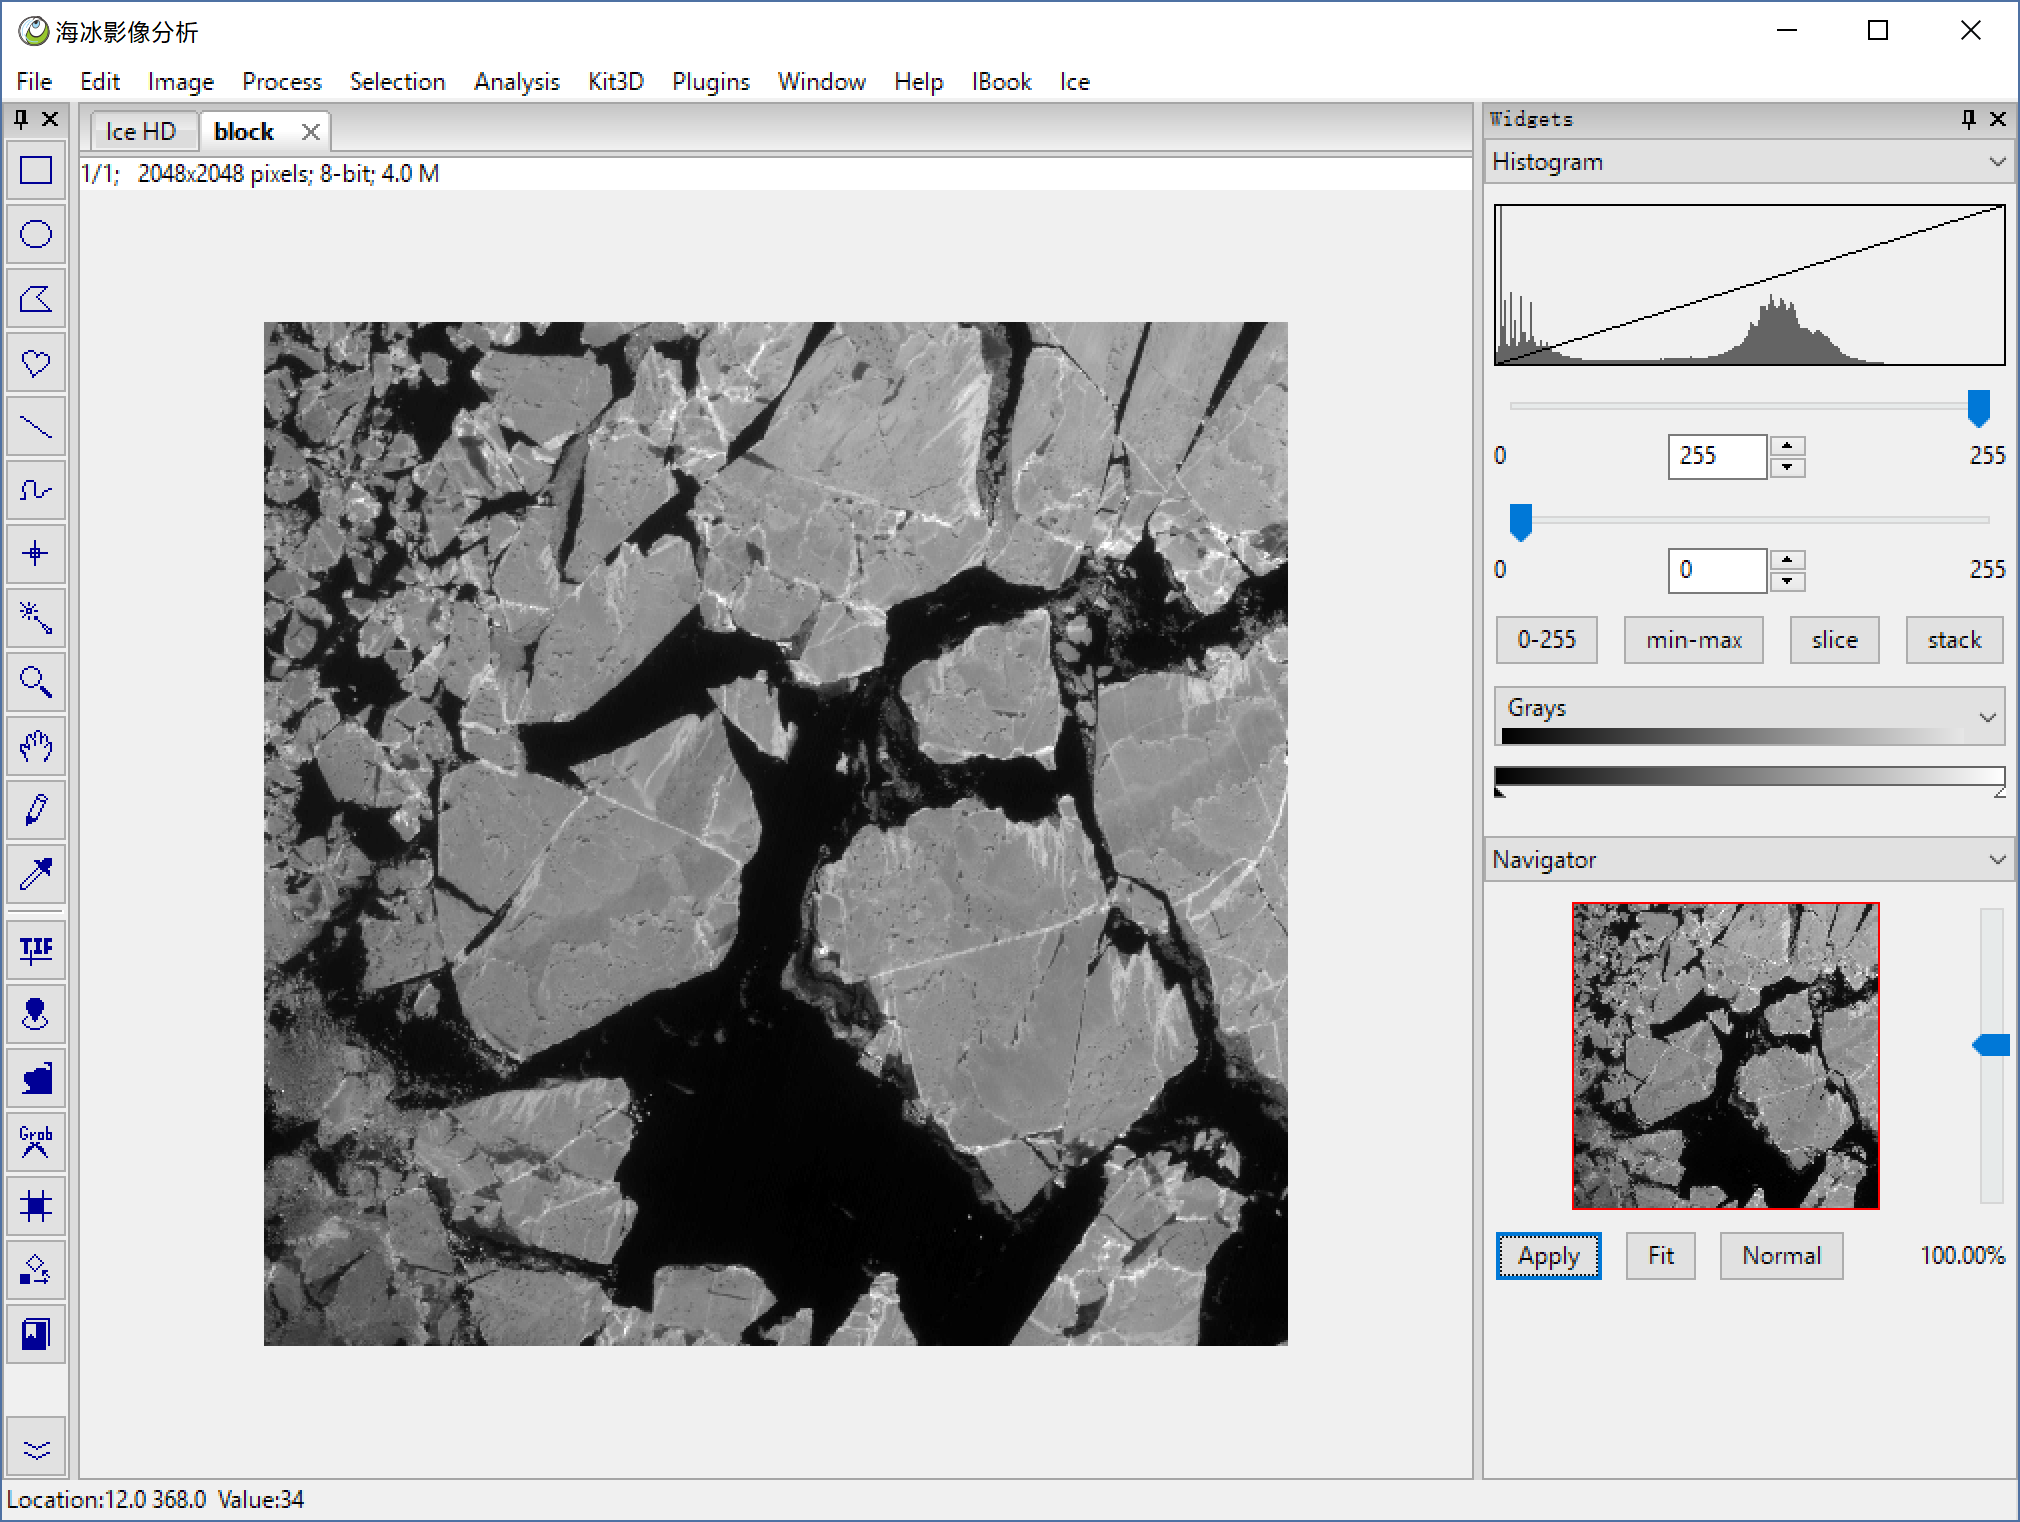
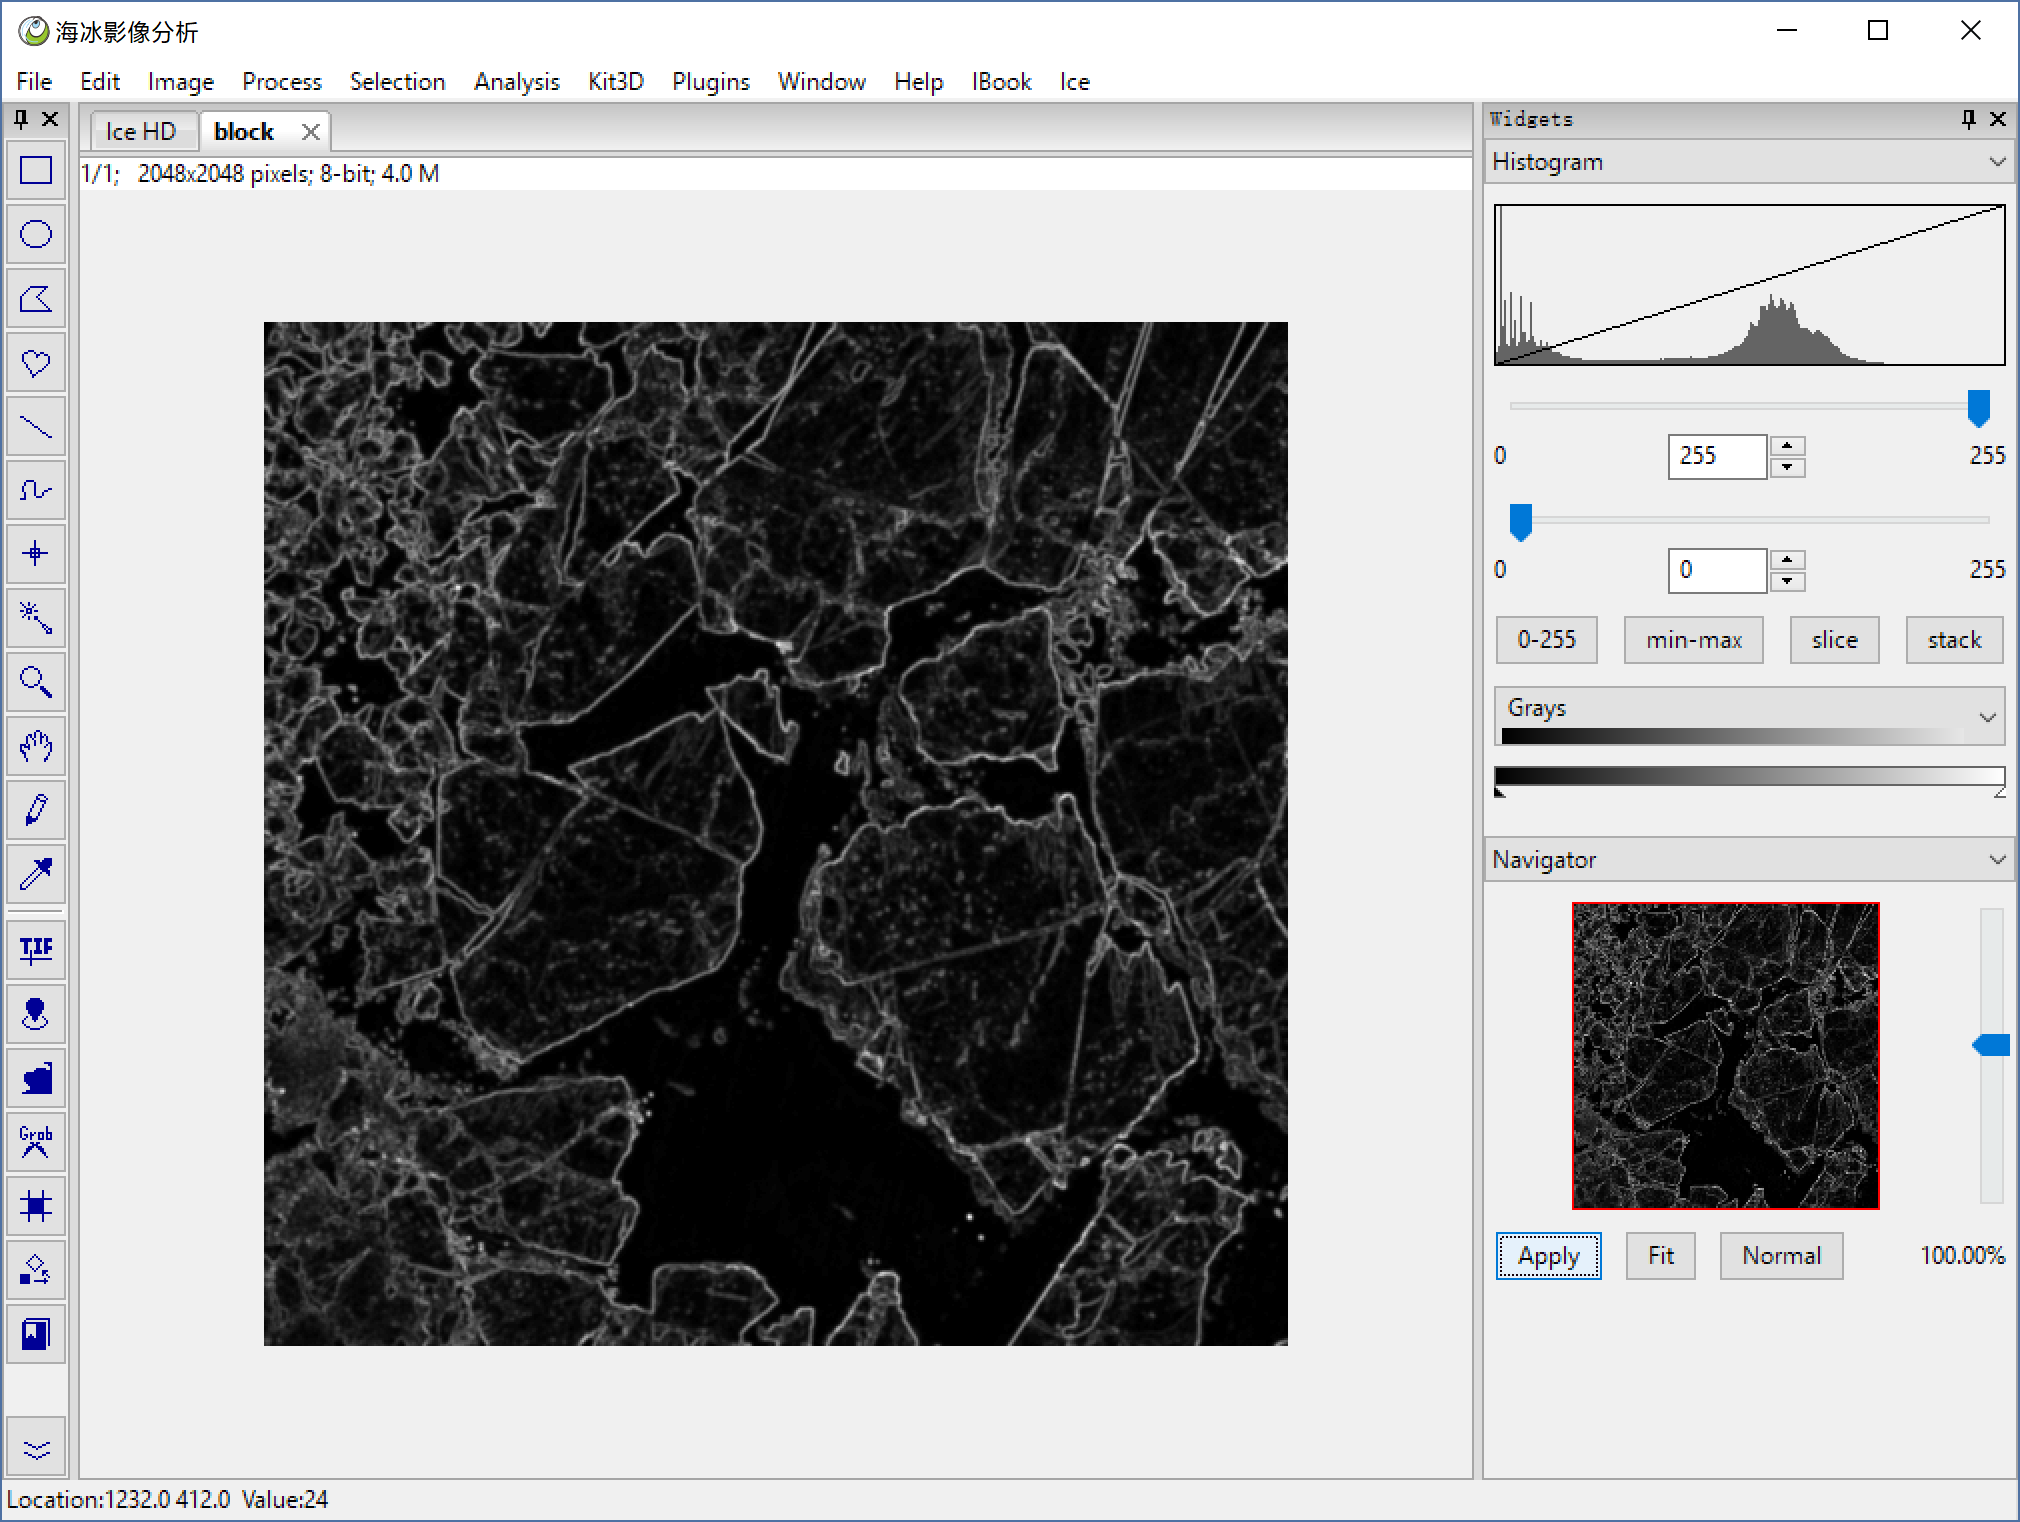
This is a HD RS Image, Now we try to segmet it from each bright line and recognise each fragment is water or ice. You can follow the method below, And you can also use Ice > HD Segment Demo, you can got a macros like an animation.
File > Open to open a HD sea ice image, or you can use Ice > HD Ice Image to open our demo image below.
Process > Filter > Sobel direction=both, then we got a edge gradient image.

Process > Filter > Gaussian sigma=3, do a gaussian filter to smooth the gradient image.
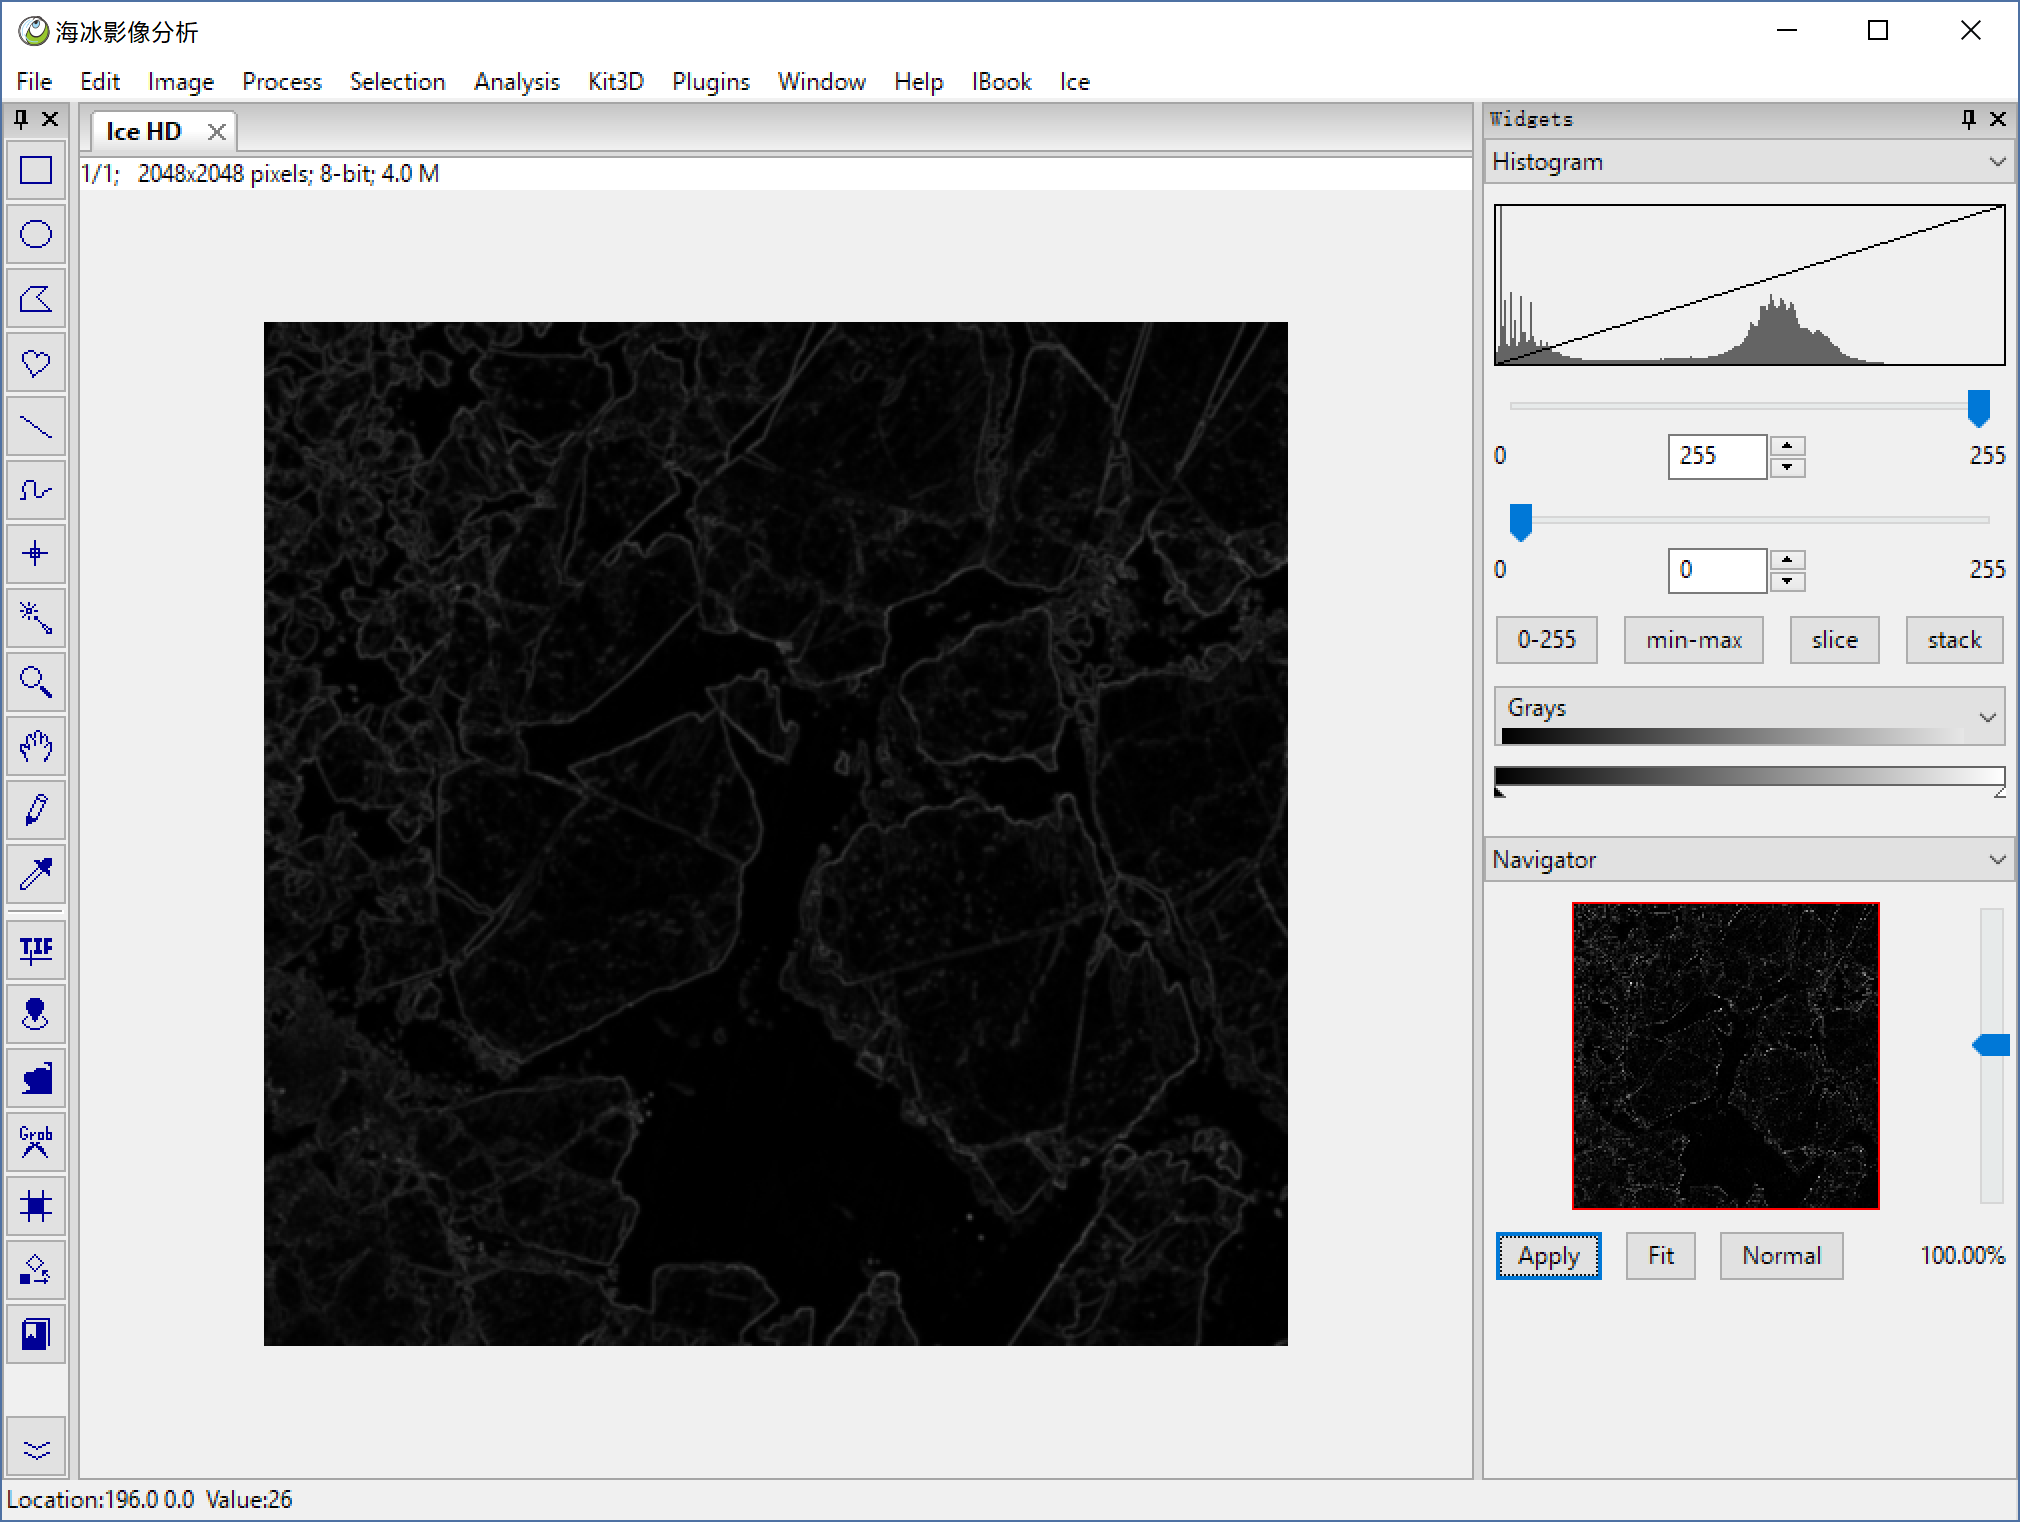
Process > Math > Multiply multiply 3, bright the image.
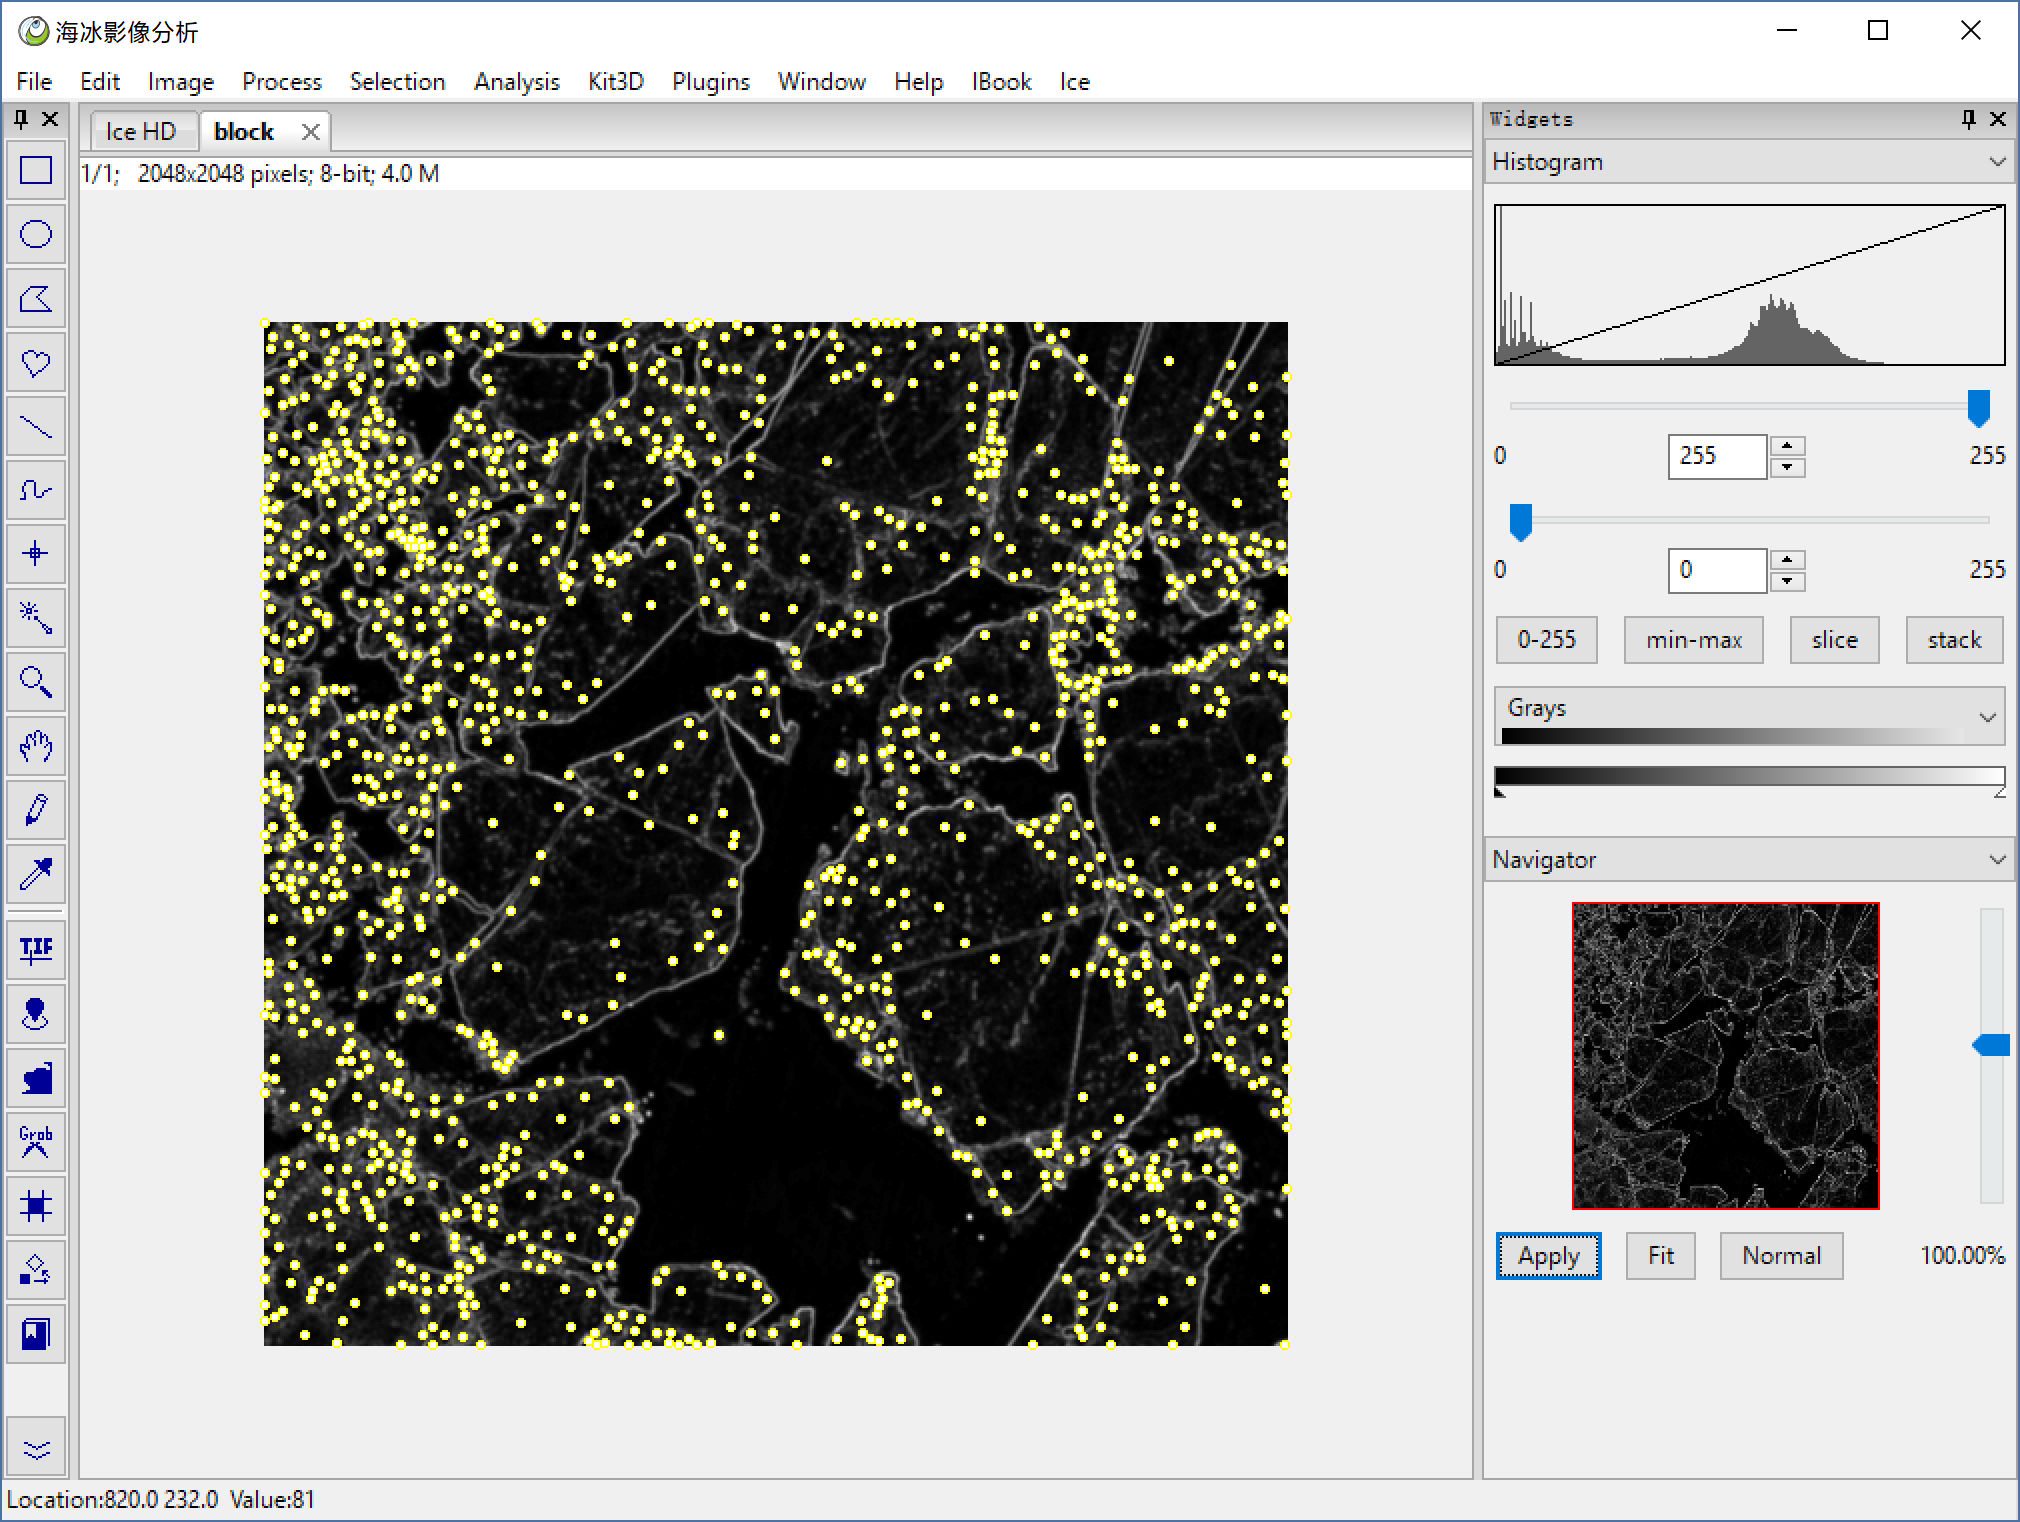
Process > Hydrology > Find Minimum tolerance=10, find the local minimum, and use this points as rood for watershed.
Process > Hydrology > Watershed With ROI got the watershed edge.
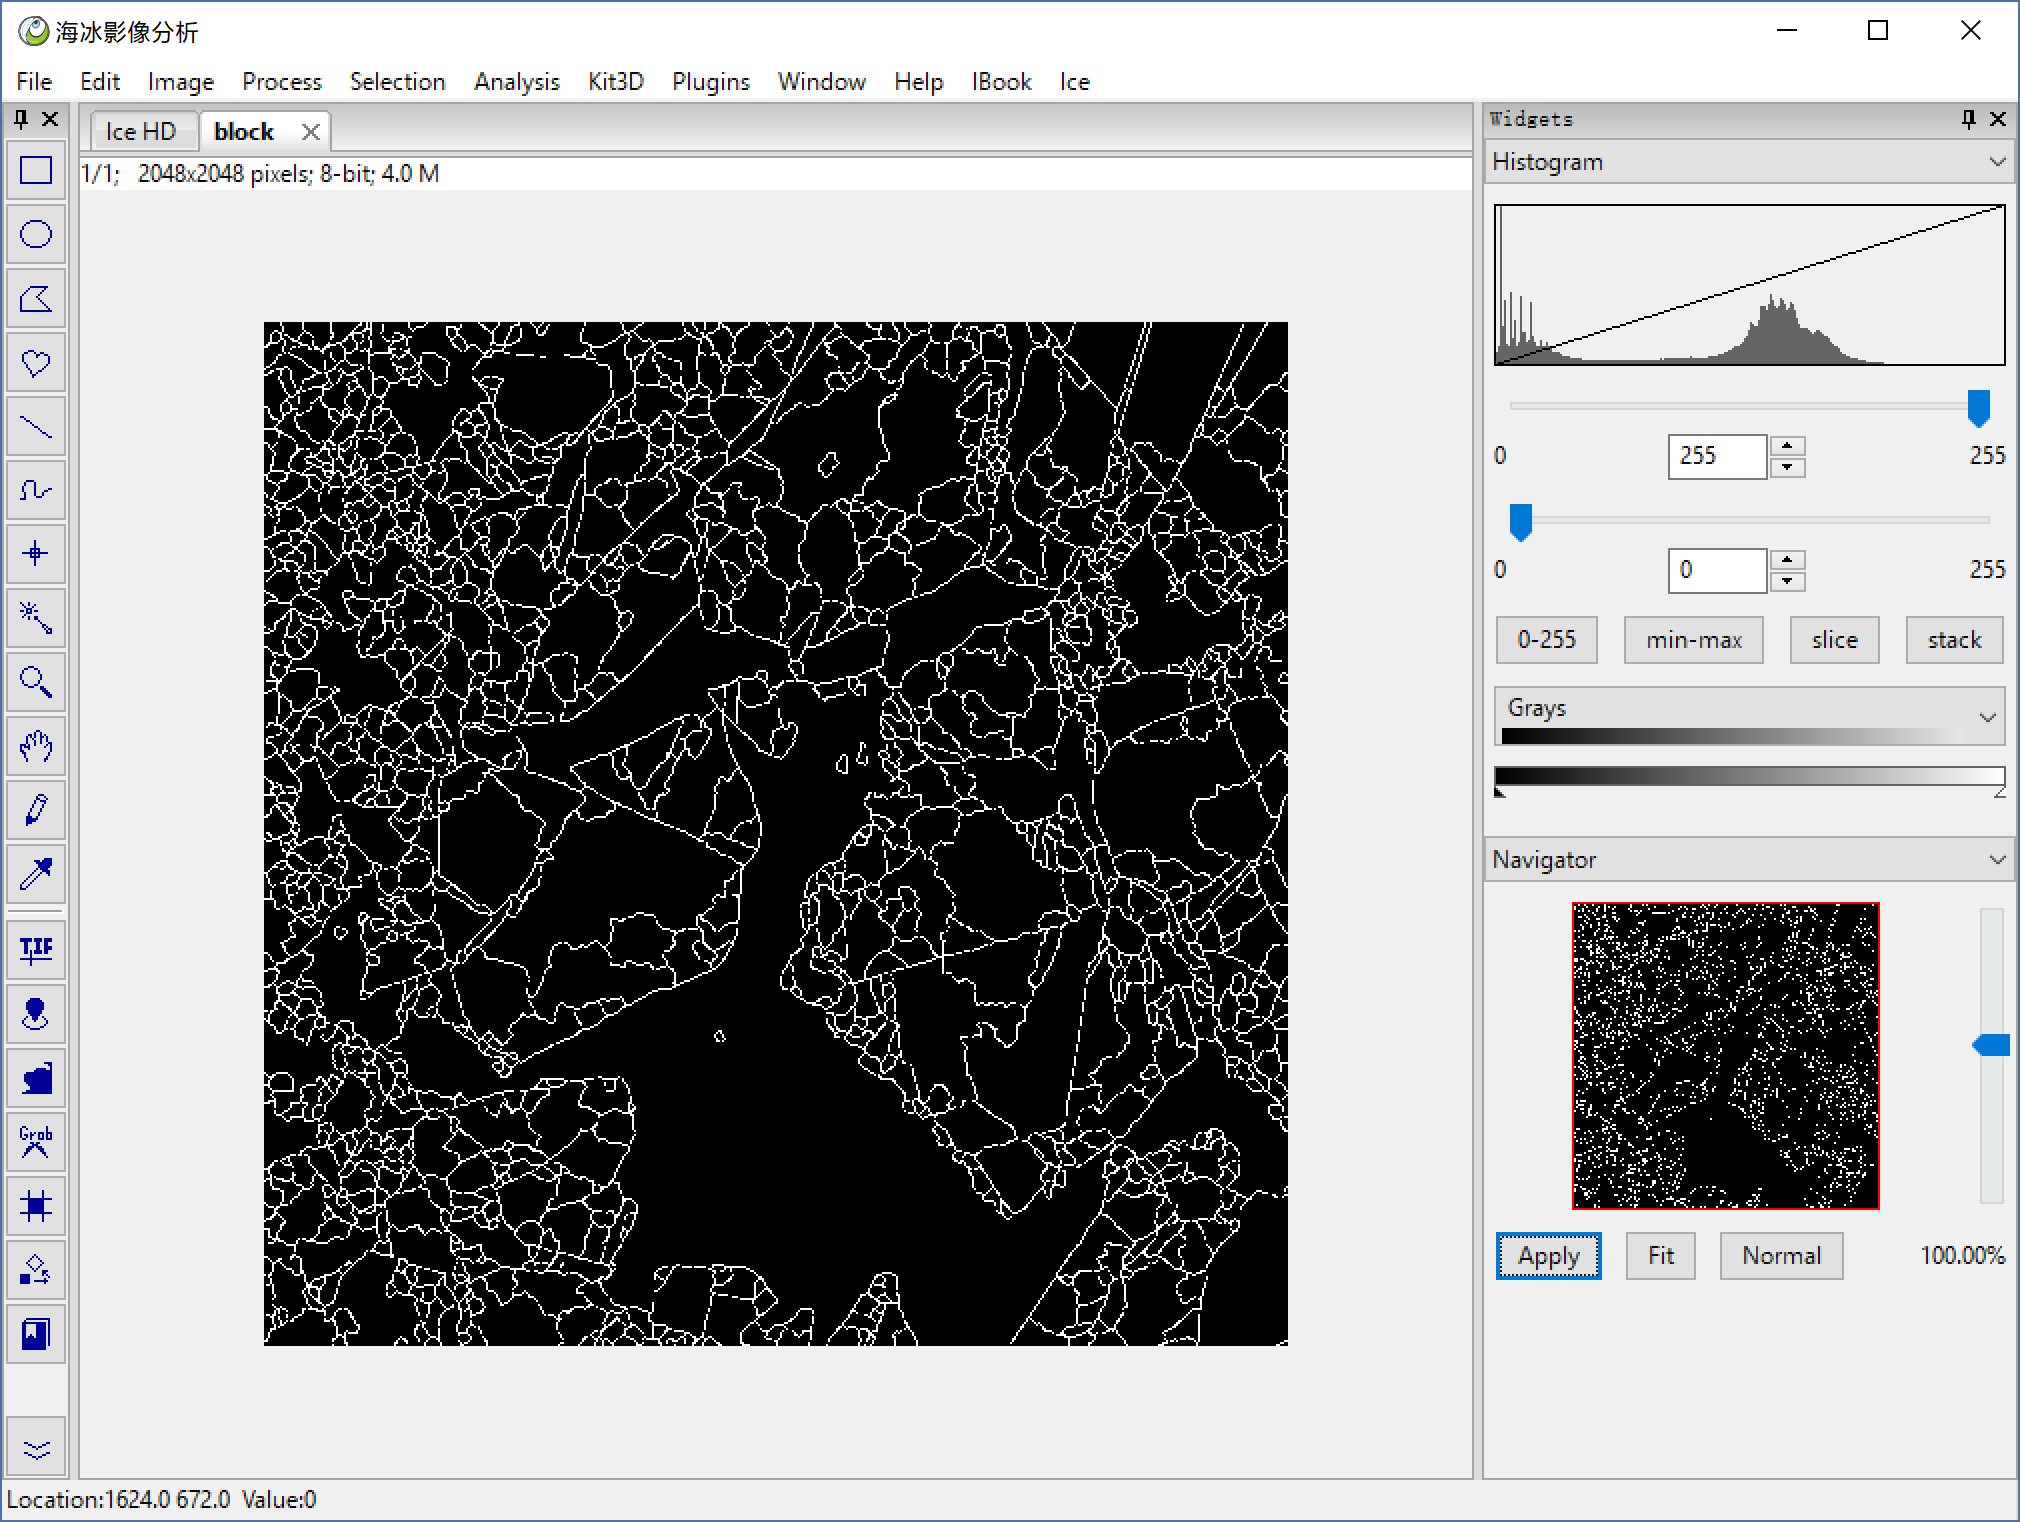
Edit > Invert invert it then the region are in white.
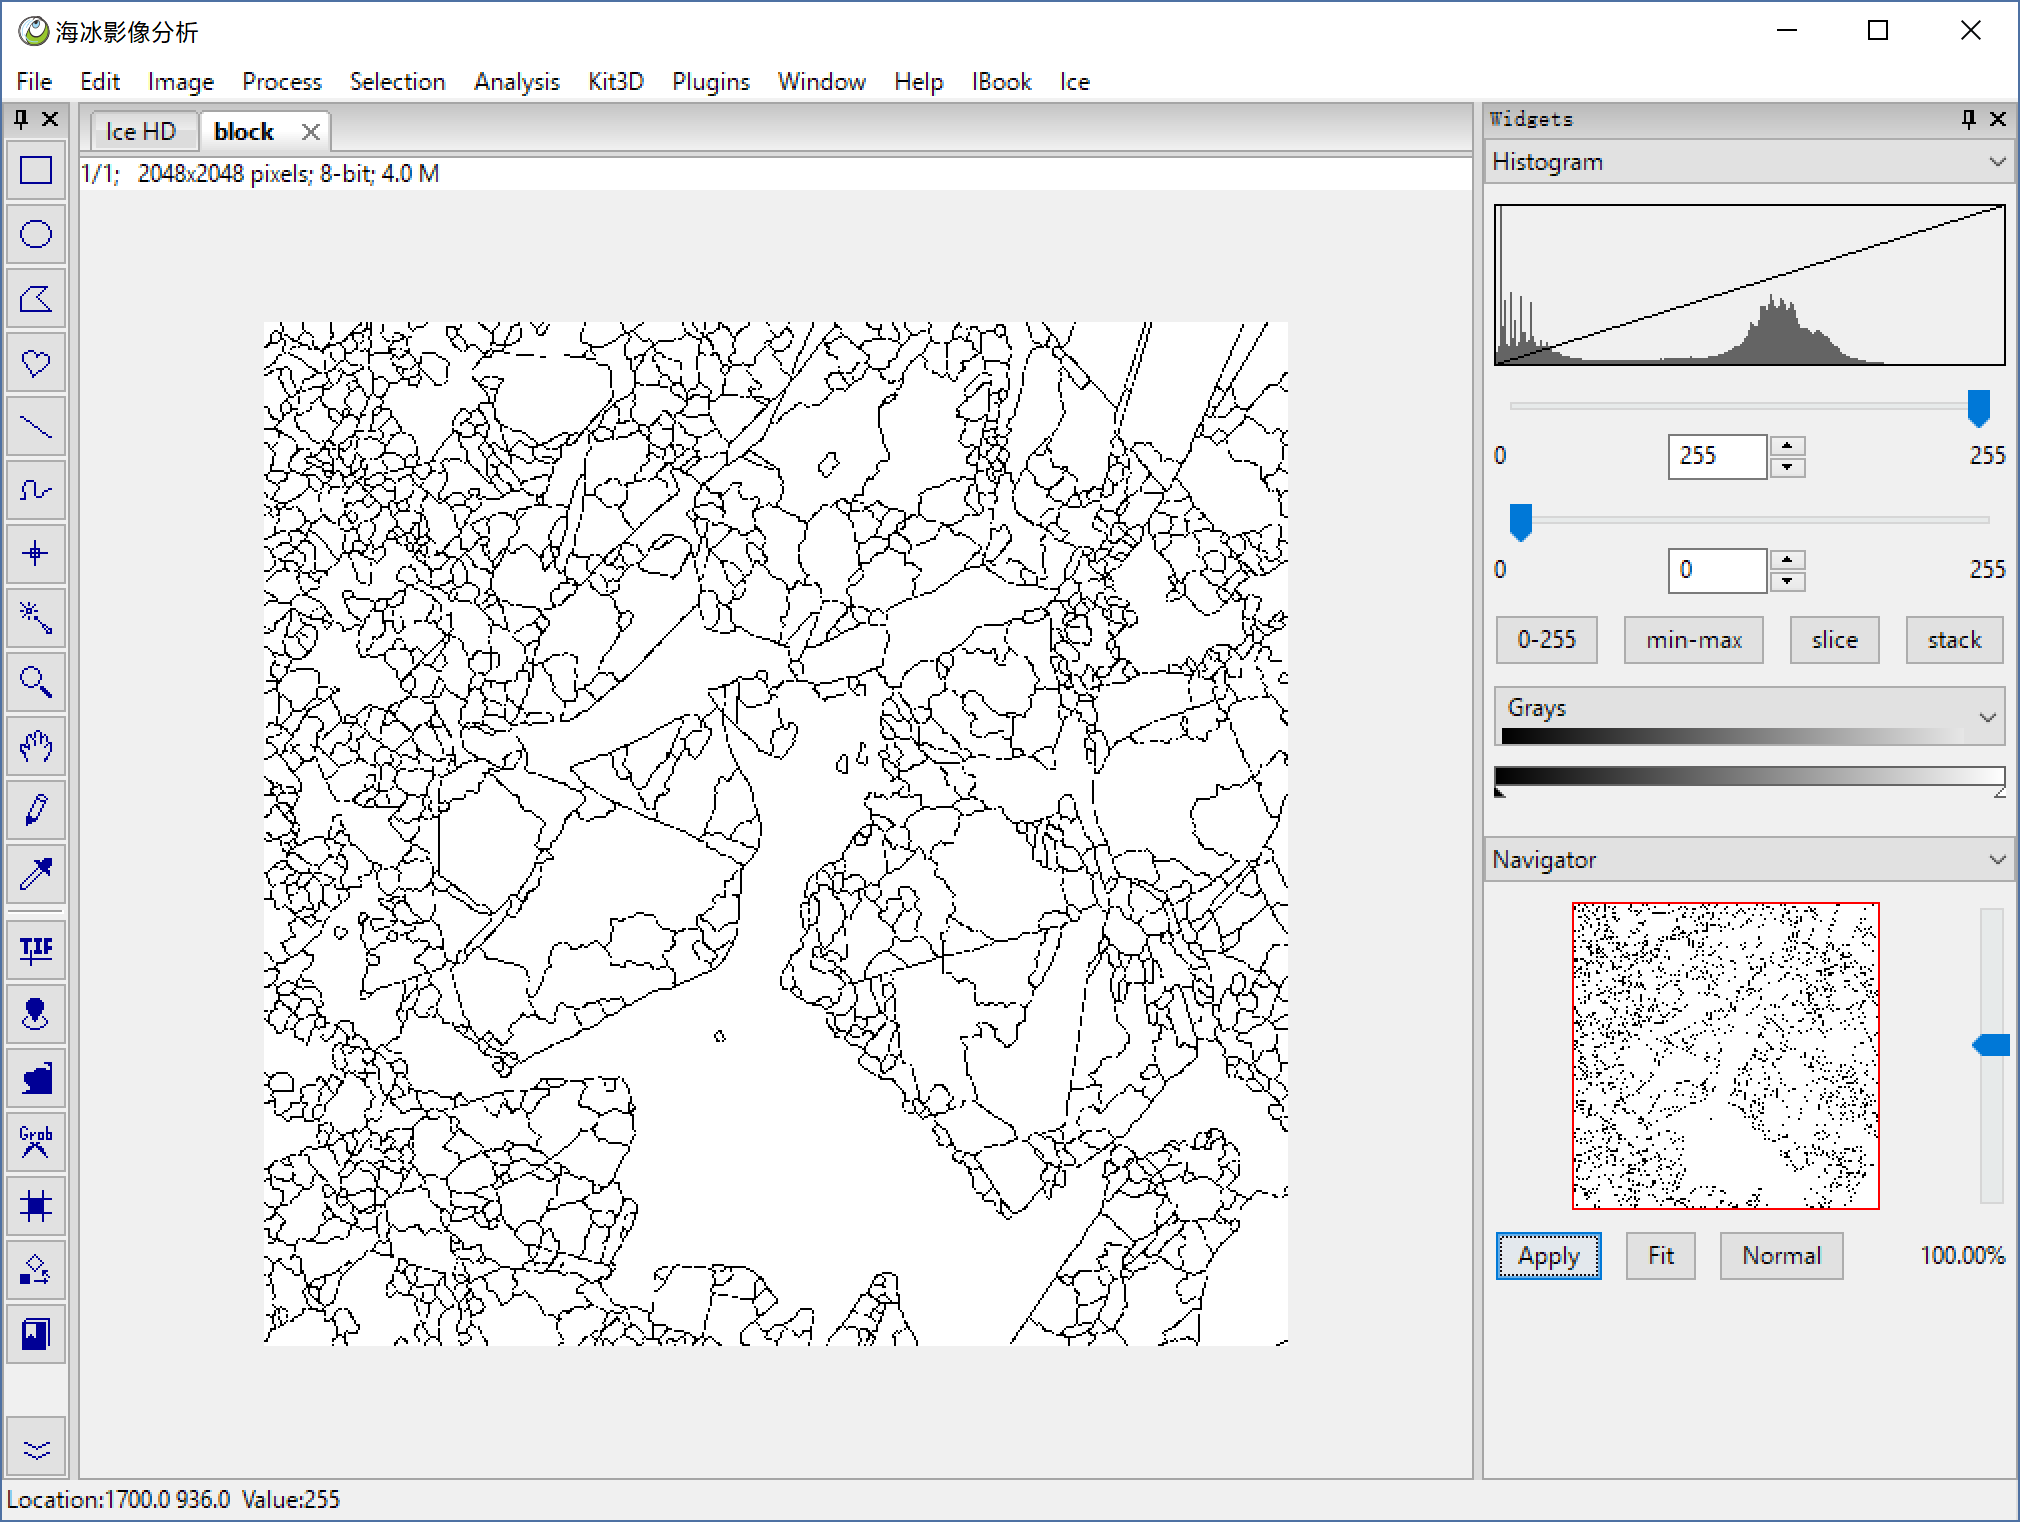
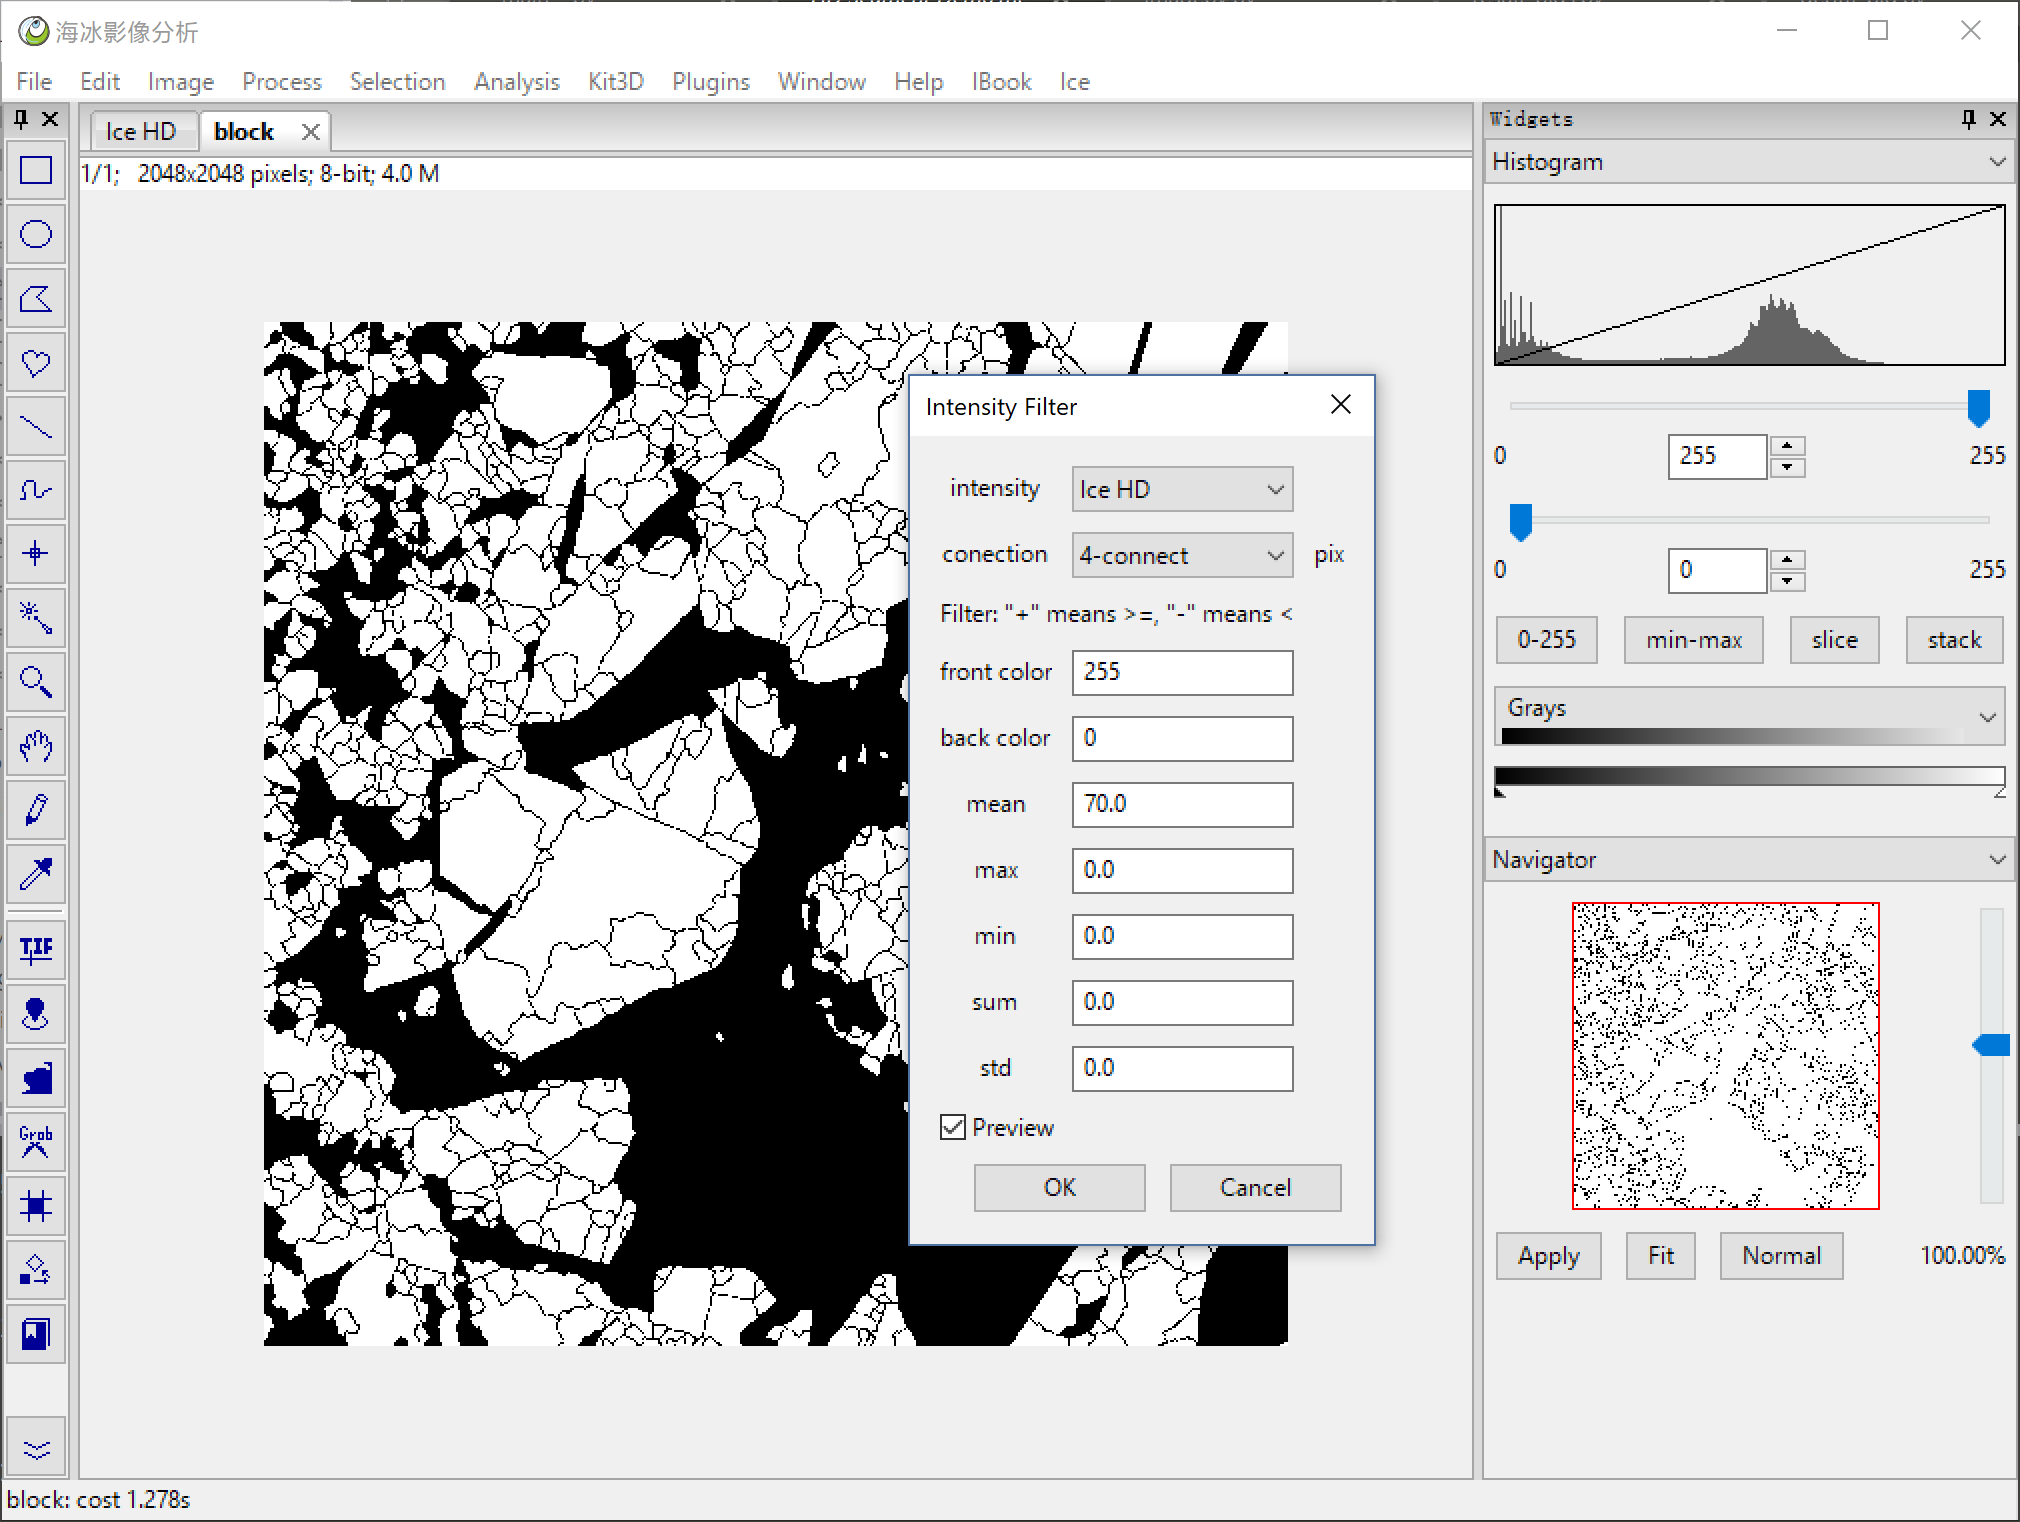
Analysis > Region Analysis > Intensity Filter use the segmentation image as result, and do a Intensity Analysis with the original image, because the ice is brighter then water, so we use every fragment's mean value to check if it is ice.
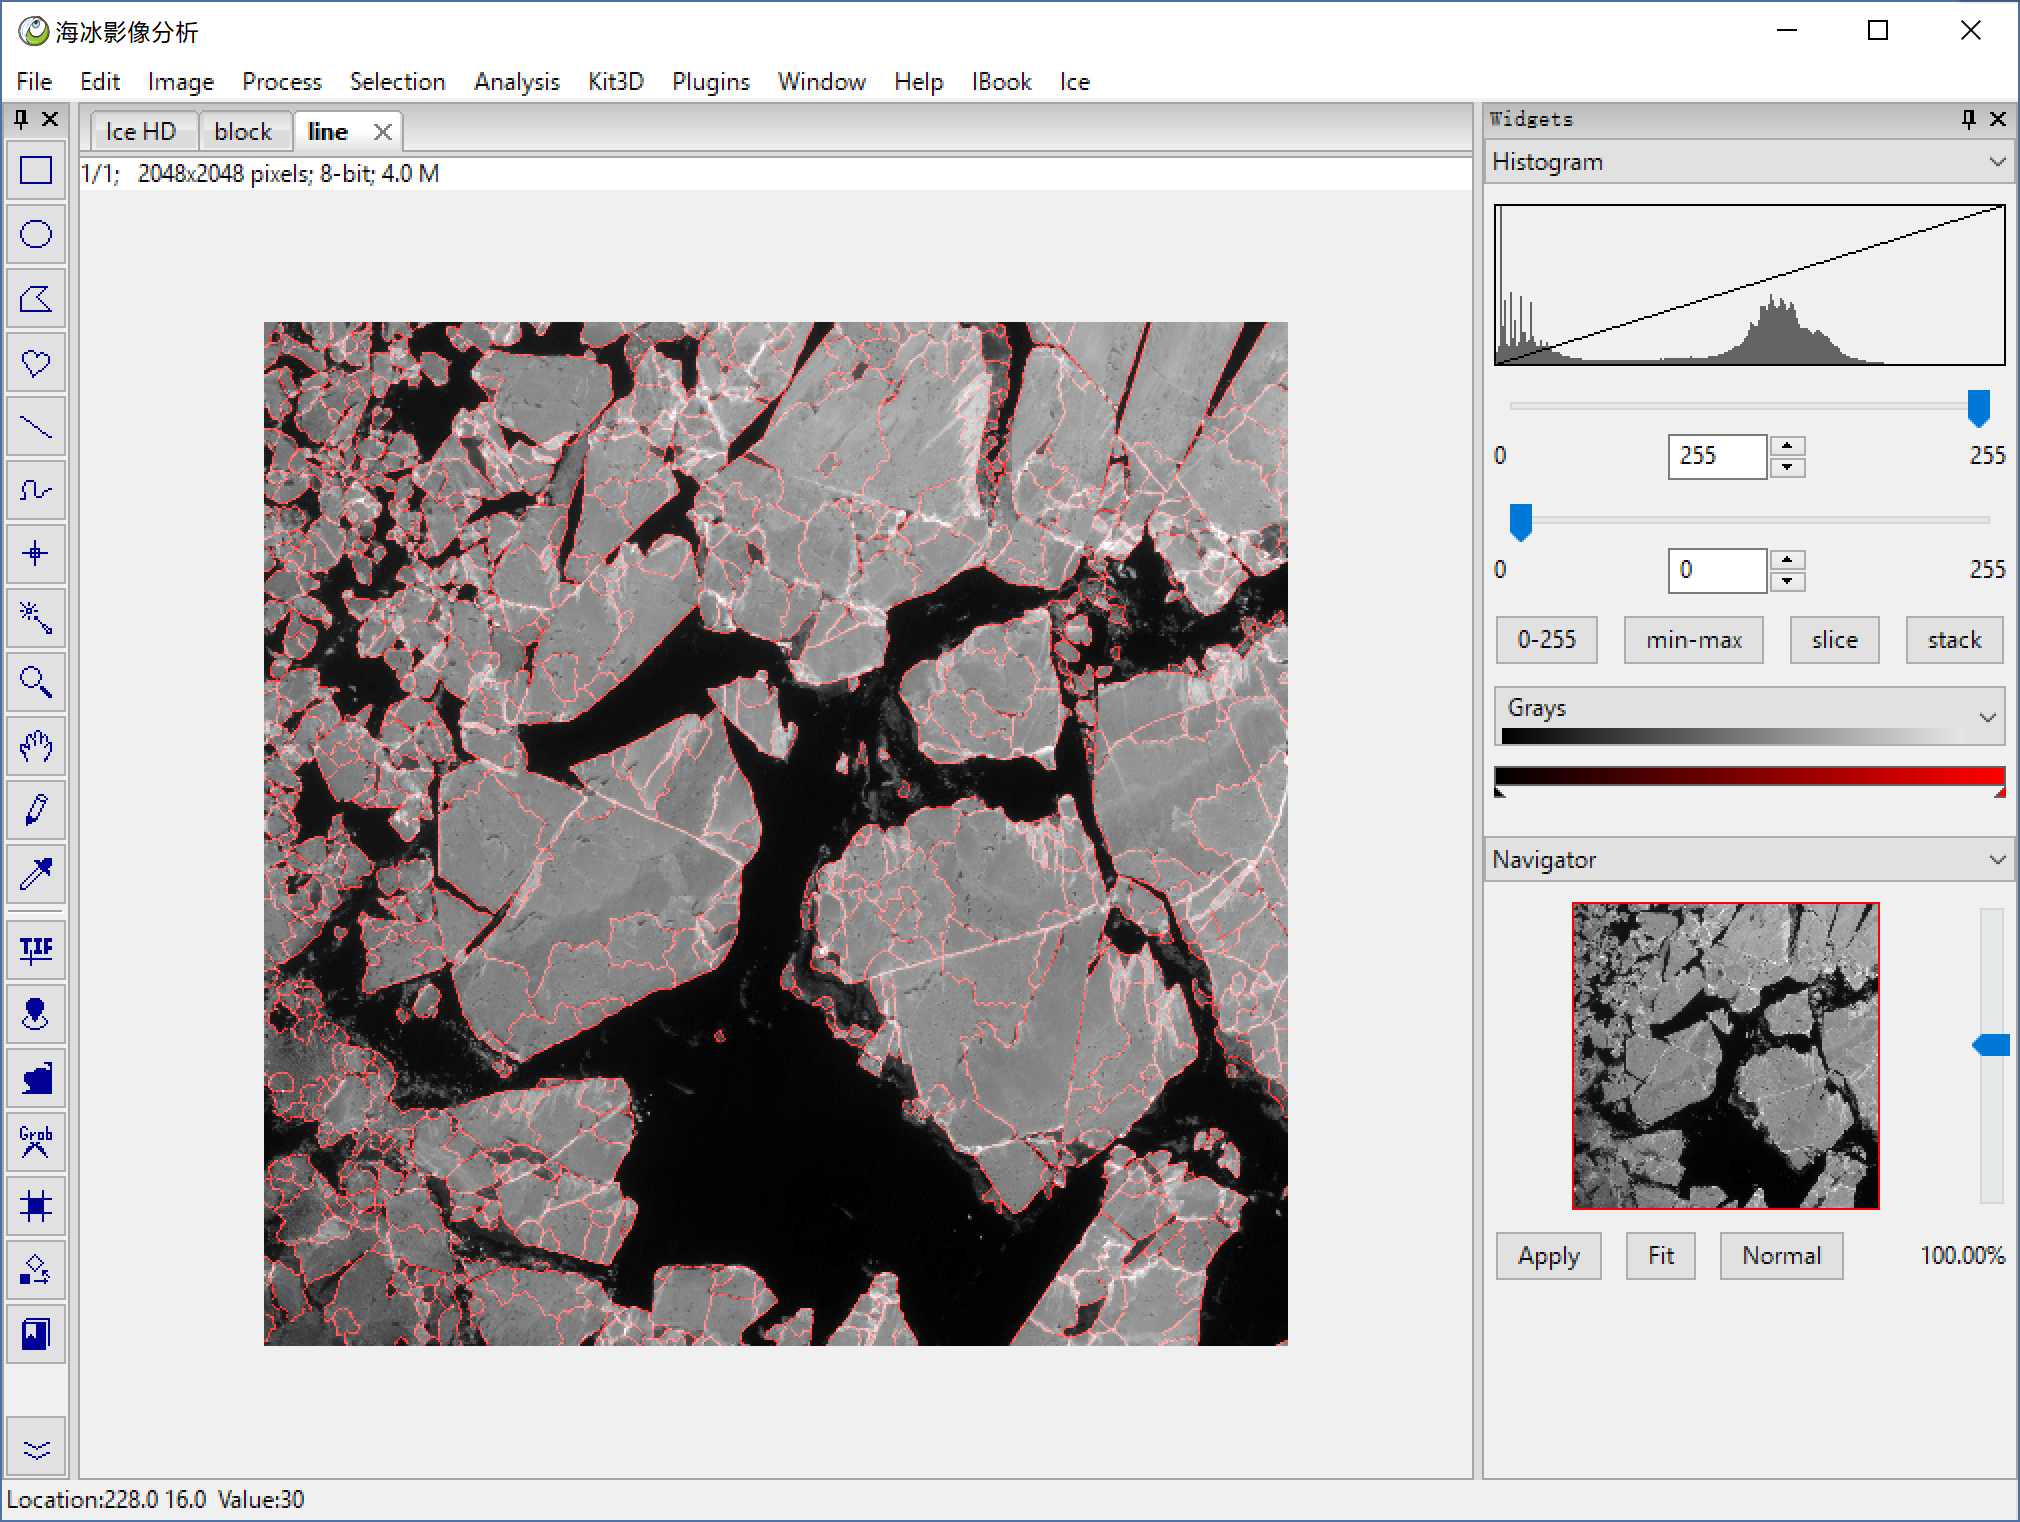
then overlay the line on the original image, and set a color map, we got the result below. And we can also export the result as a gif animation. ImagePy can do these esaily, but it is not our key here.
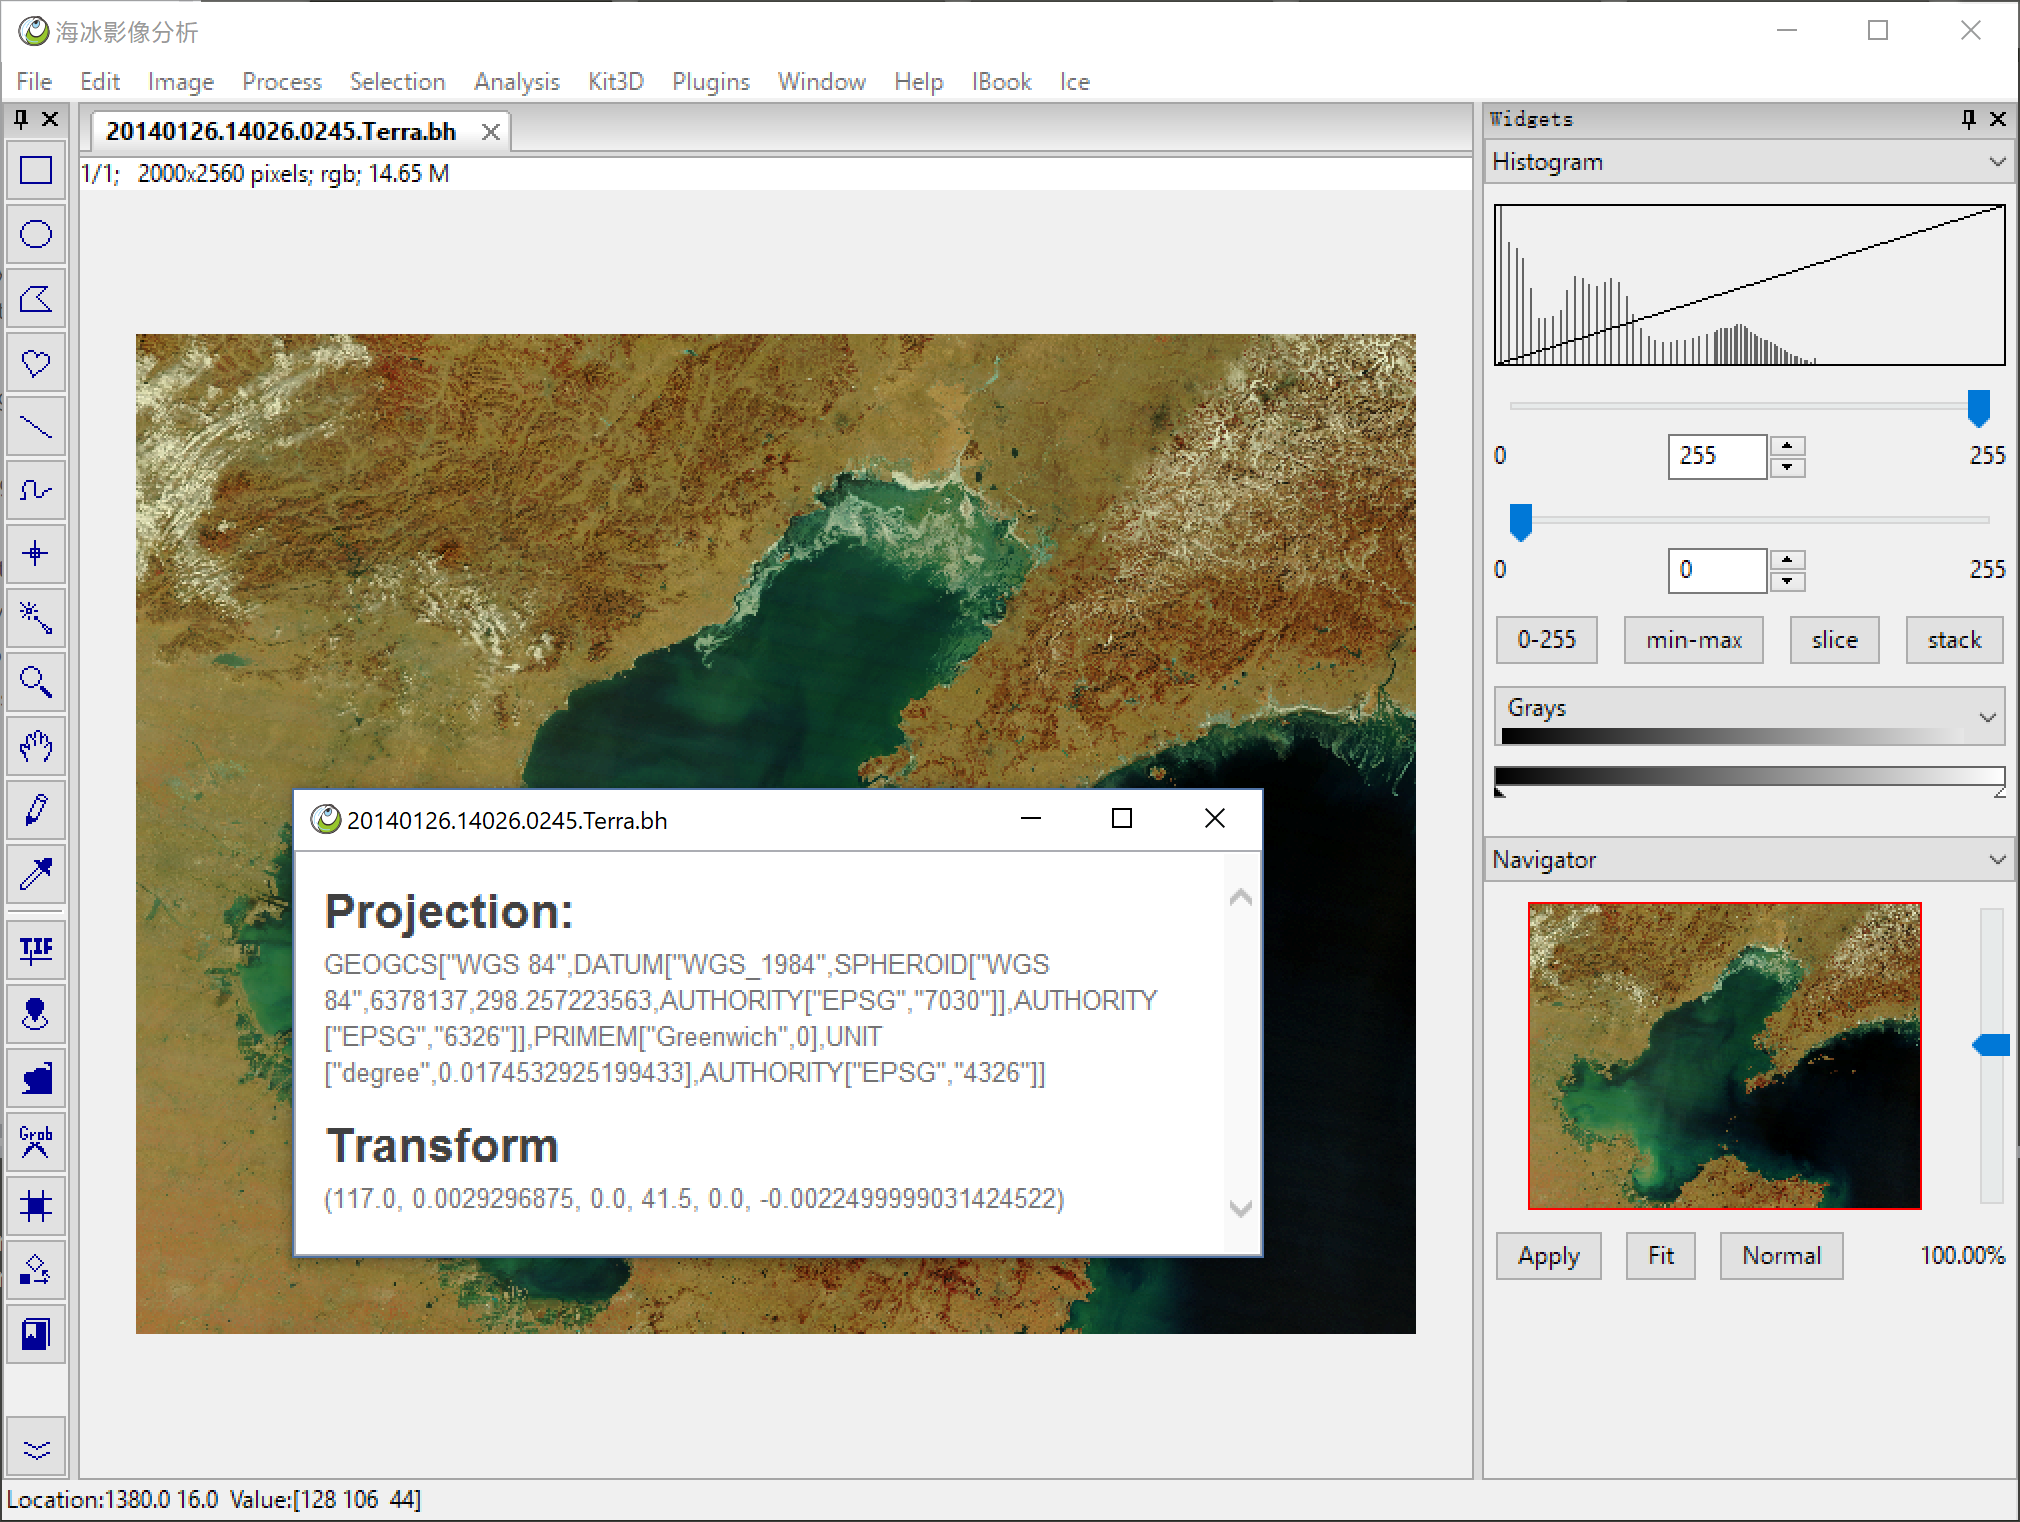
Here we do segment with modis data. Modis data are saved as tiff file, which contains the geo project information.
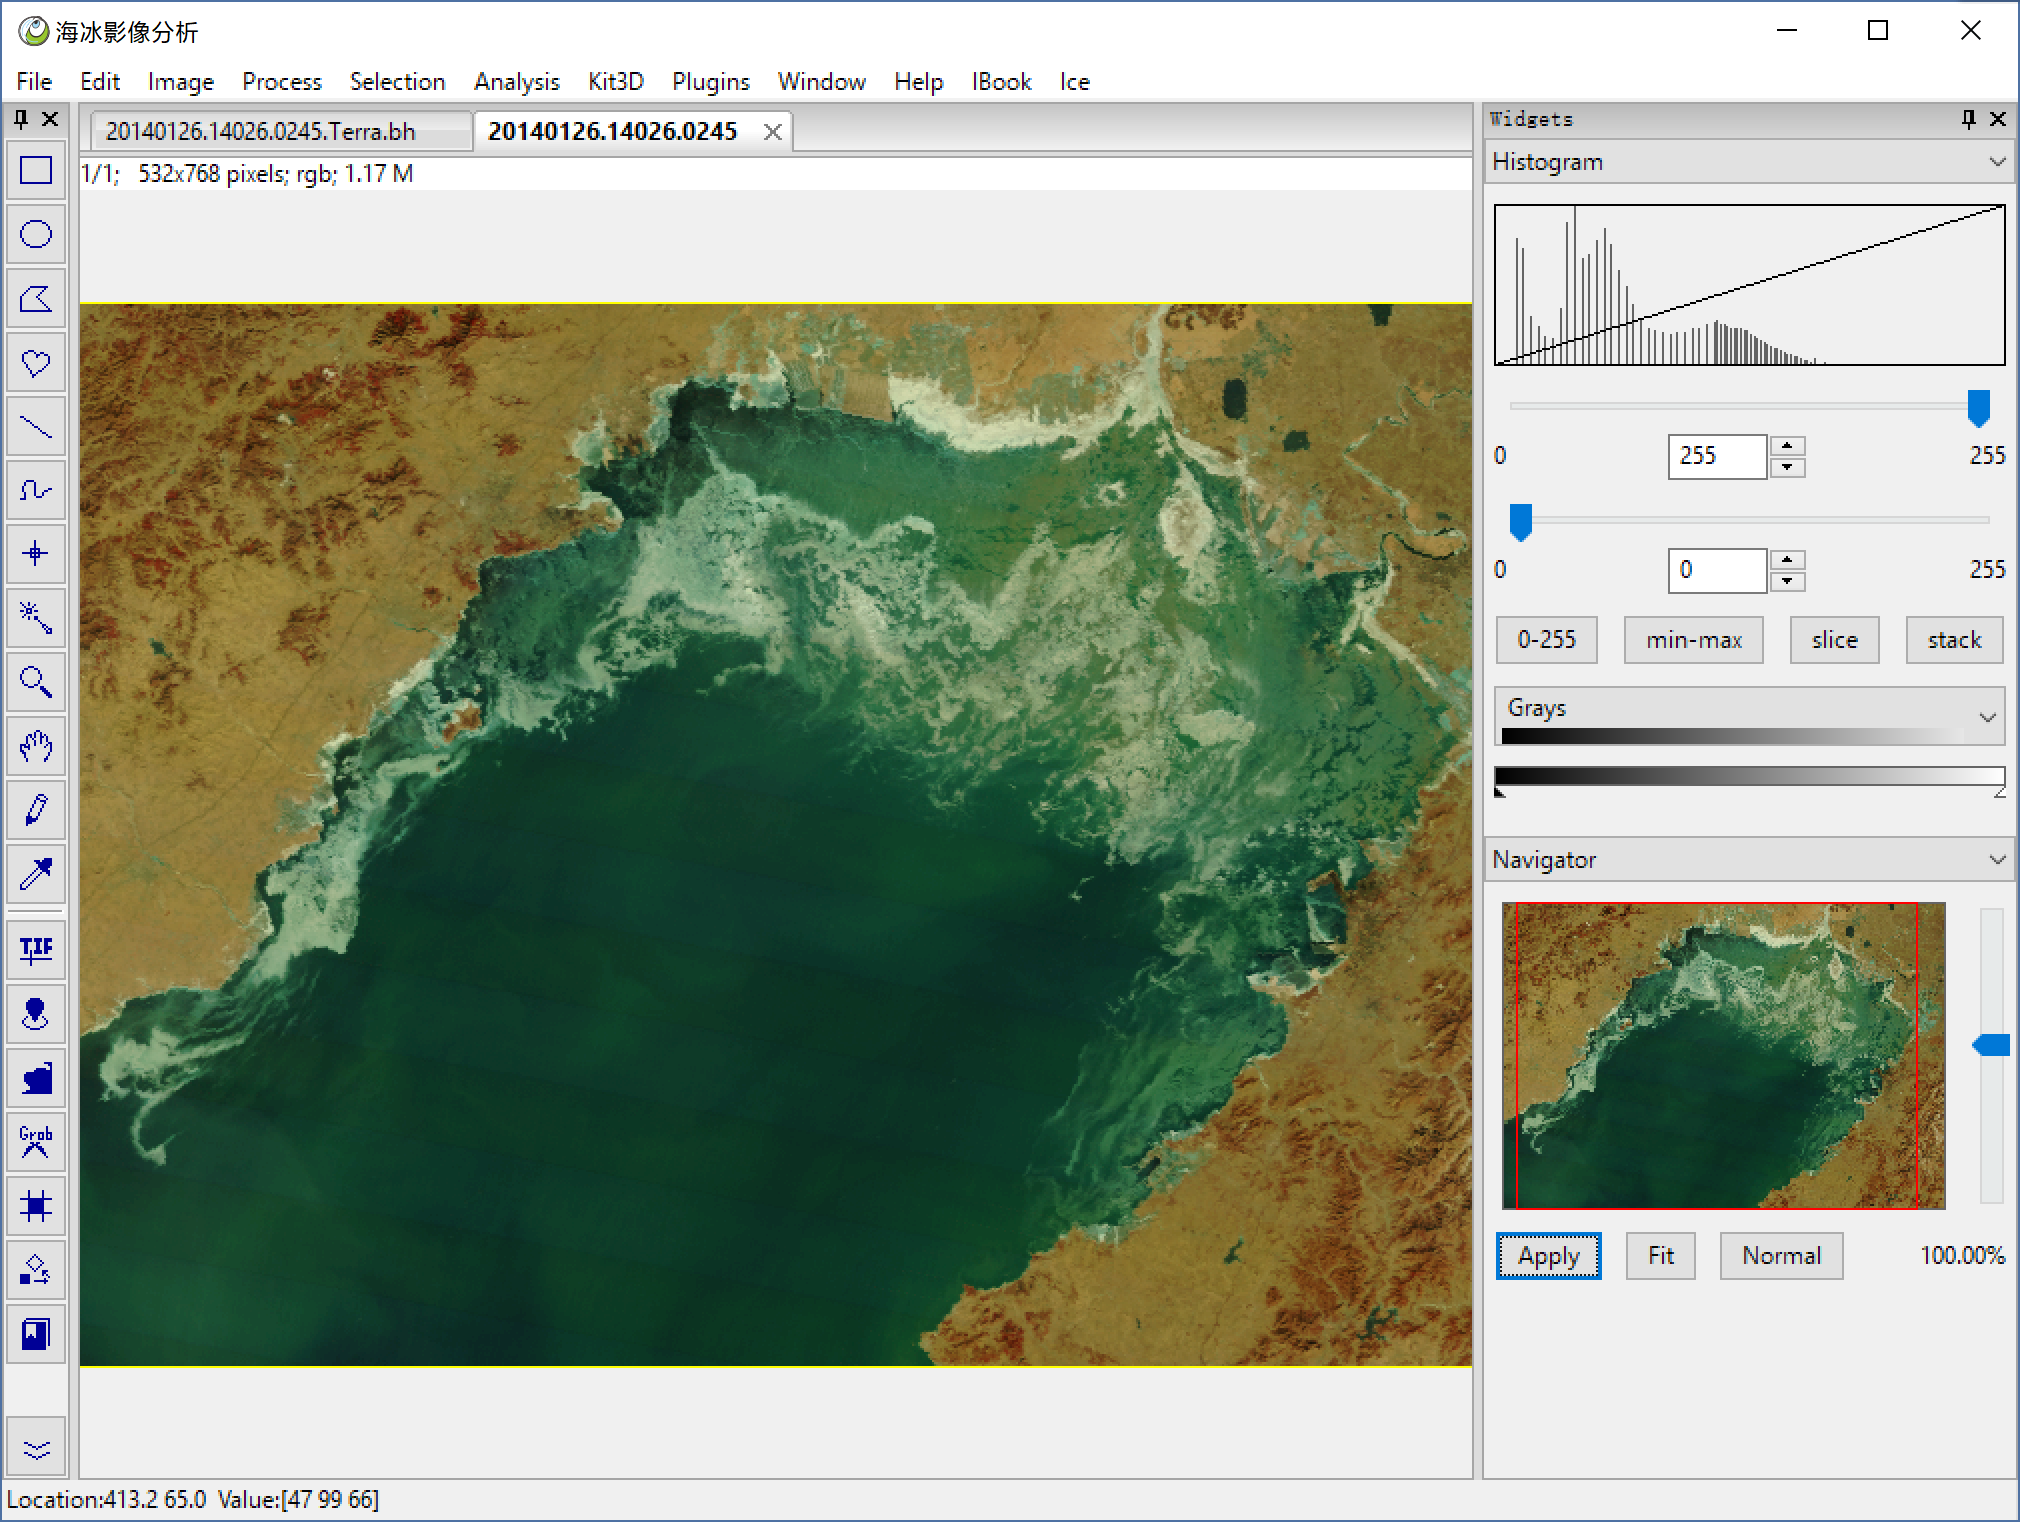
Ice > Geo Tiff Open you must use geo tiff open to open the modis data, if you use normal open method, you would not got the geo information. Ice > Modis Test Data can open some demo data.
Rectangle Select Tool the first tool in toolbar, make a rectangle selection.
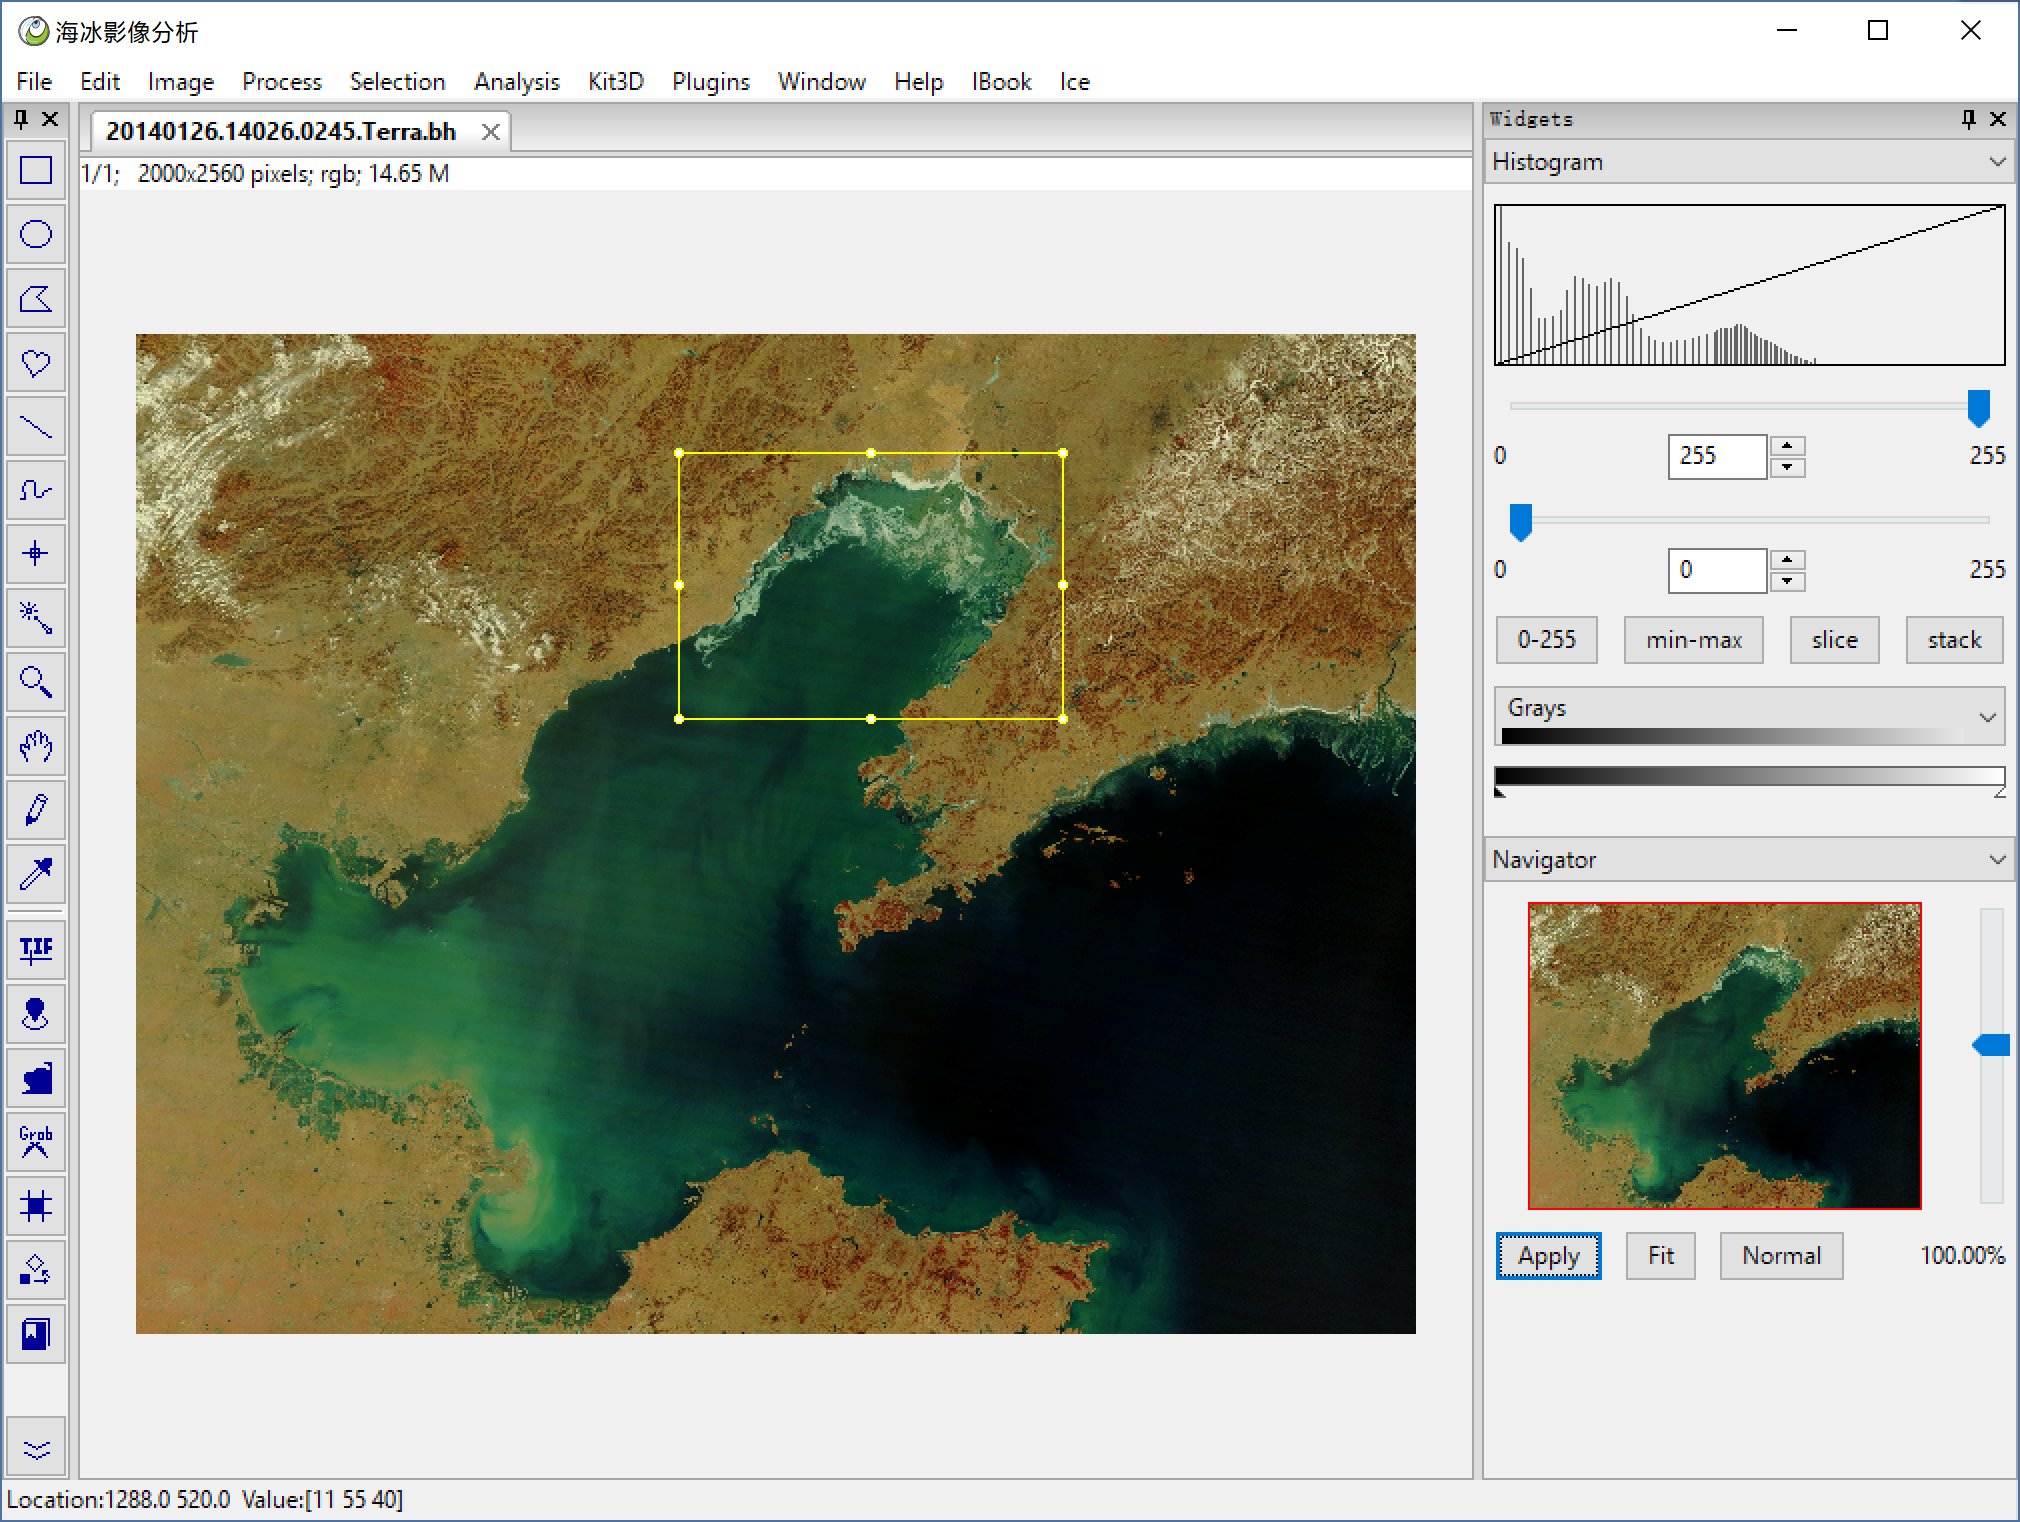
Ice > Duplicate With Projection if use normal duplicate method, the geo information will be lost.
Ice > Load Geo Roi the Geo ROI is the landedge, if you has a shapefile, you can use the landedge tu clip the image, if you did not have, I think it doesnot matter, the interactive segment method below can also exclude the land area. Ice > Bohai Landedge is a landedge acrroding the demo data.
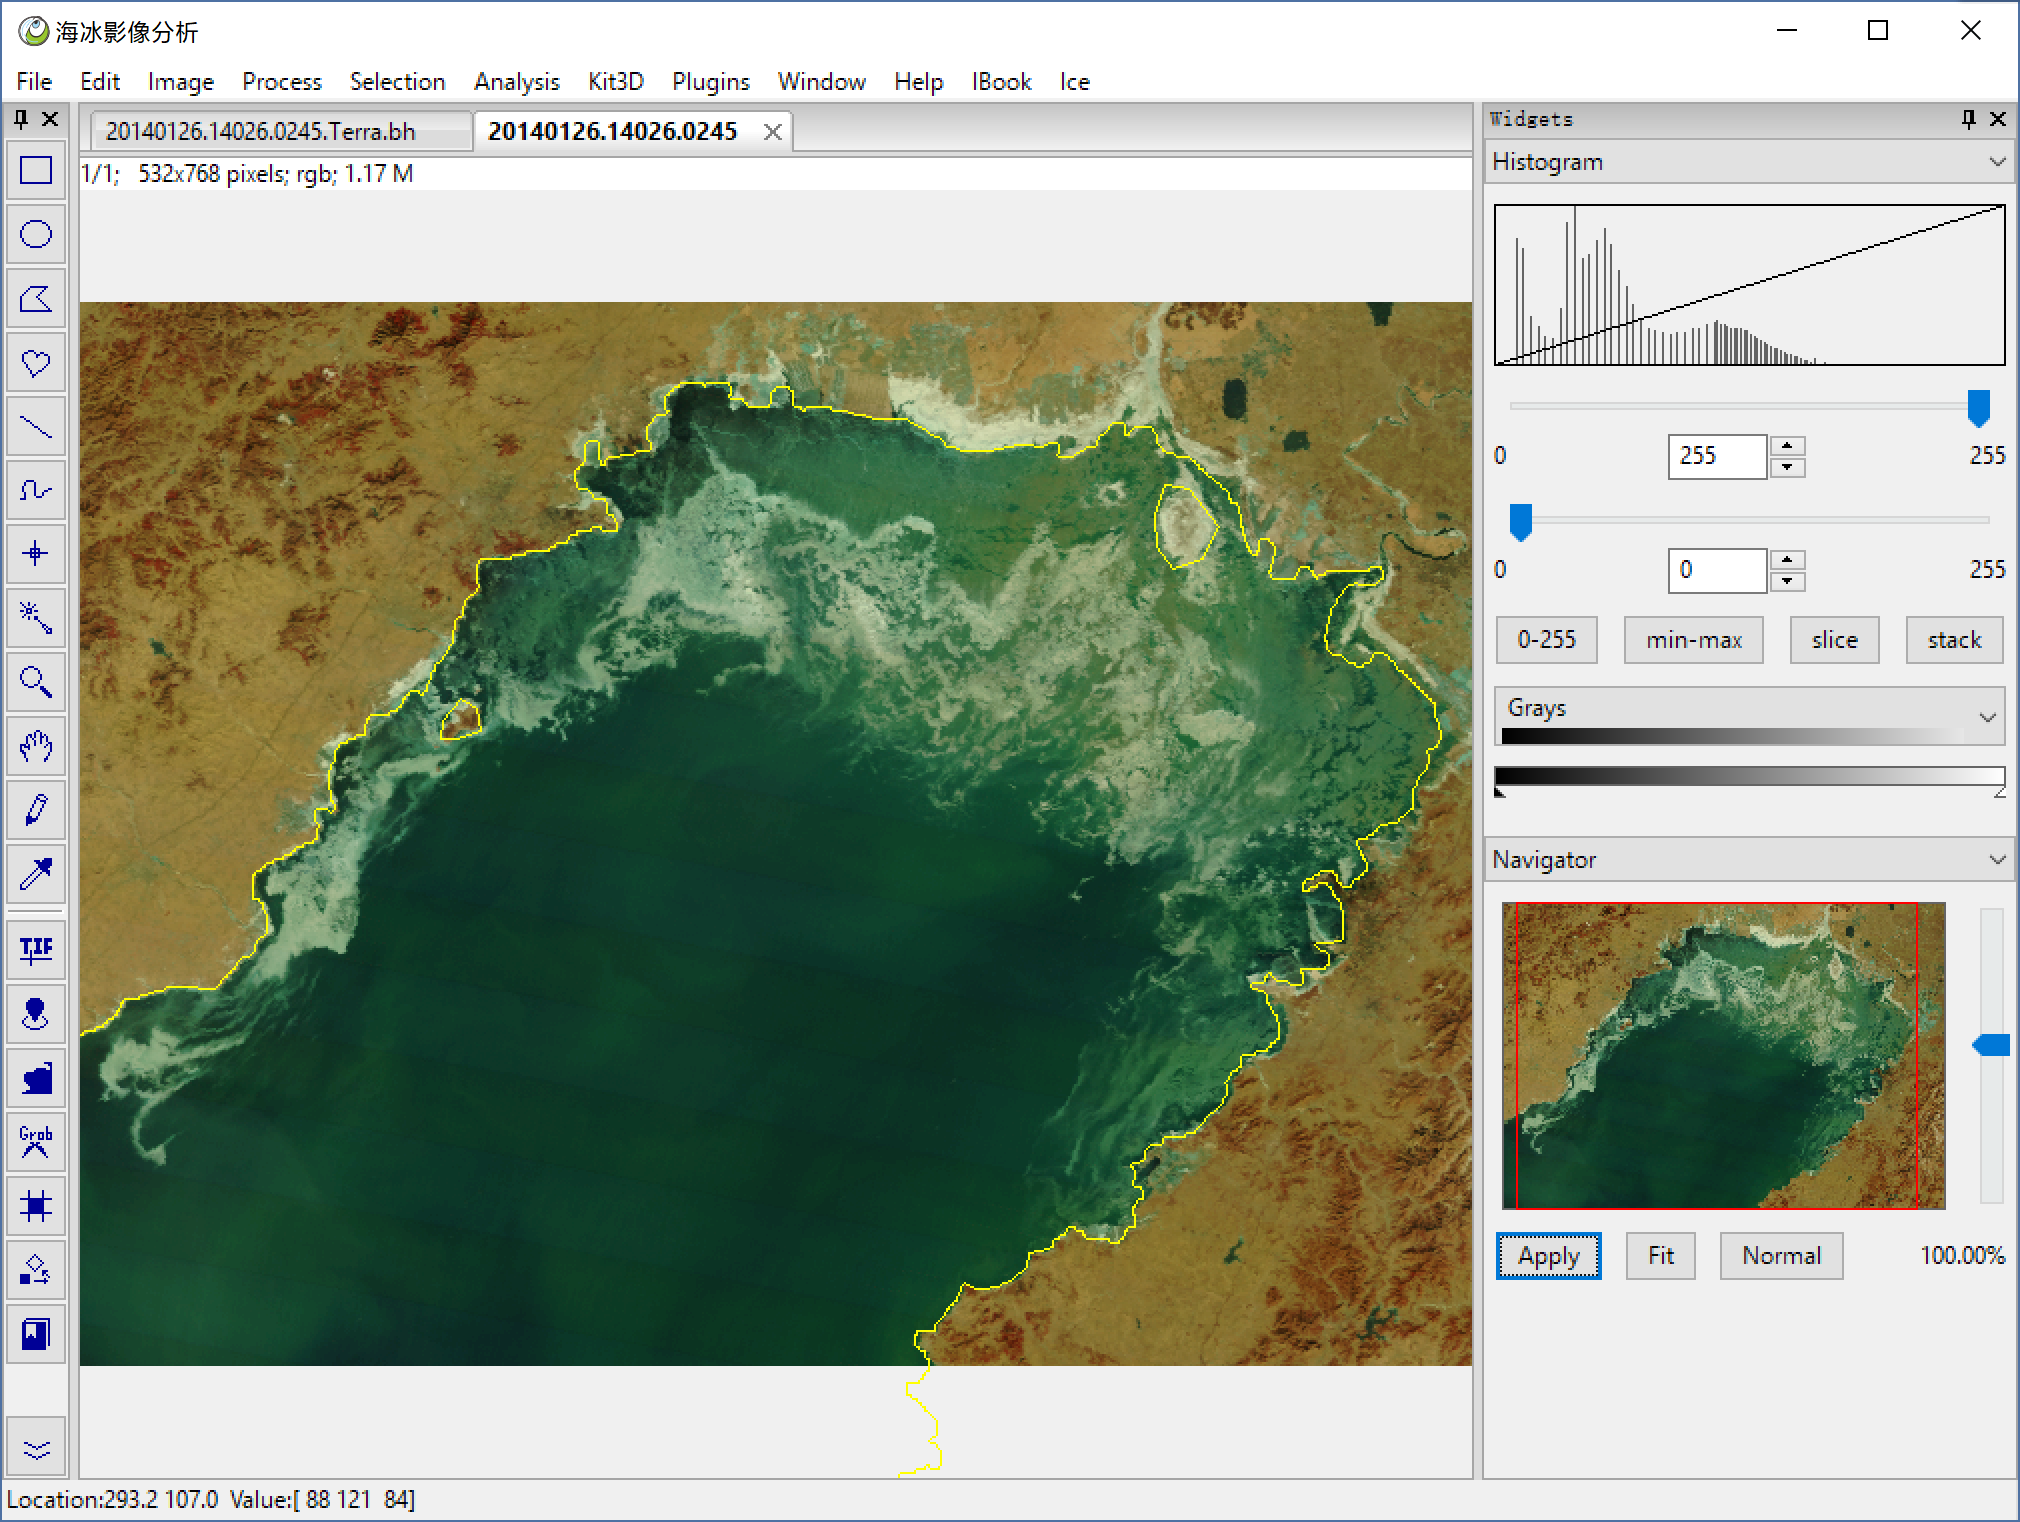
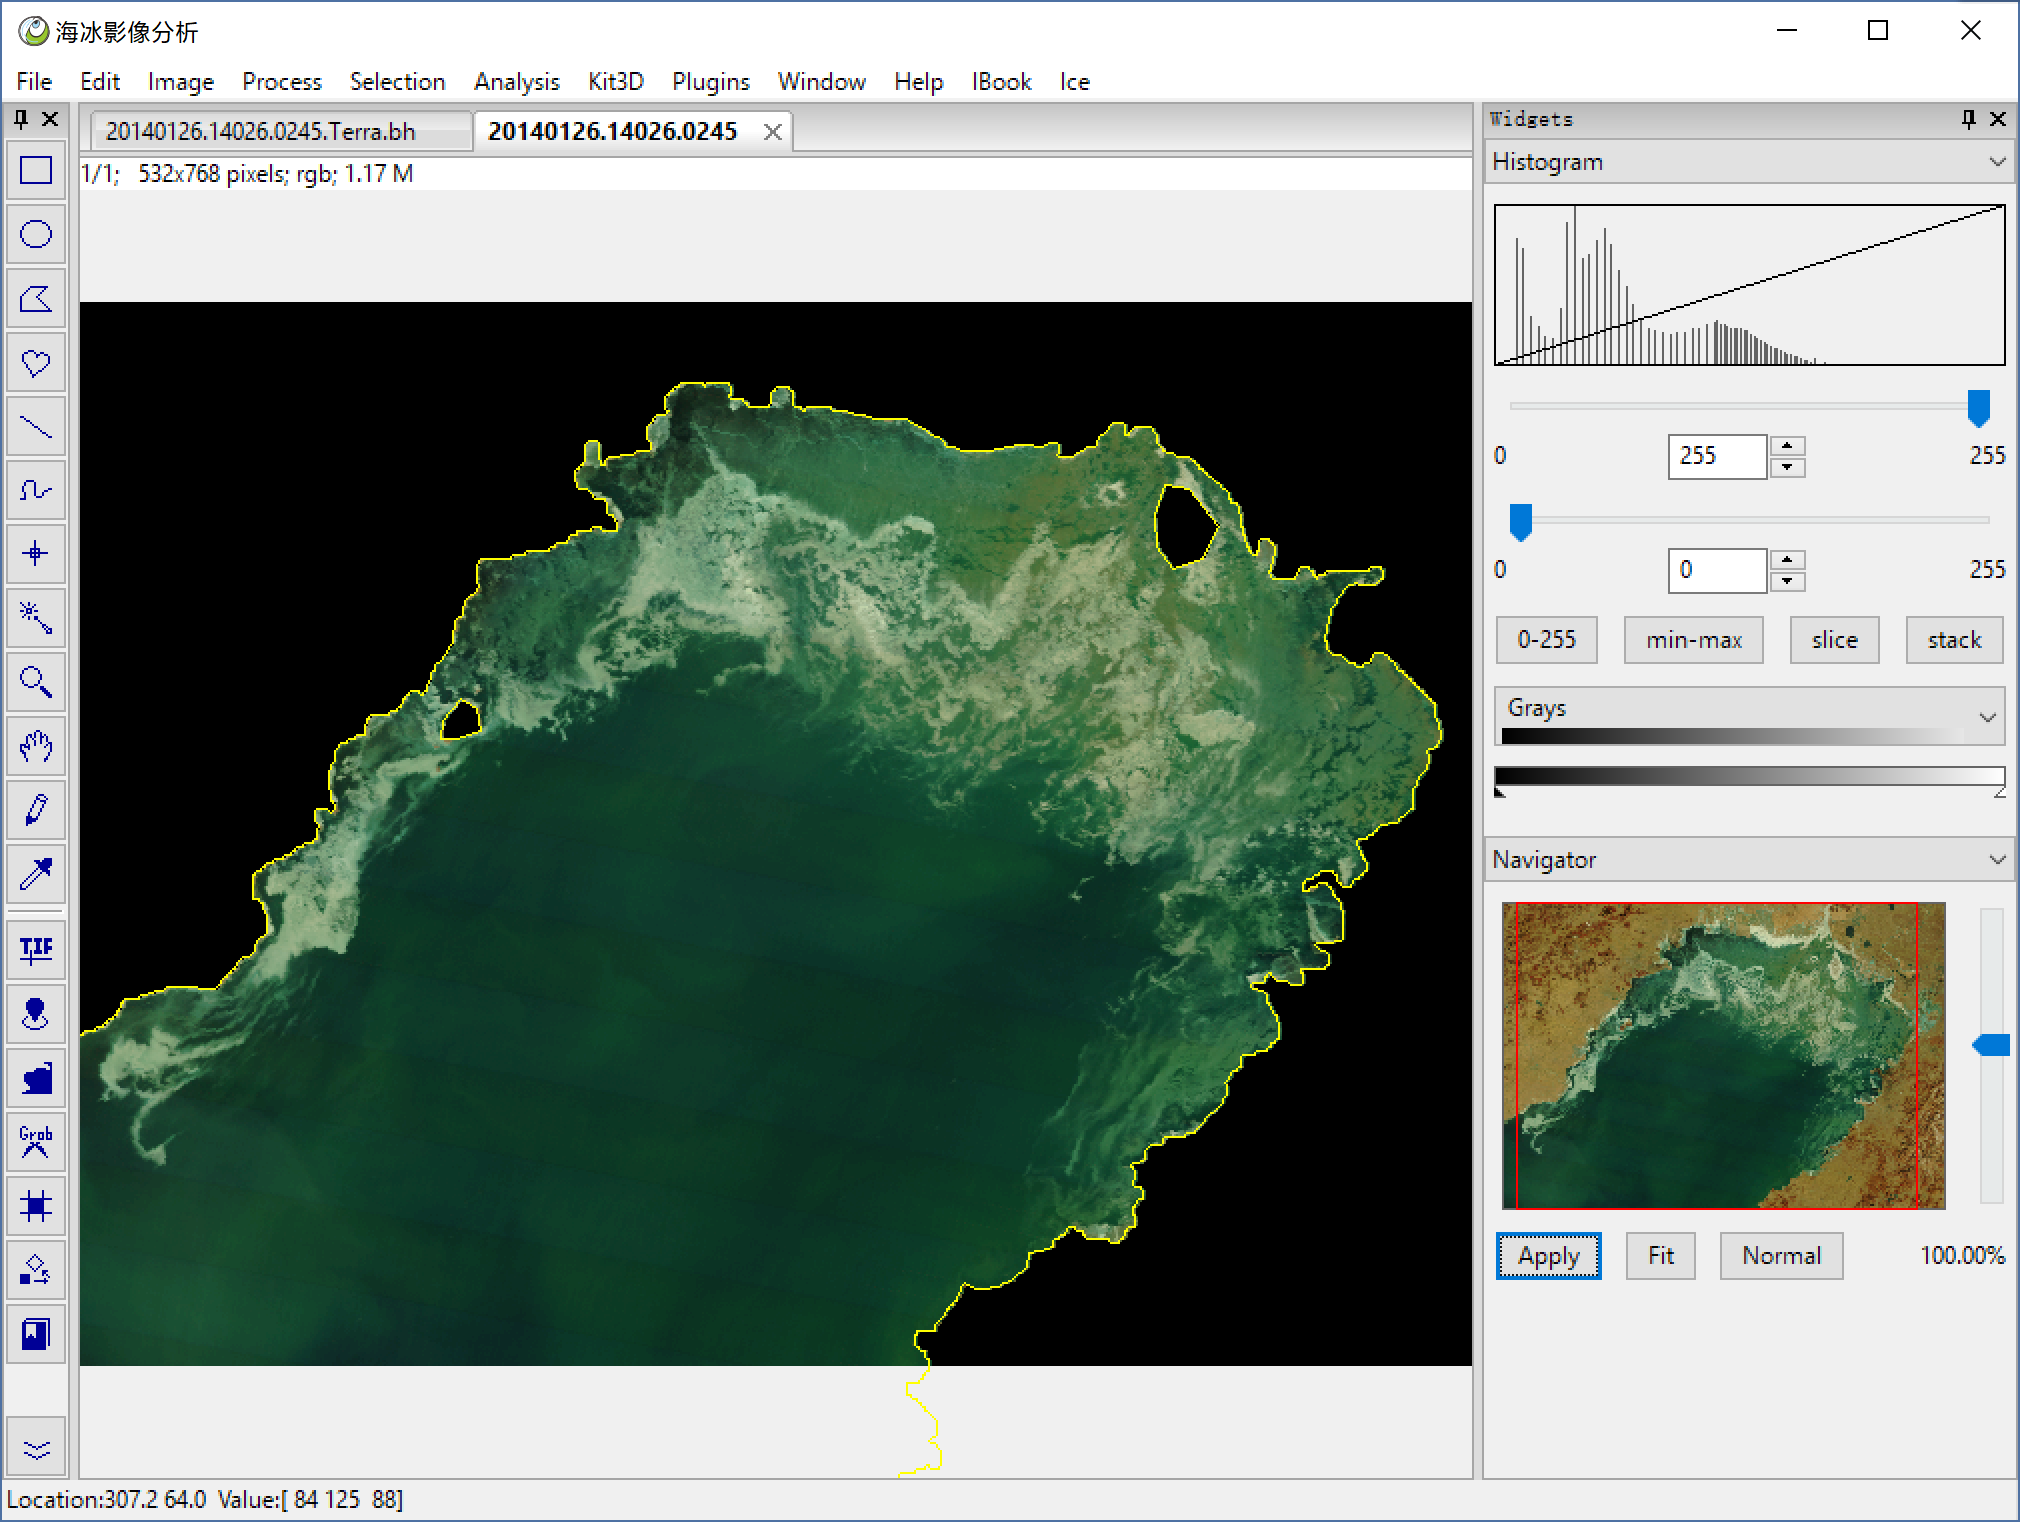
Image > Clear Out clear the land area
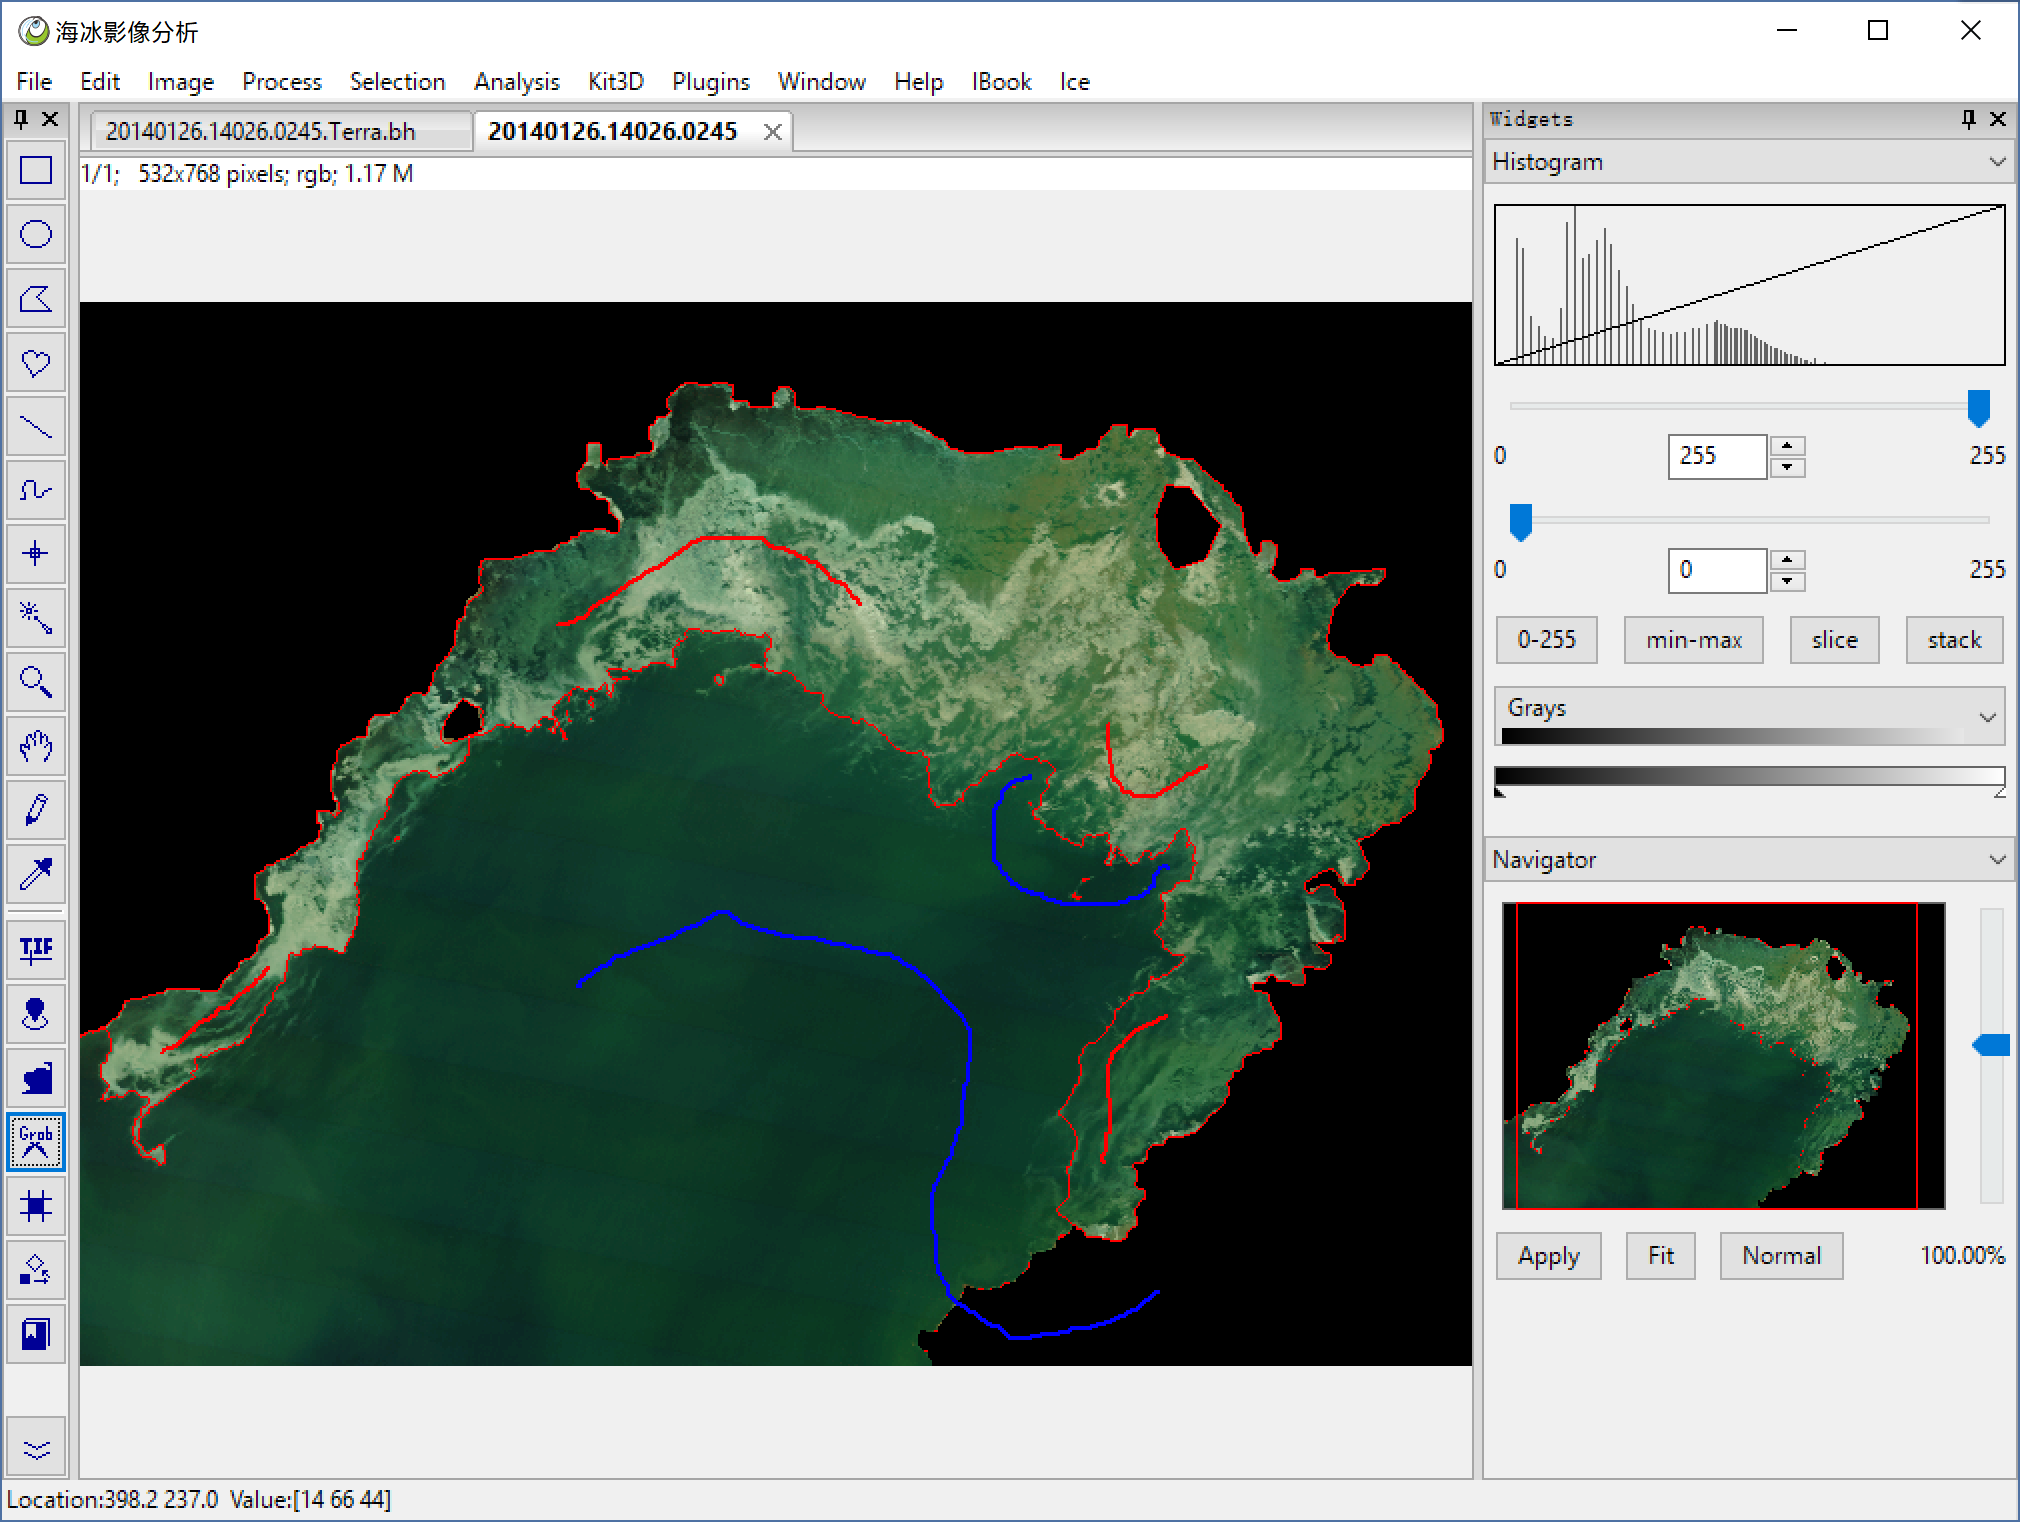
Grab Tool which has a scissors icon, this tool is a wraper with opencv's grabcut, move mouse, use left key to mark the ice(red), and left key to mark the water(blue) then click left key with ctrl pressed we can got the red edge, this is our segmentation result.

If we did not satisfy the result, we can use ctrl + z to undo, then repair the mark, then give a left click with ctrl again, util the result is OK.
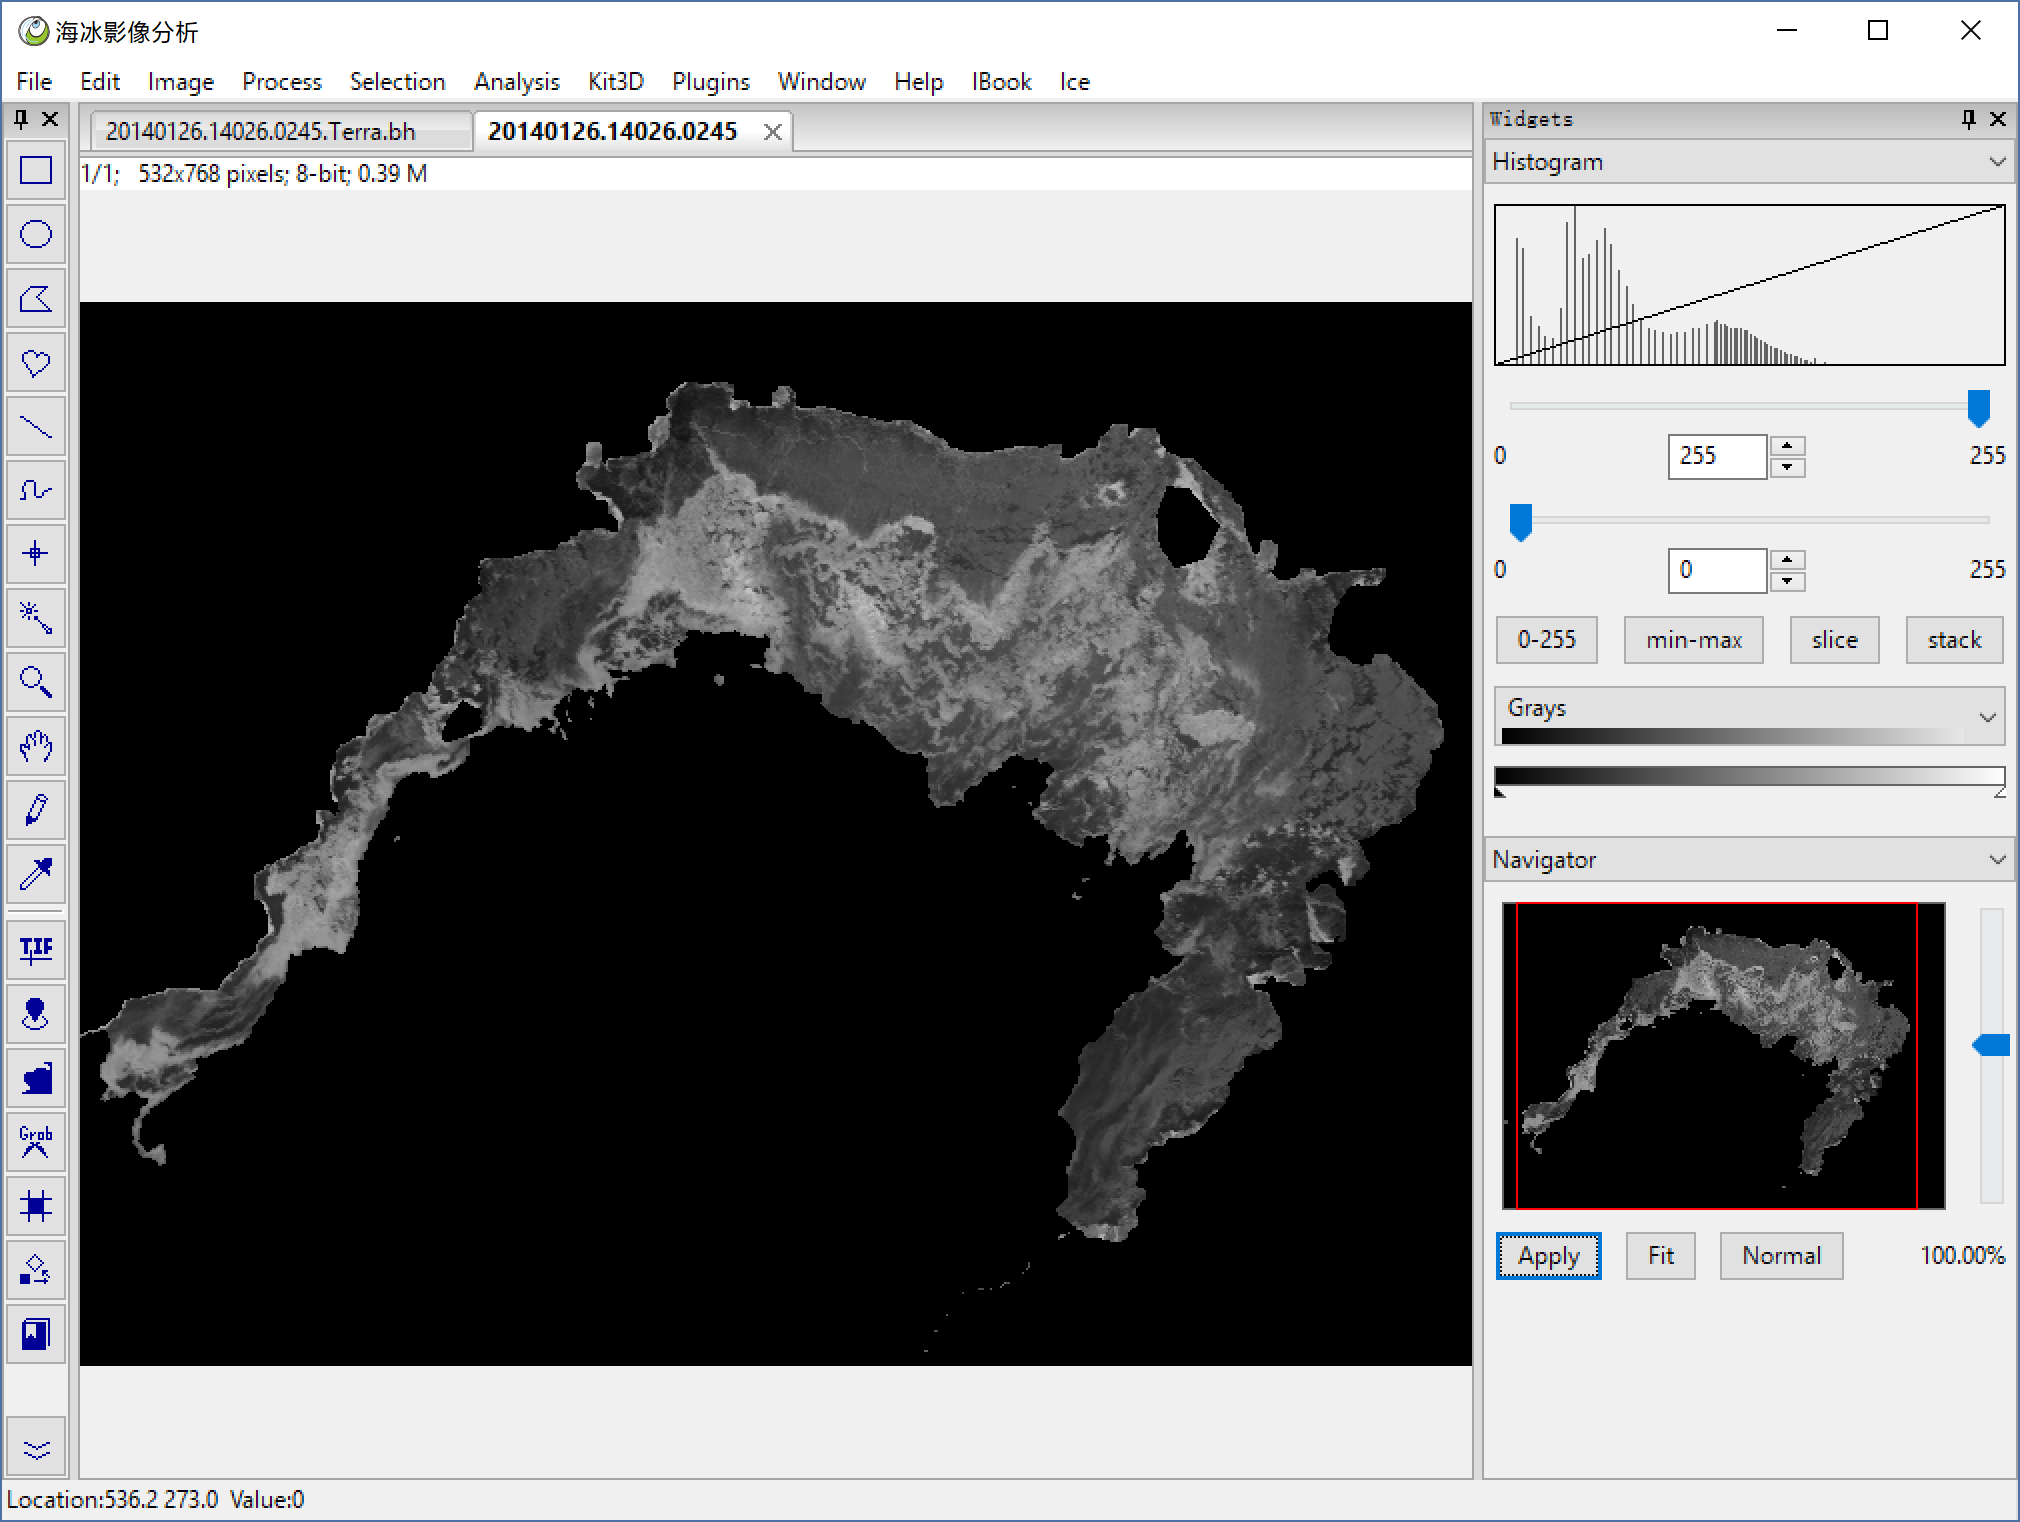
then undo again, and give a left click with alt, program will clear the water area.
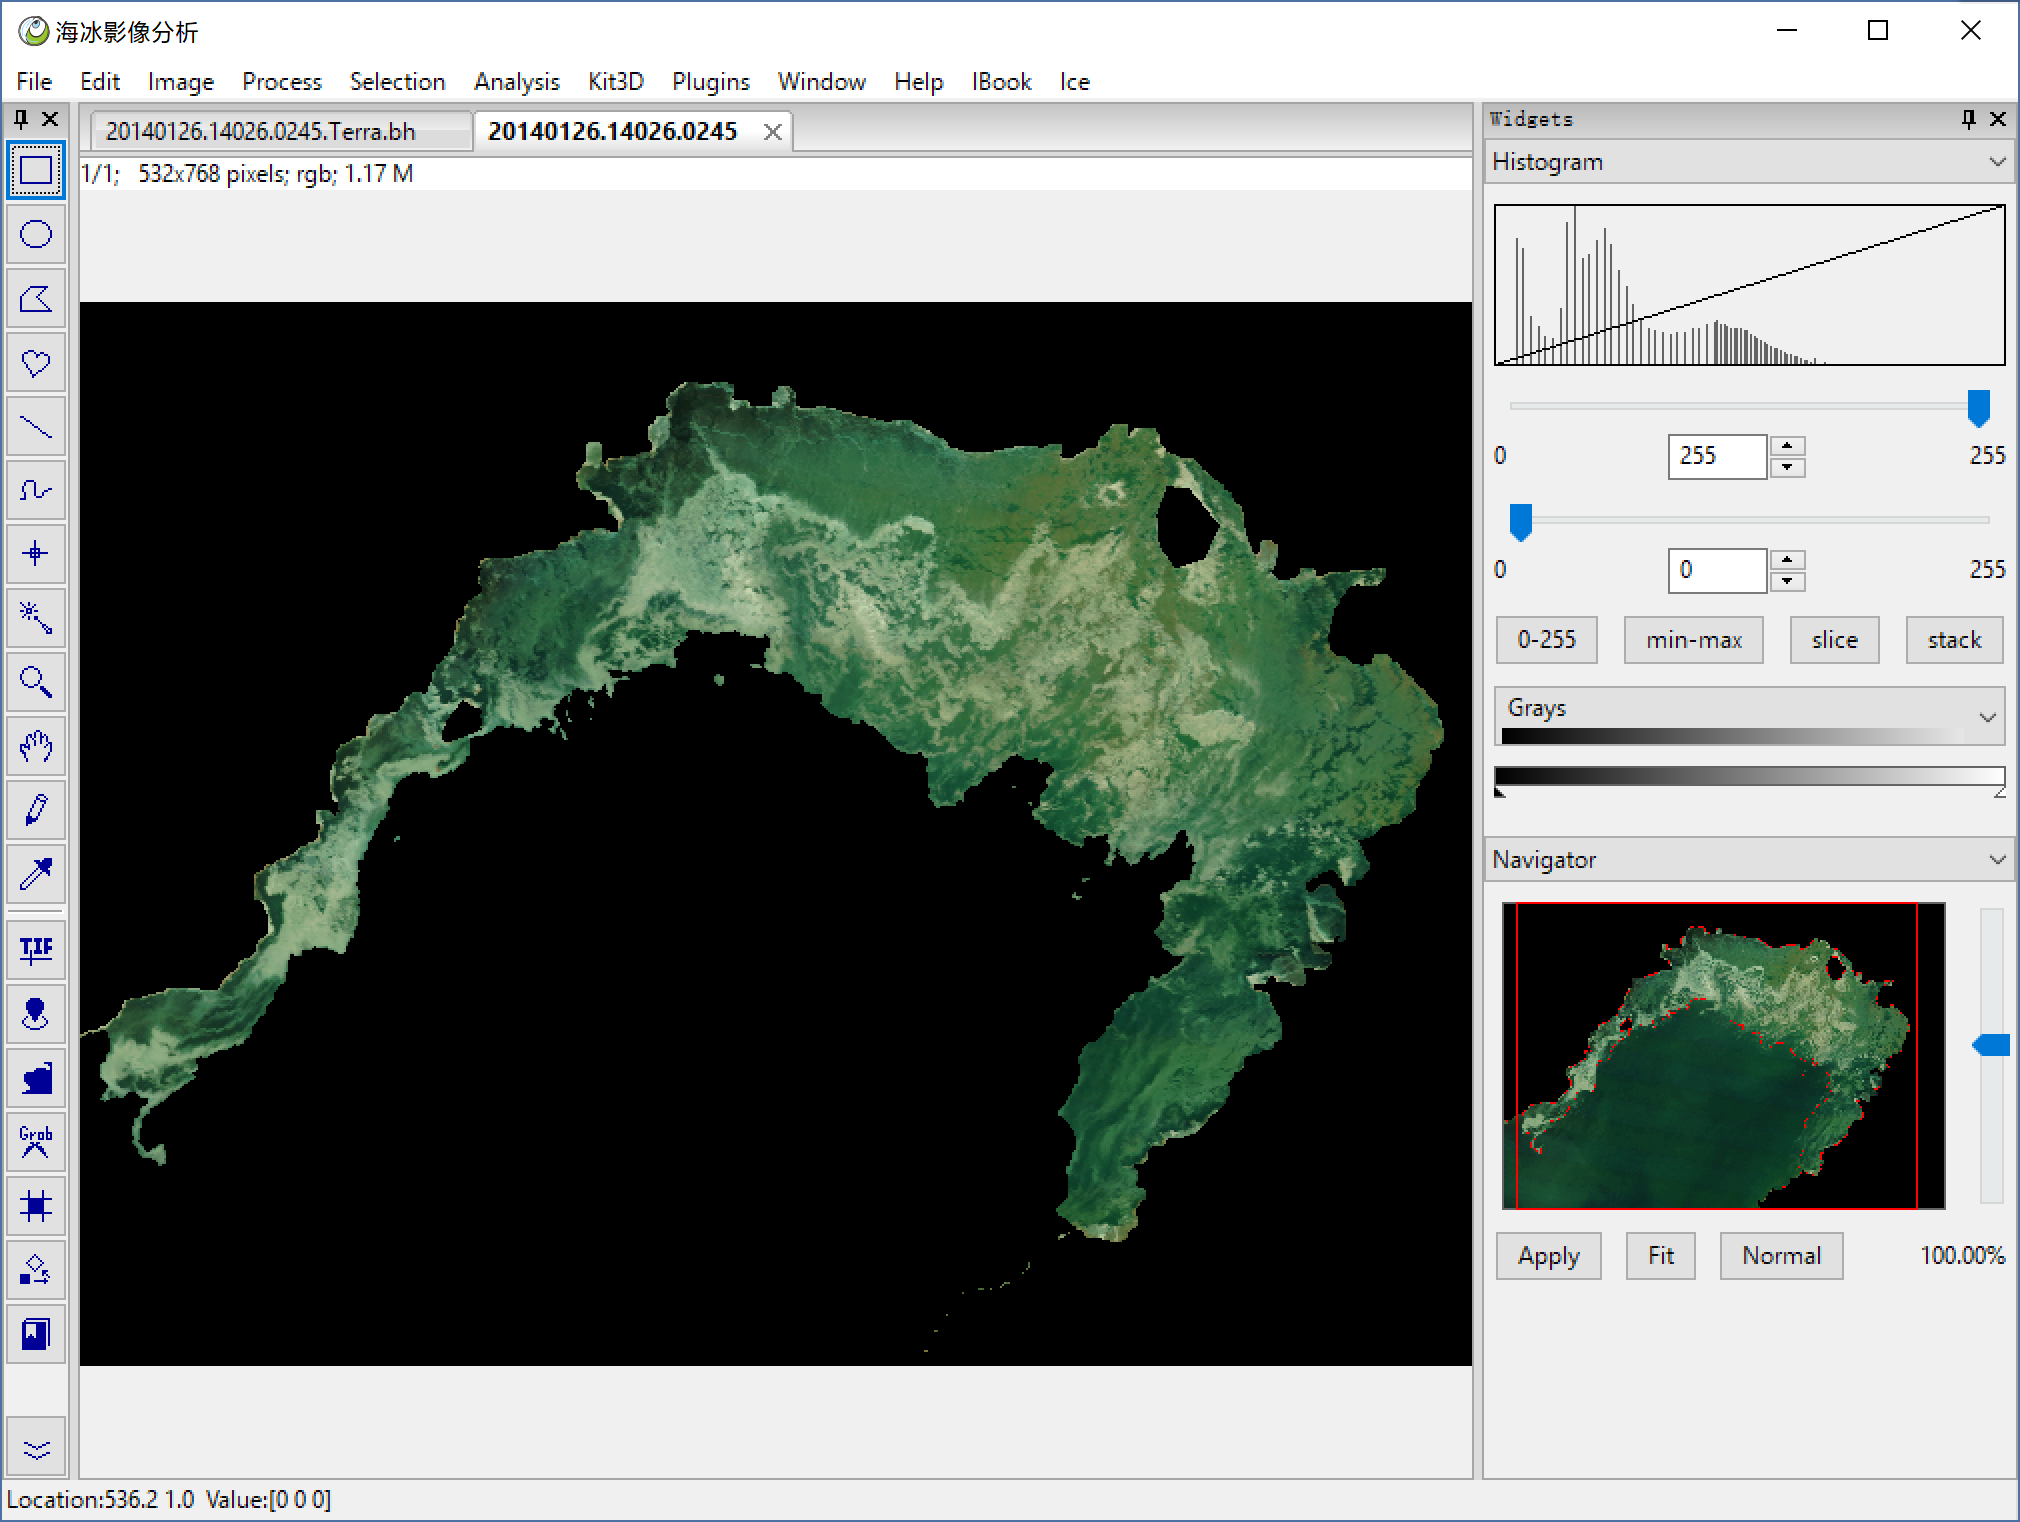
Image > Type > 8-bit transform to 8 bit gray image.
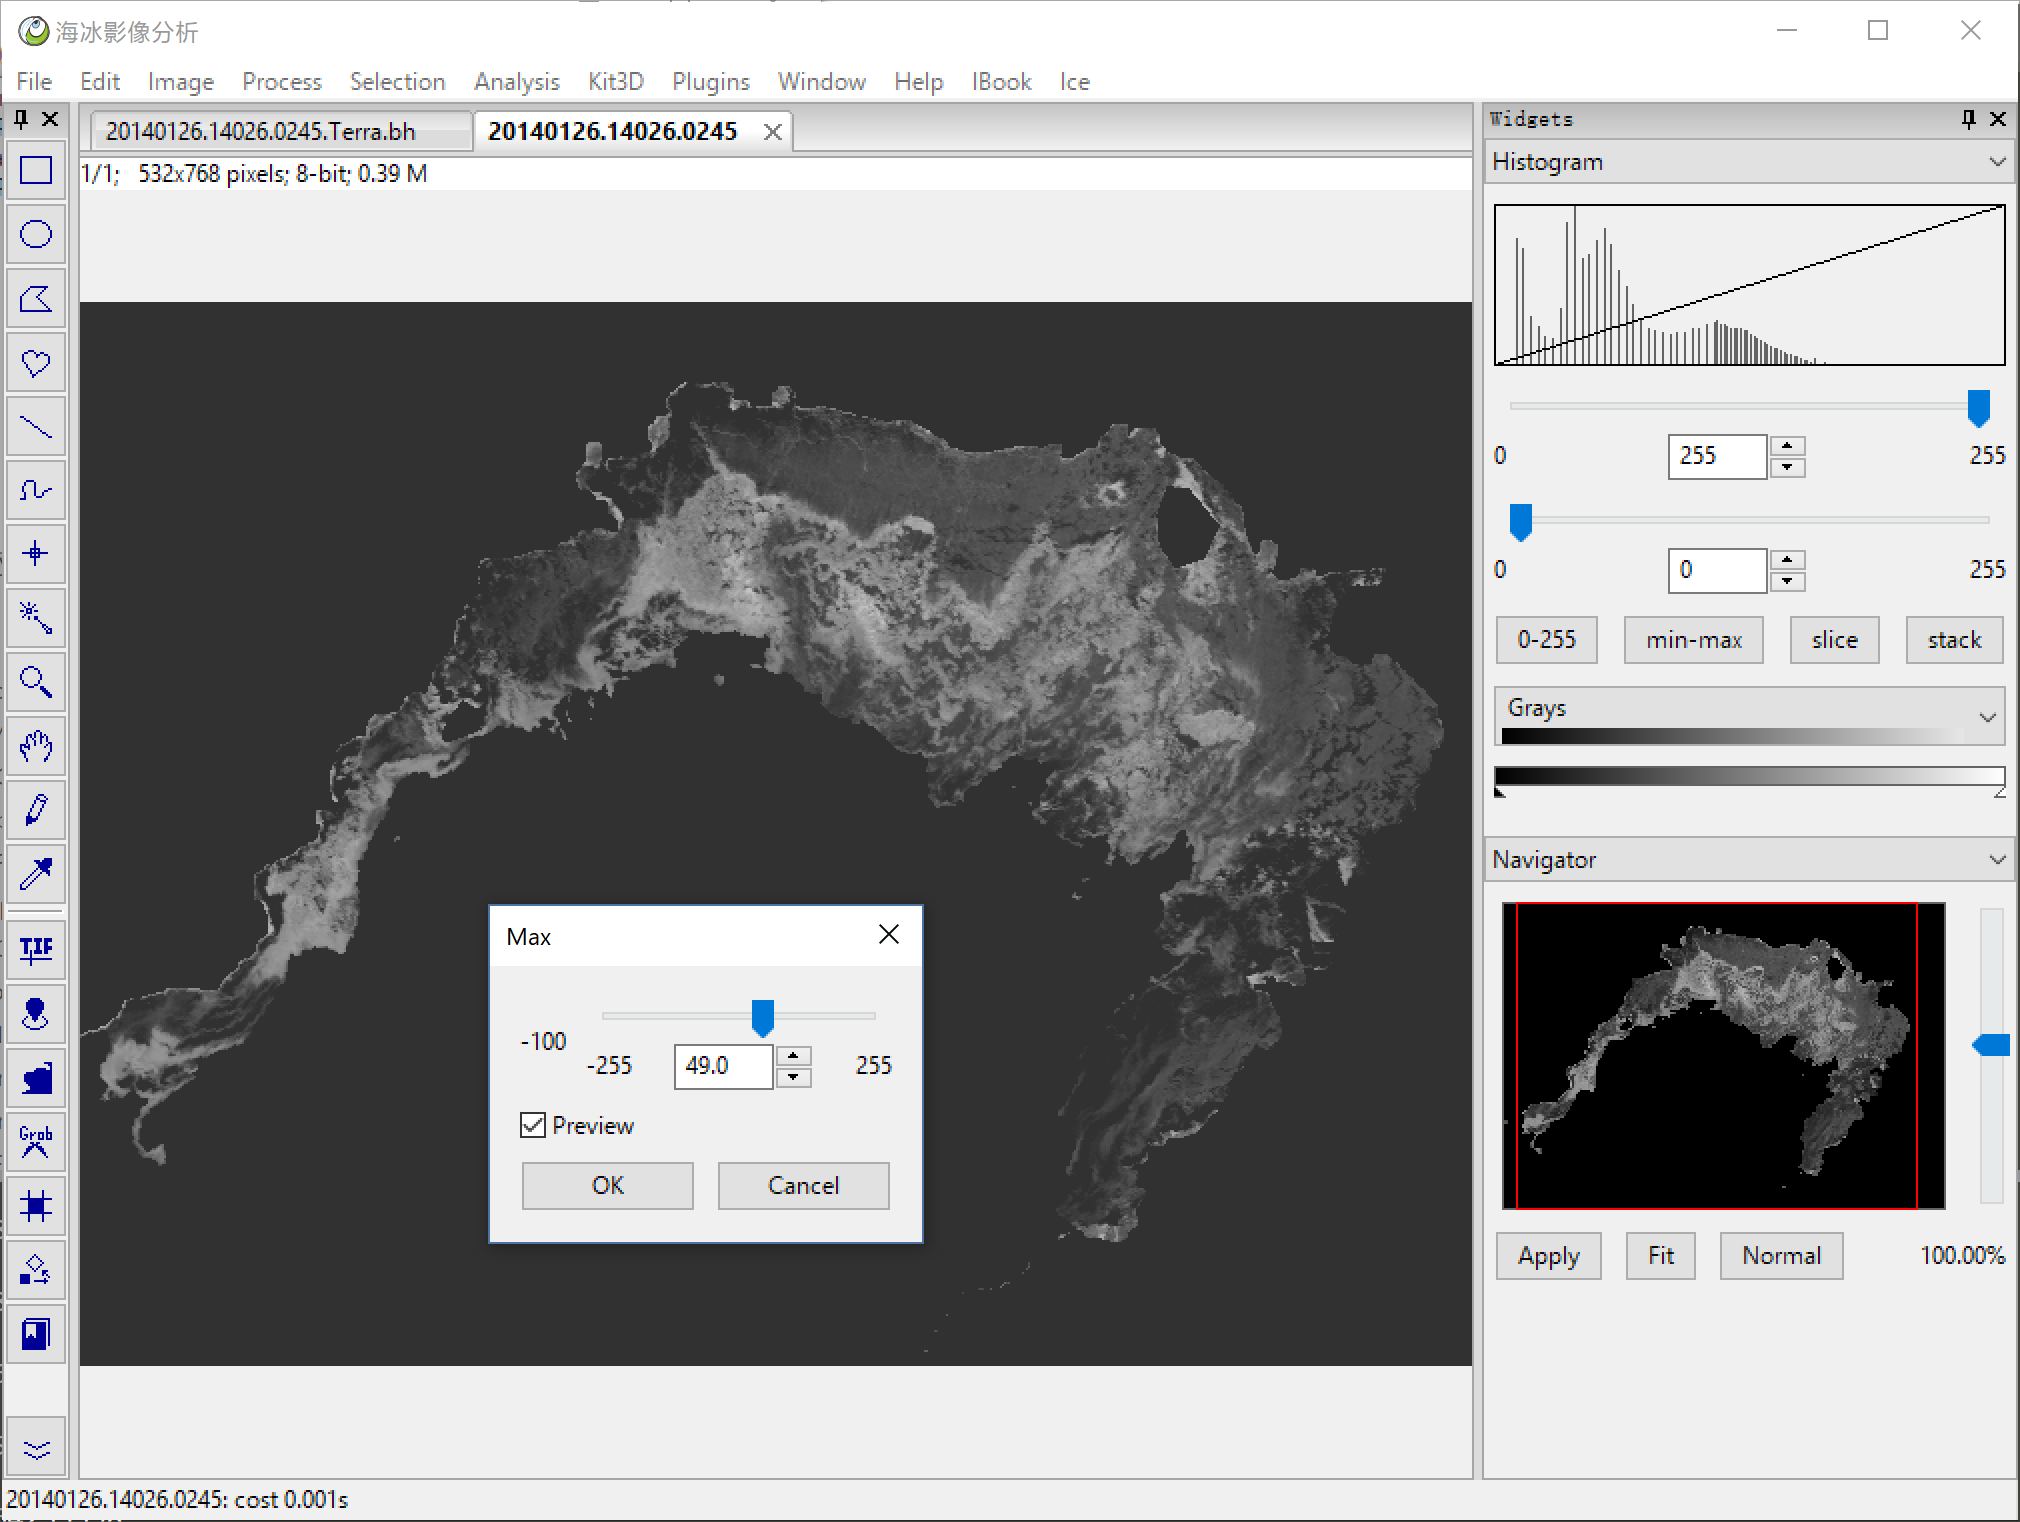
Process > Math > Max bright the background, make it same as the water.
Process > Filter > UnSharp Mask do a Unsharm Mask Enhance.
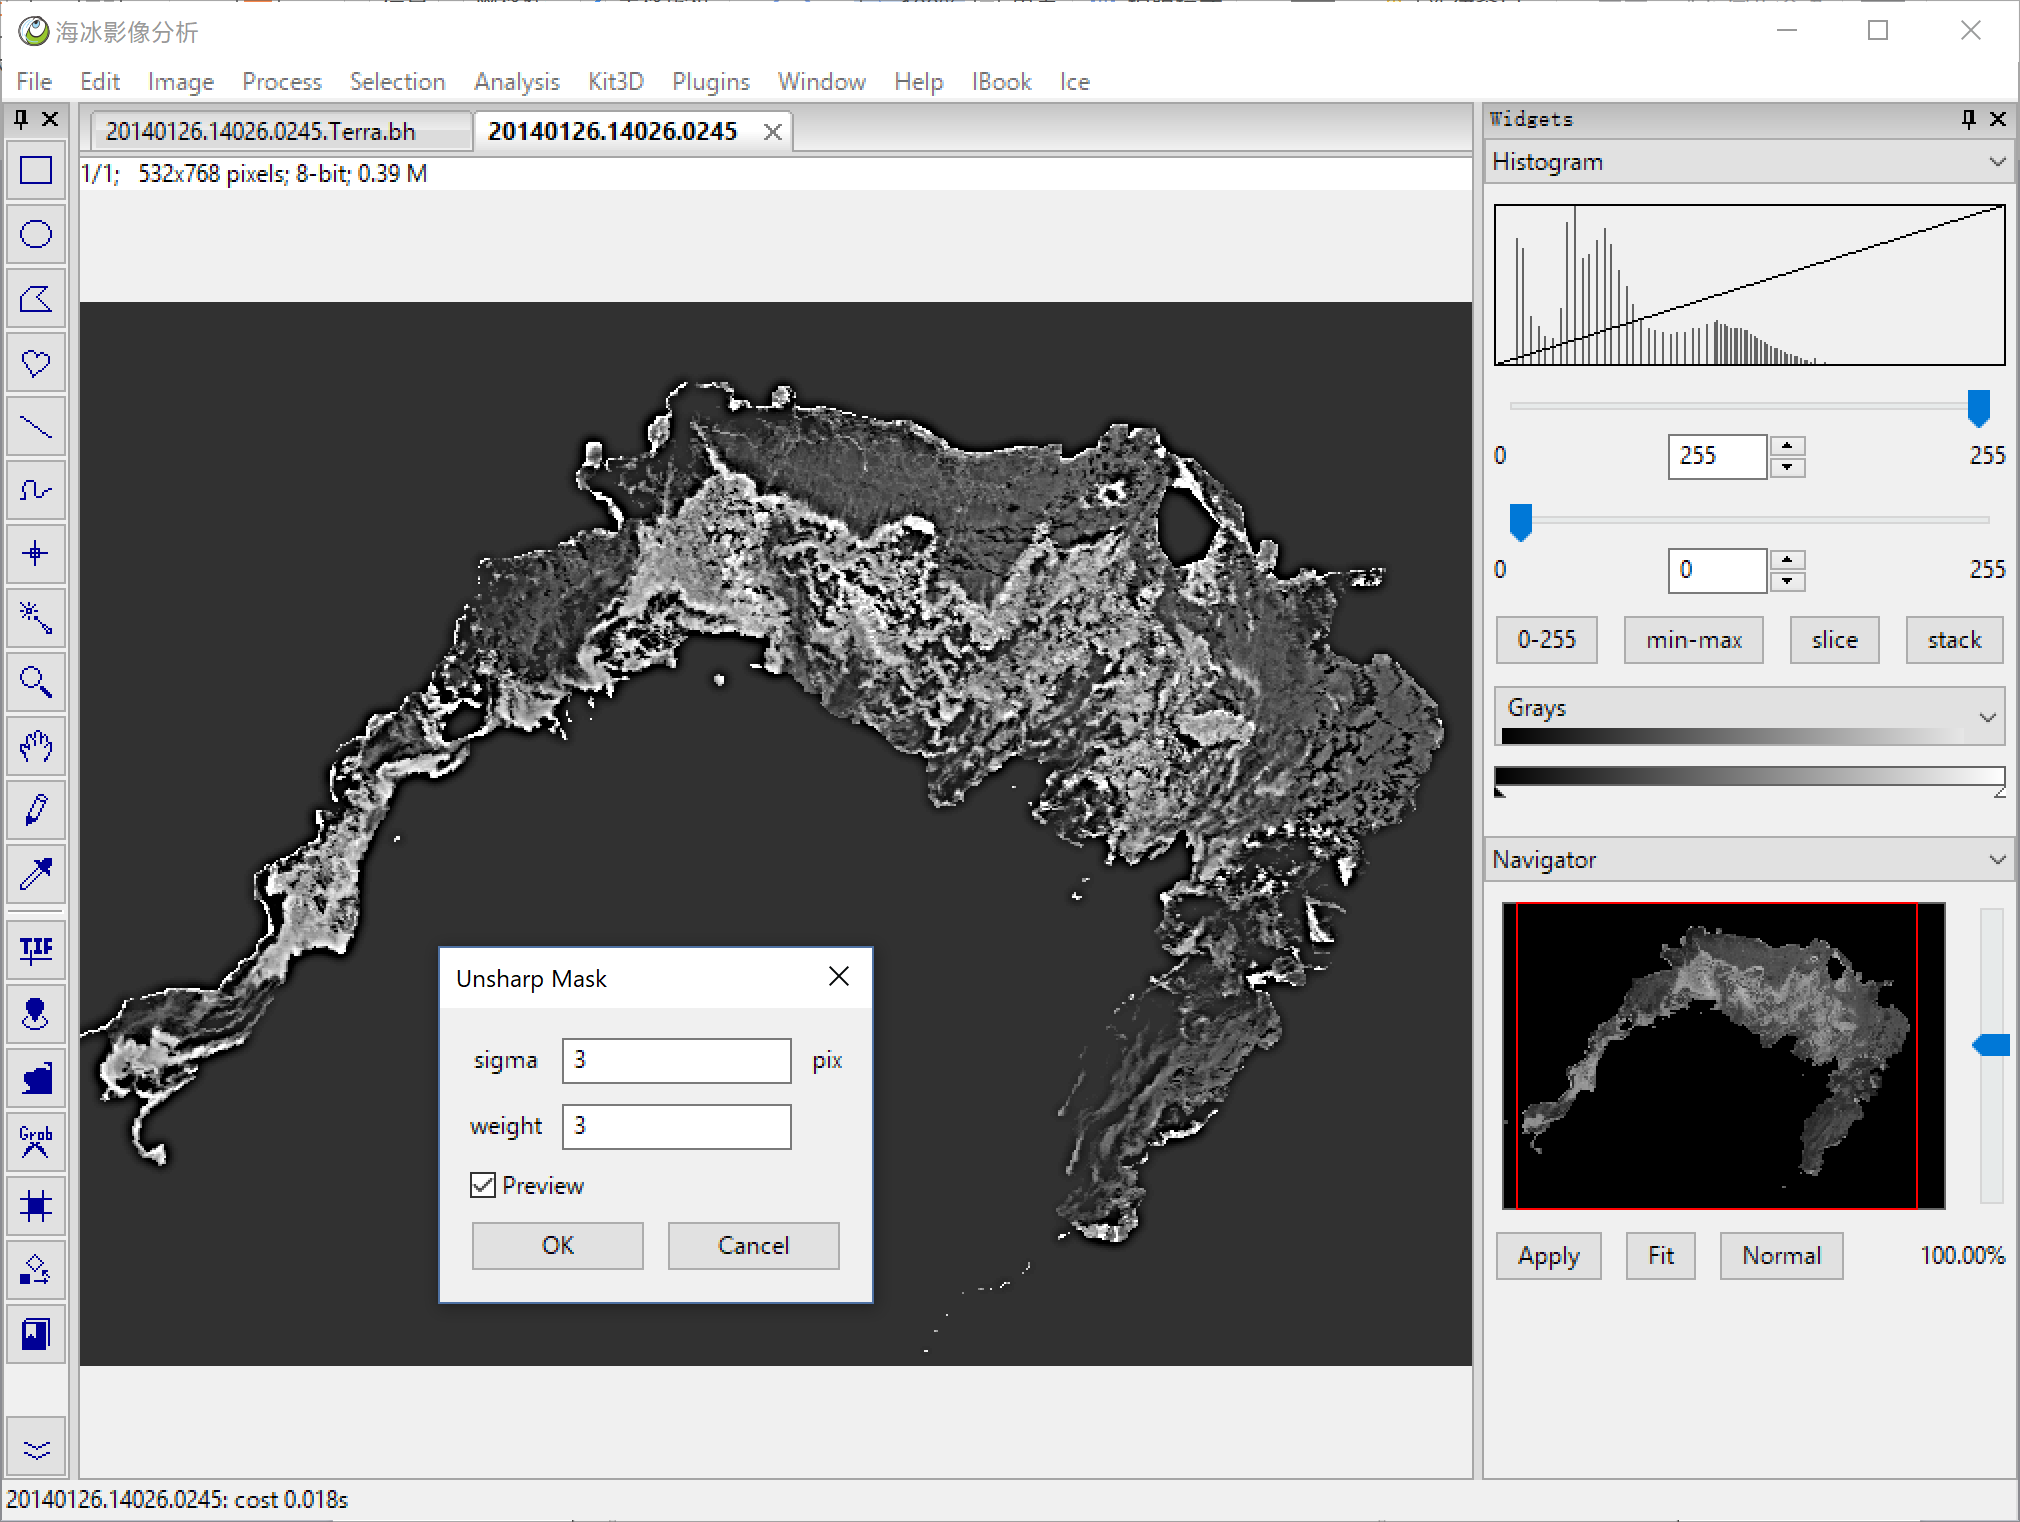
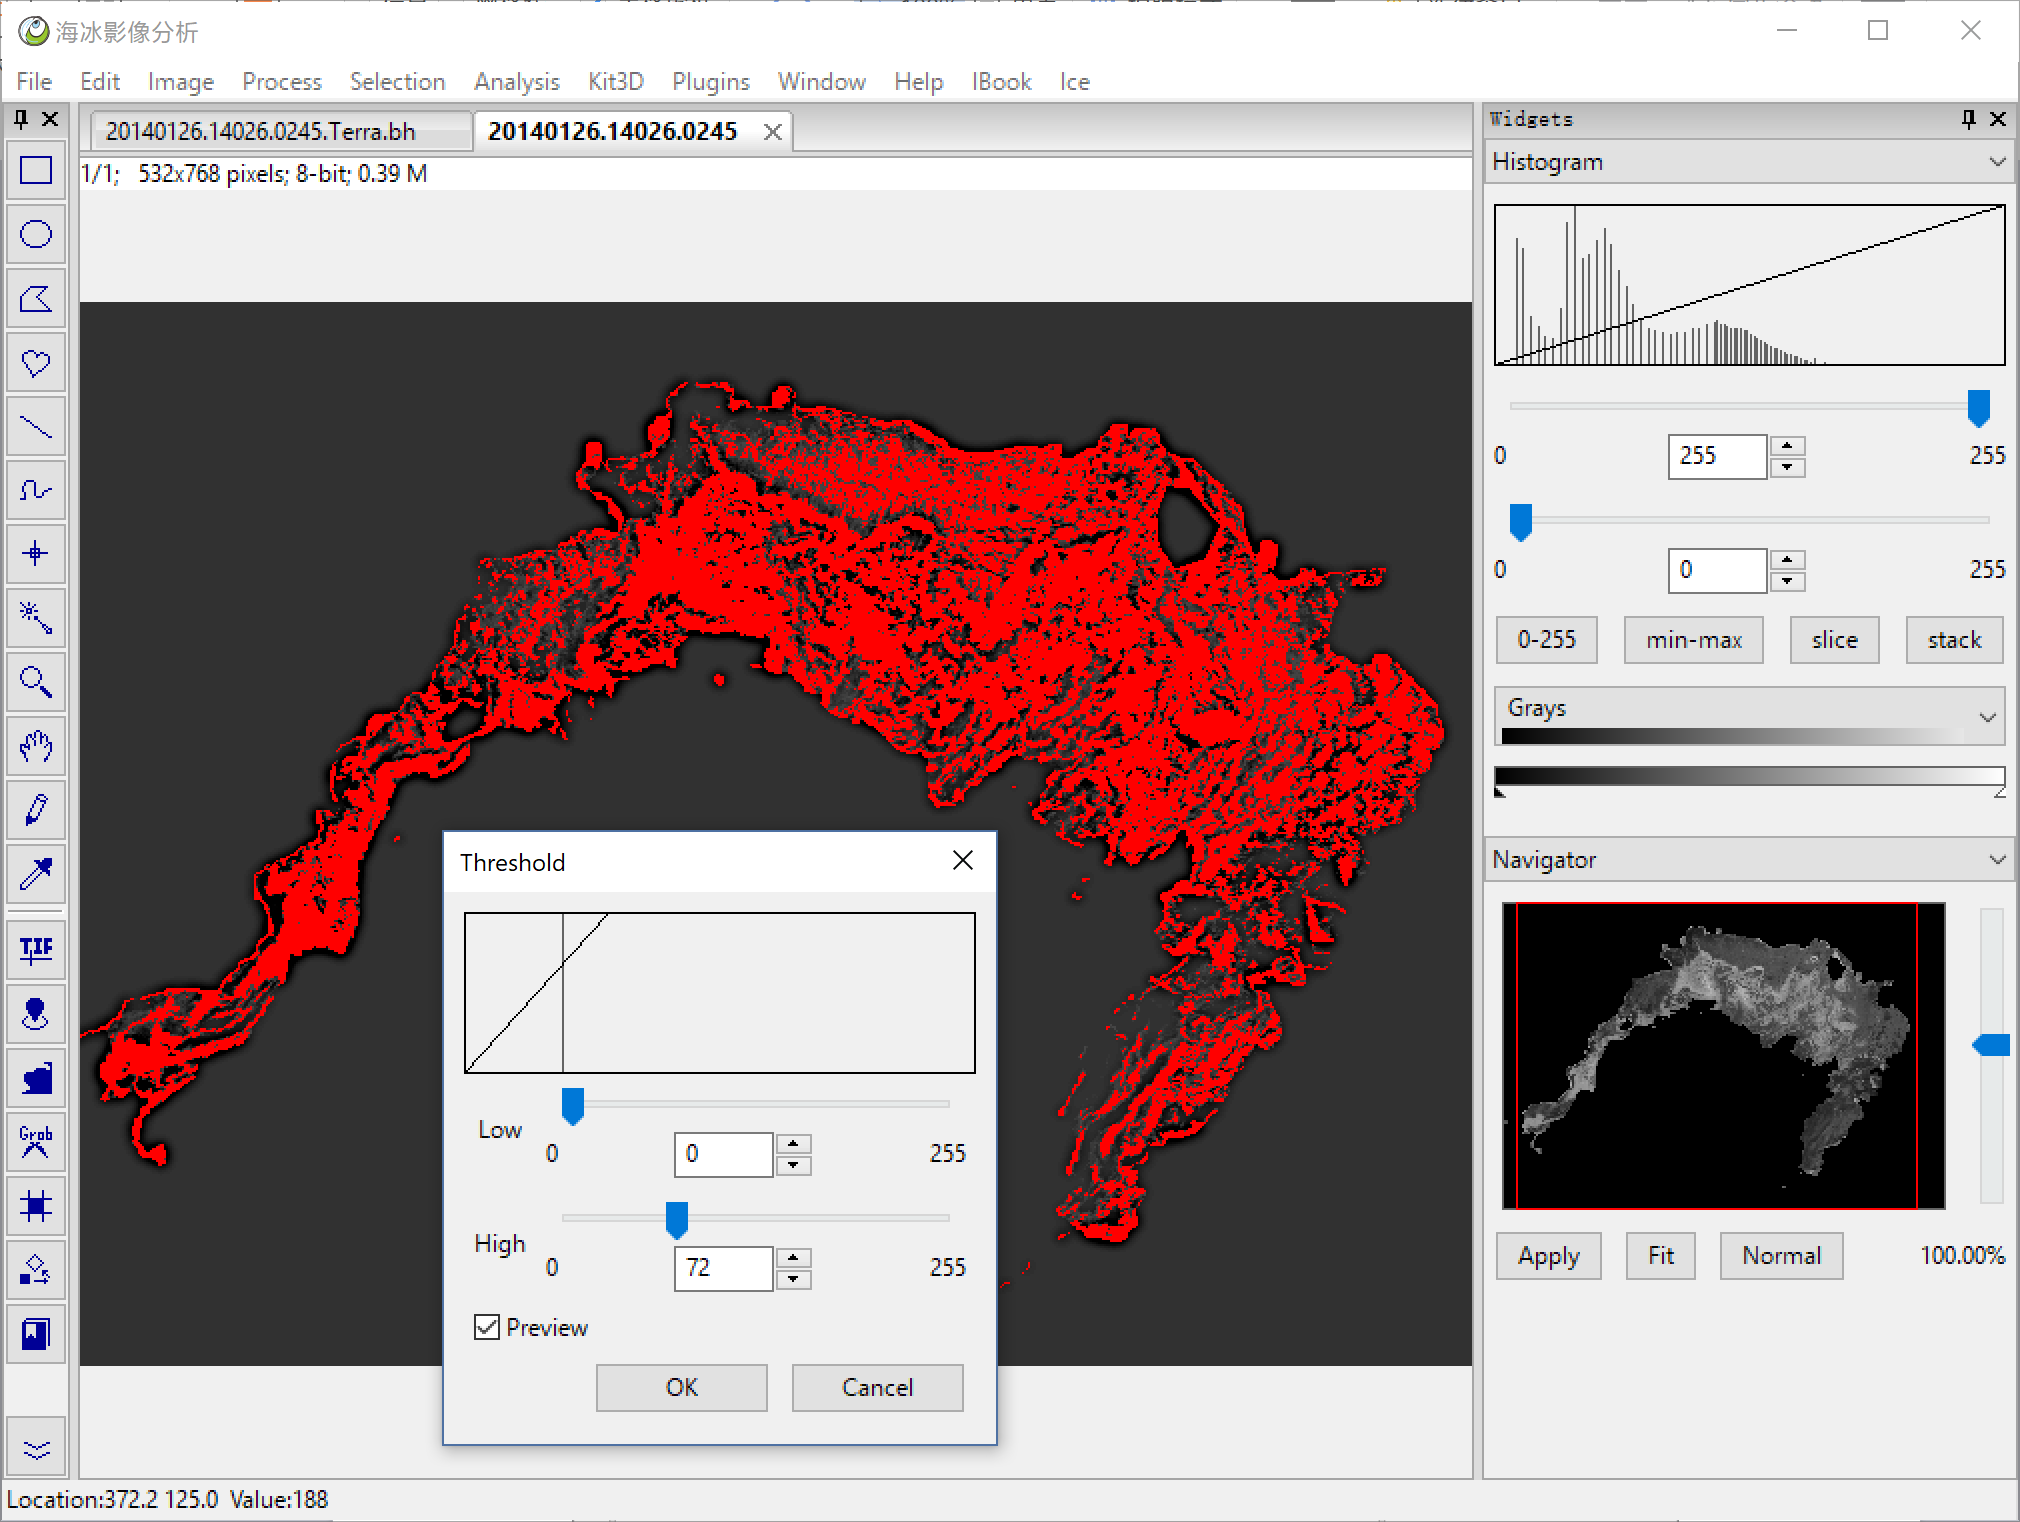
Image > Adjust > Threshold do a threshold, then we got the binary mask.
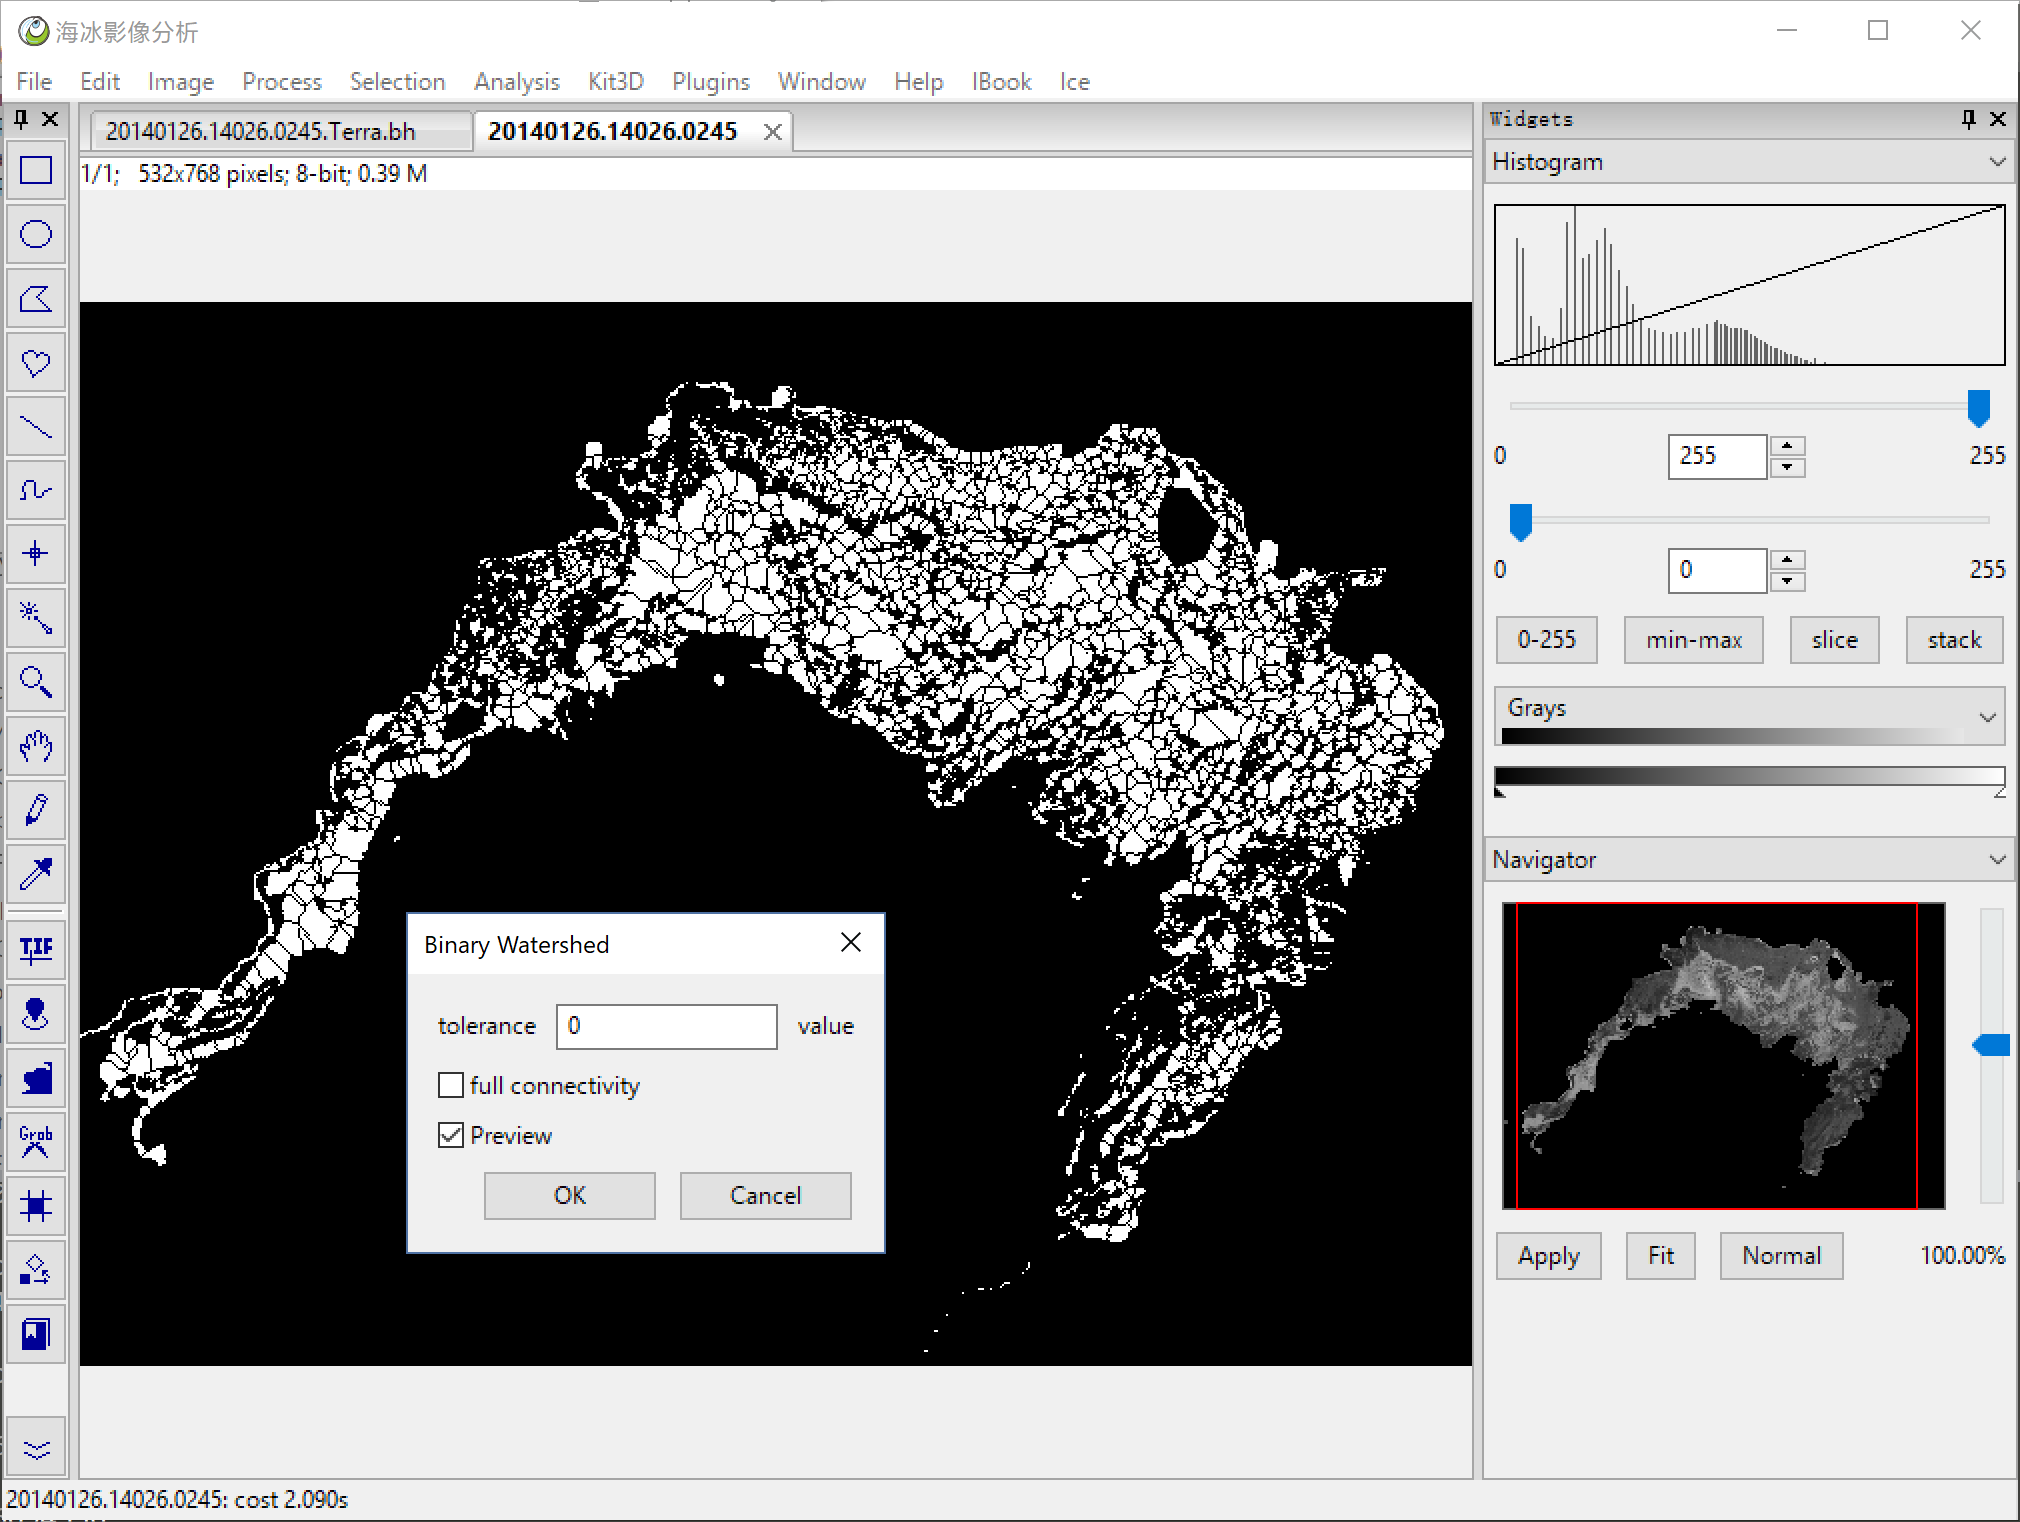
Process > Binary > Binary Watershed do a binary watershed, segment the binary mask in fragments.
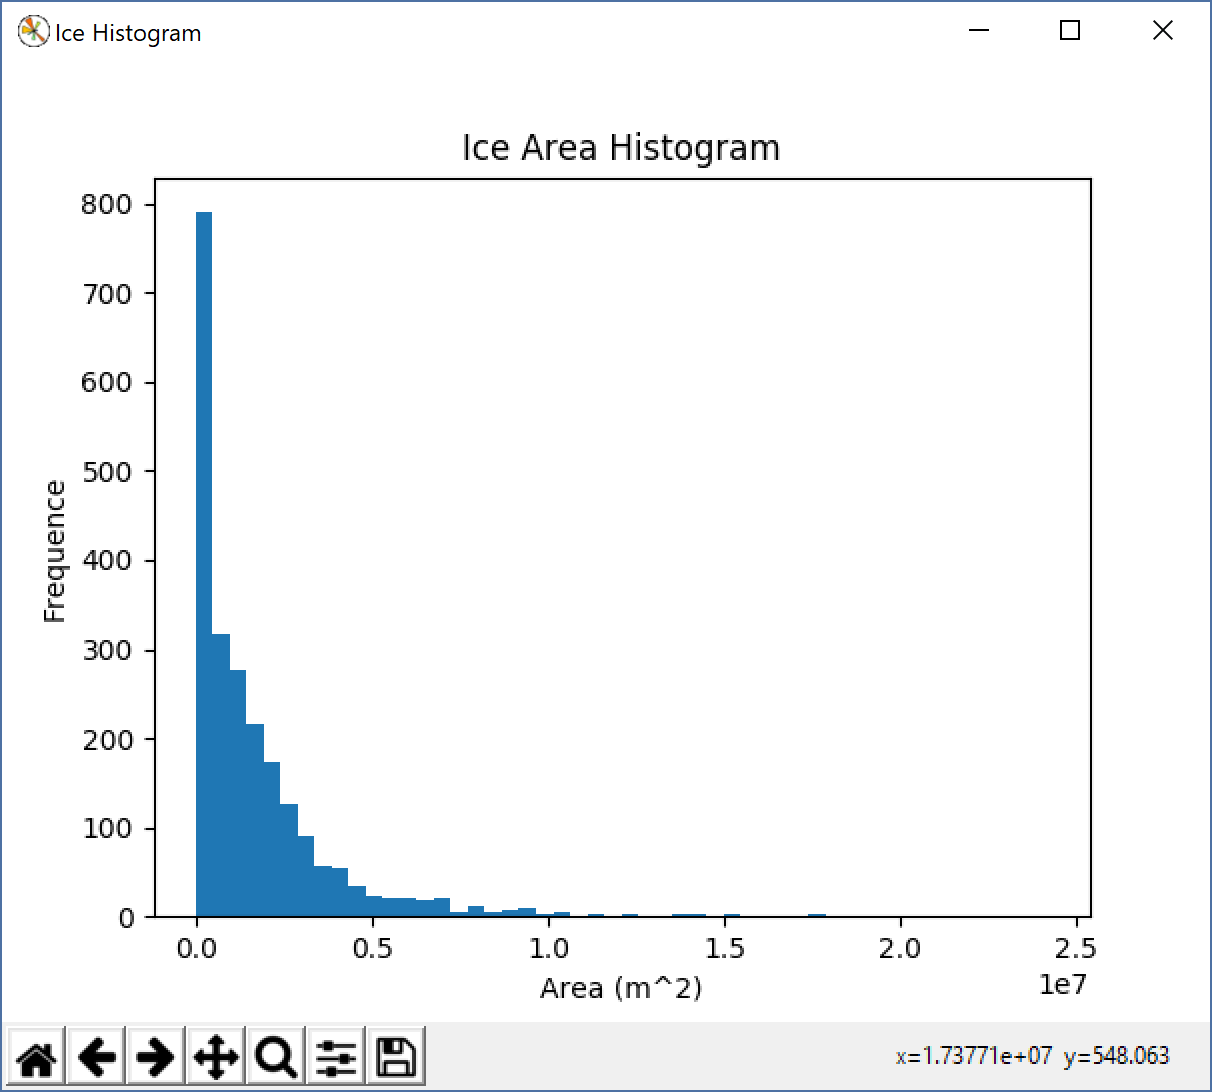
Ice > Ice Statisticnt statistic the all fragments, draw a area/Frequence graph.
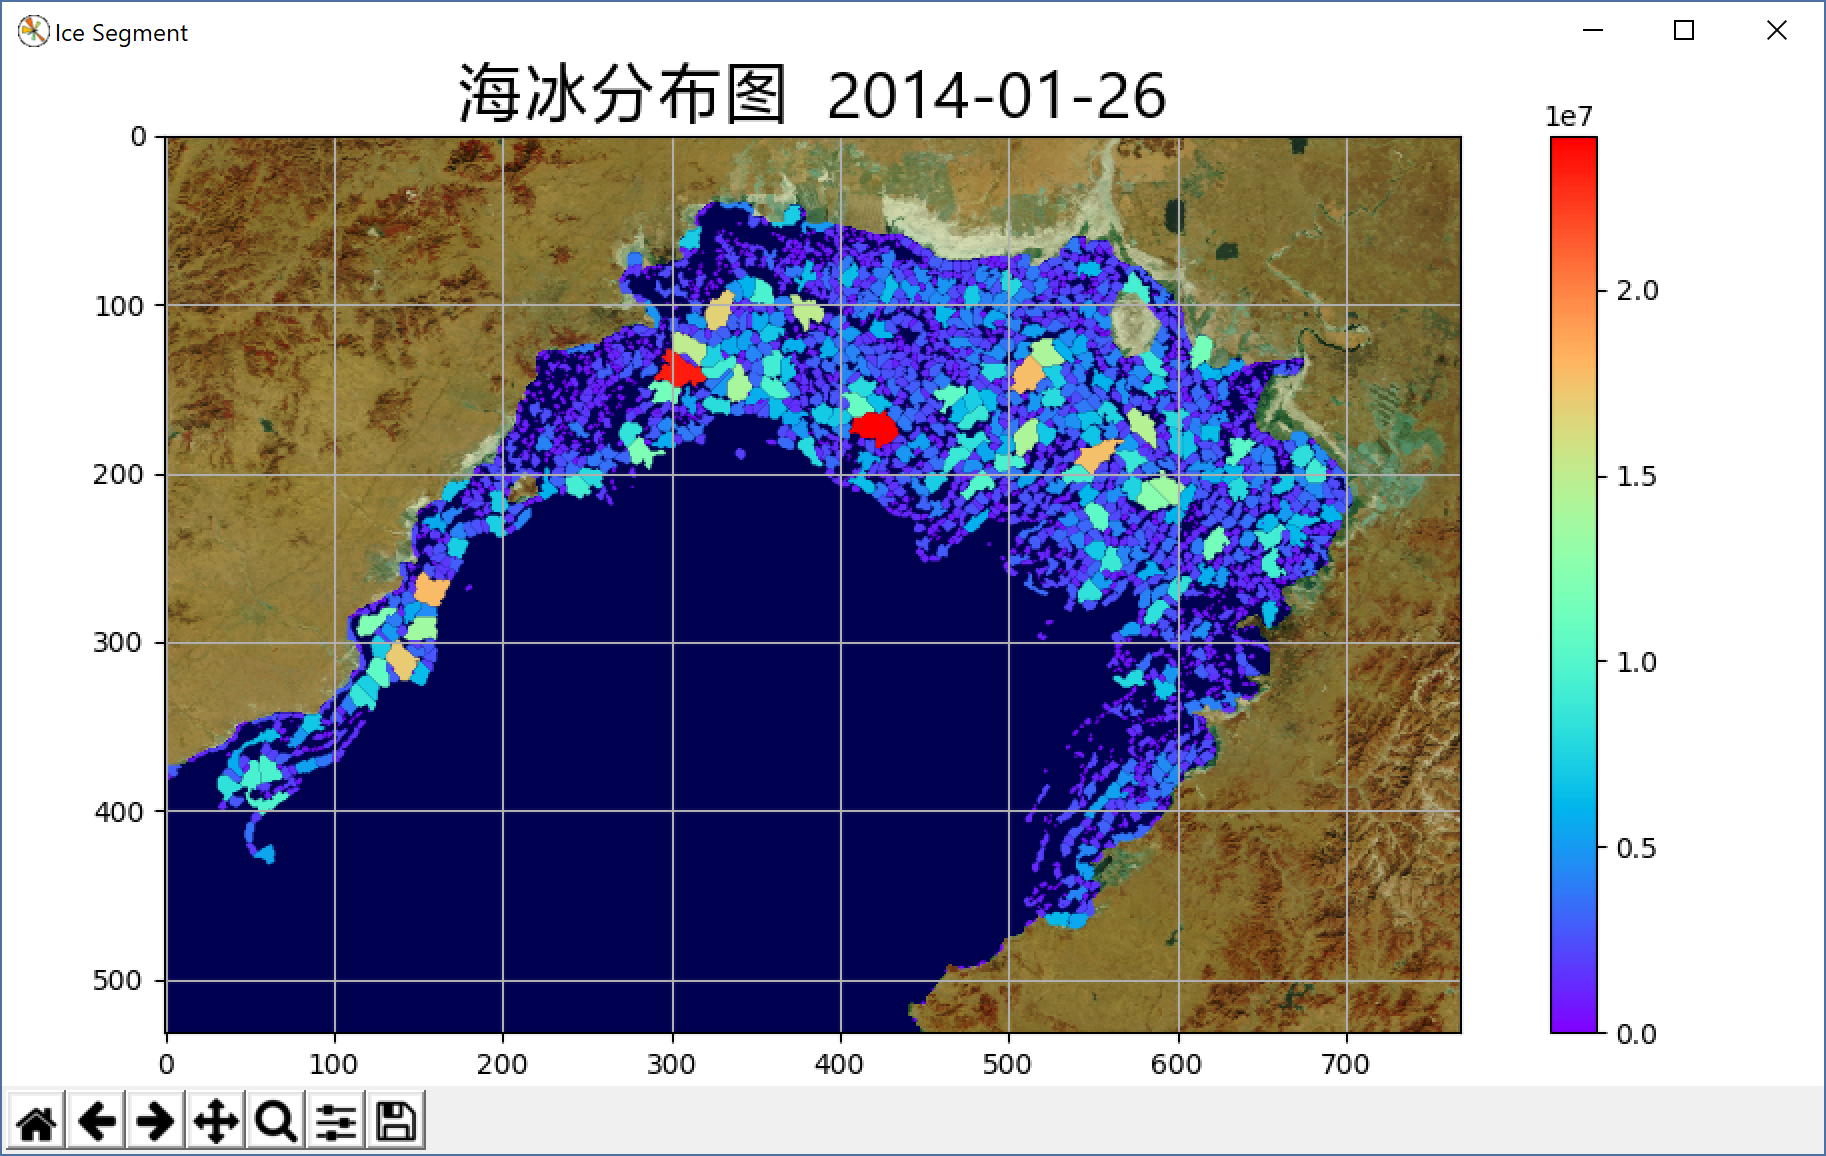
Ice > Show Resultl after the segmentation, we can make a colorful report, which show the Ice distribution.
you can also use Ice Export To Shapefile, Ice Export To WKT to save the result as a shapefile or wkt file.
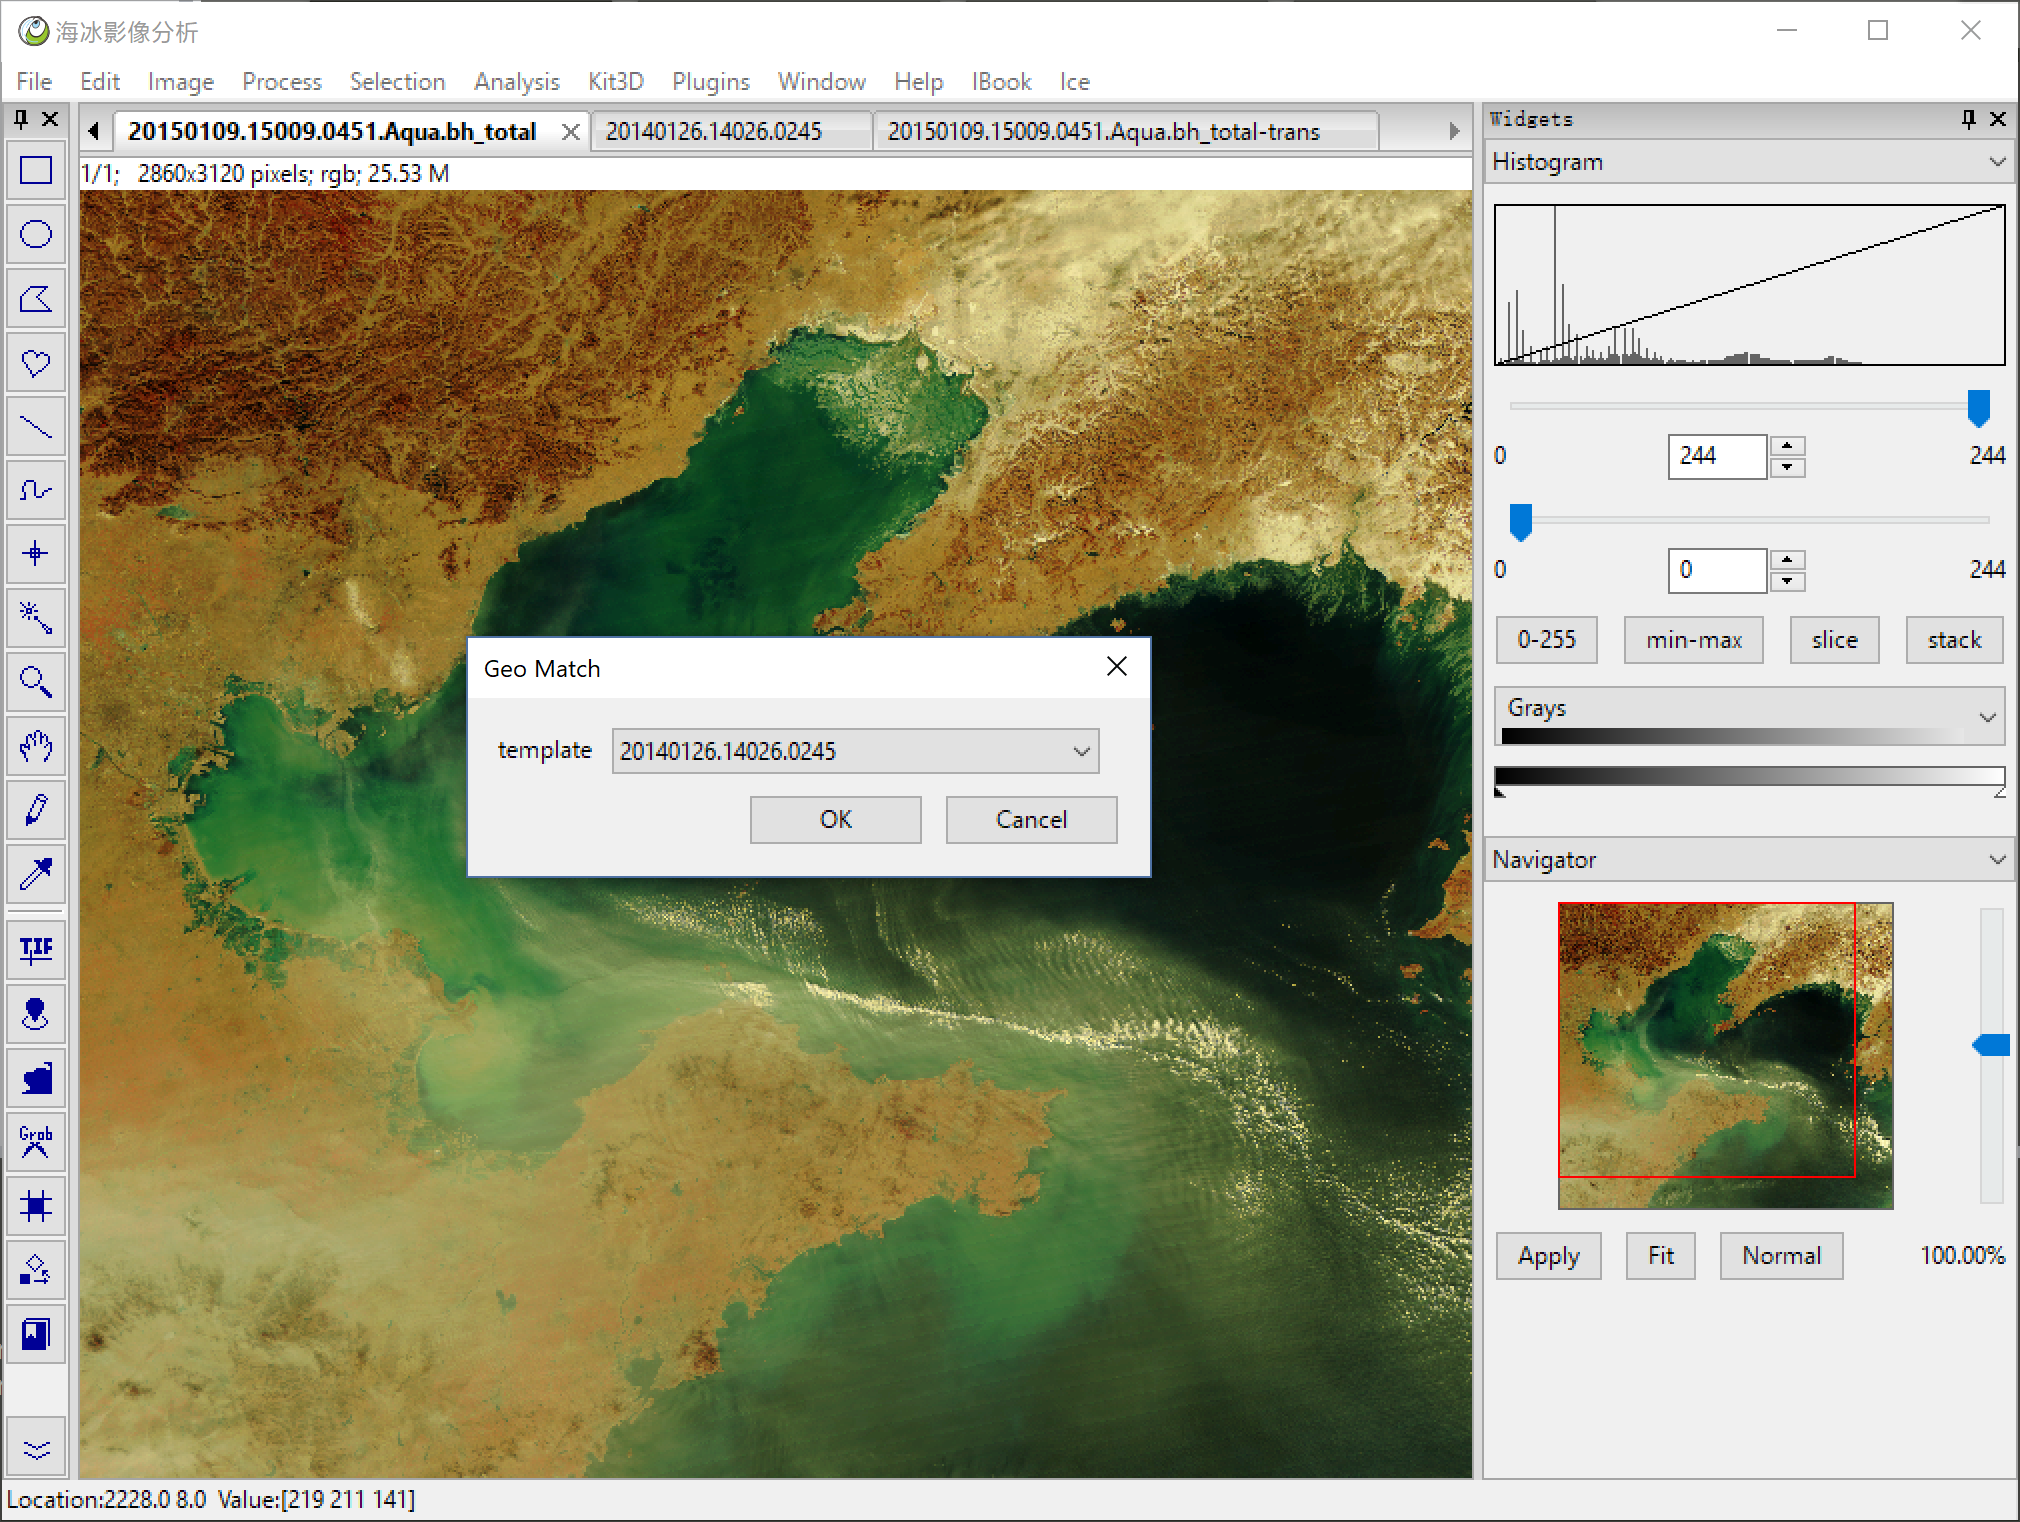
Ice > Geo Match because we has geo project information, so we can match two images exactly.
then extract the ice area from the two images just like befor.
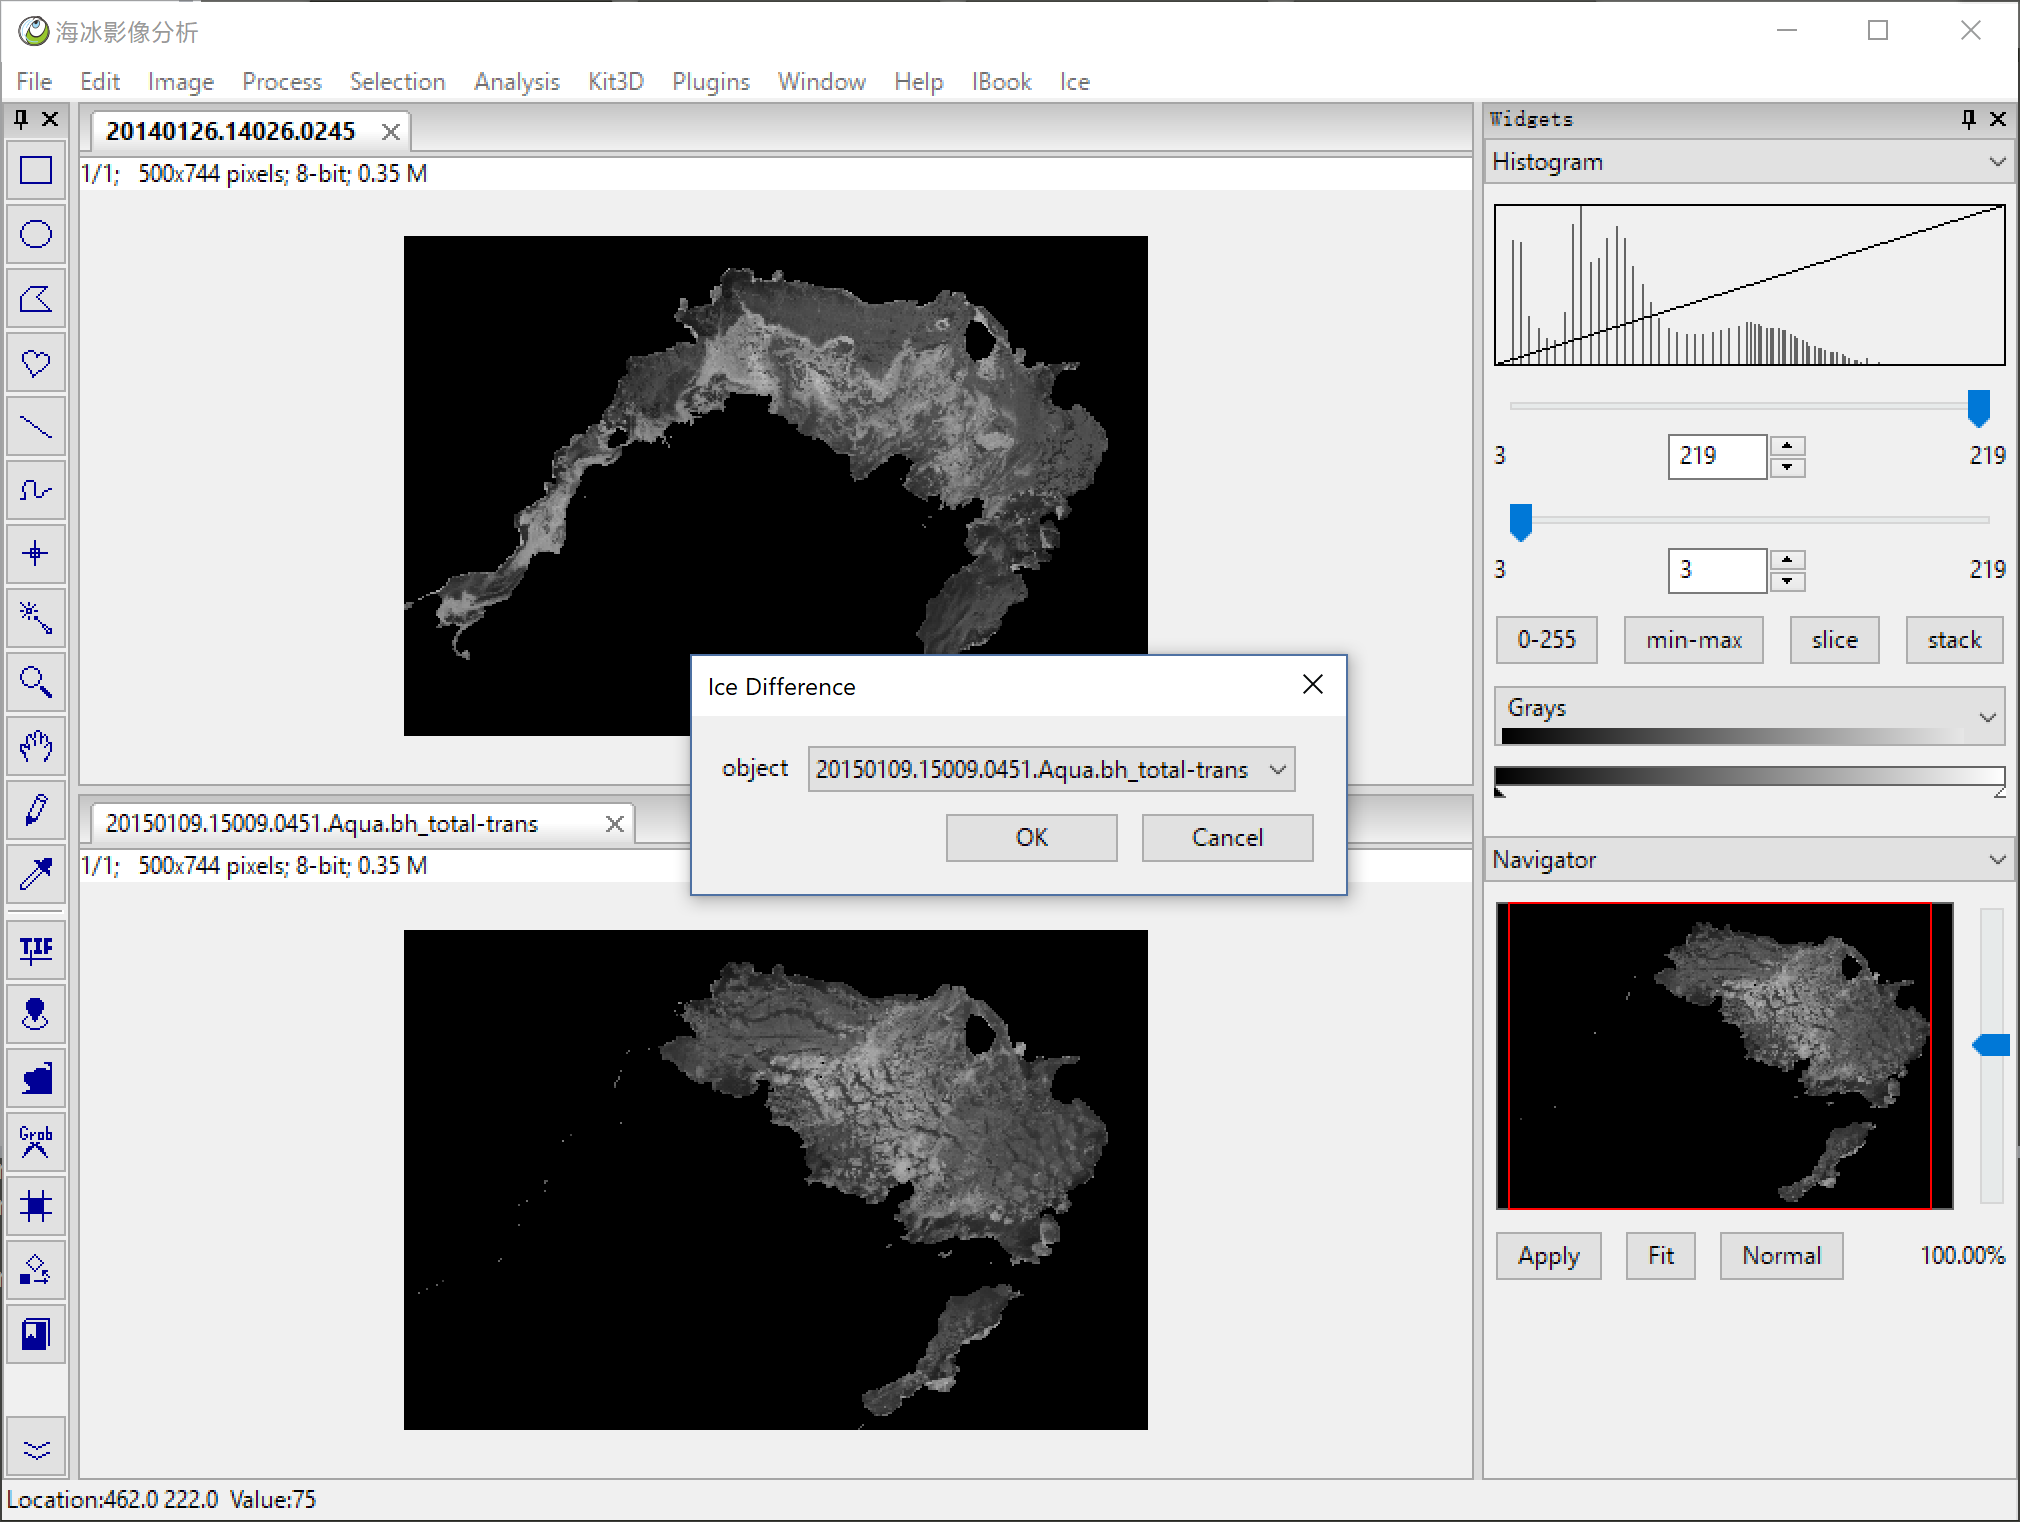
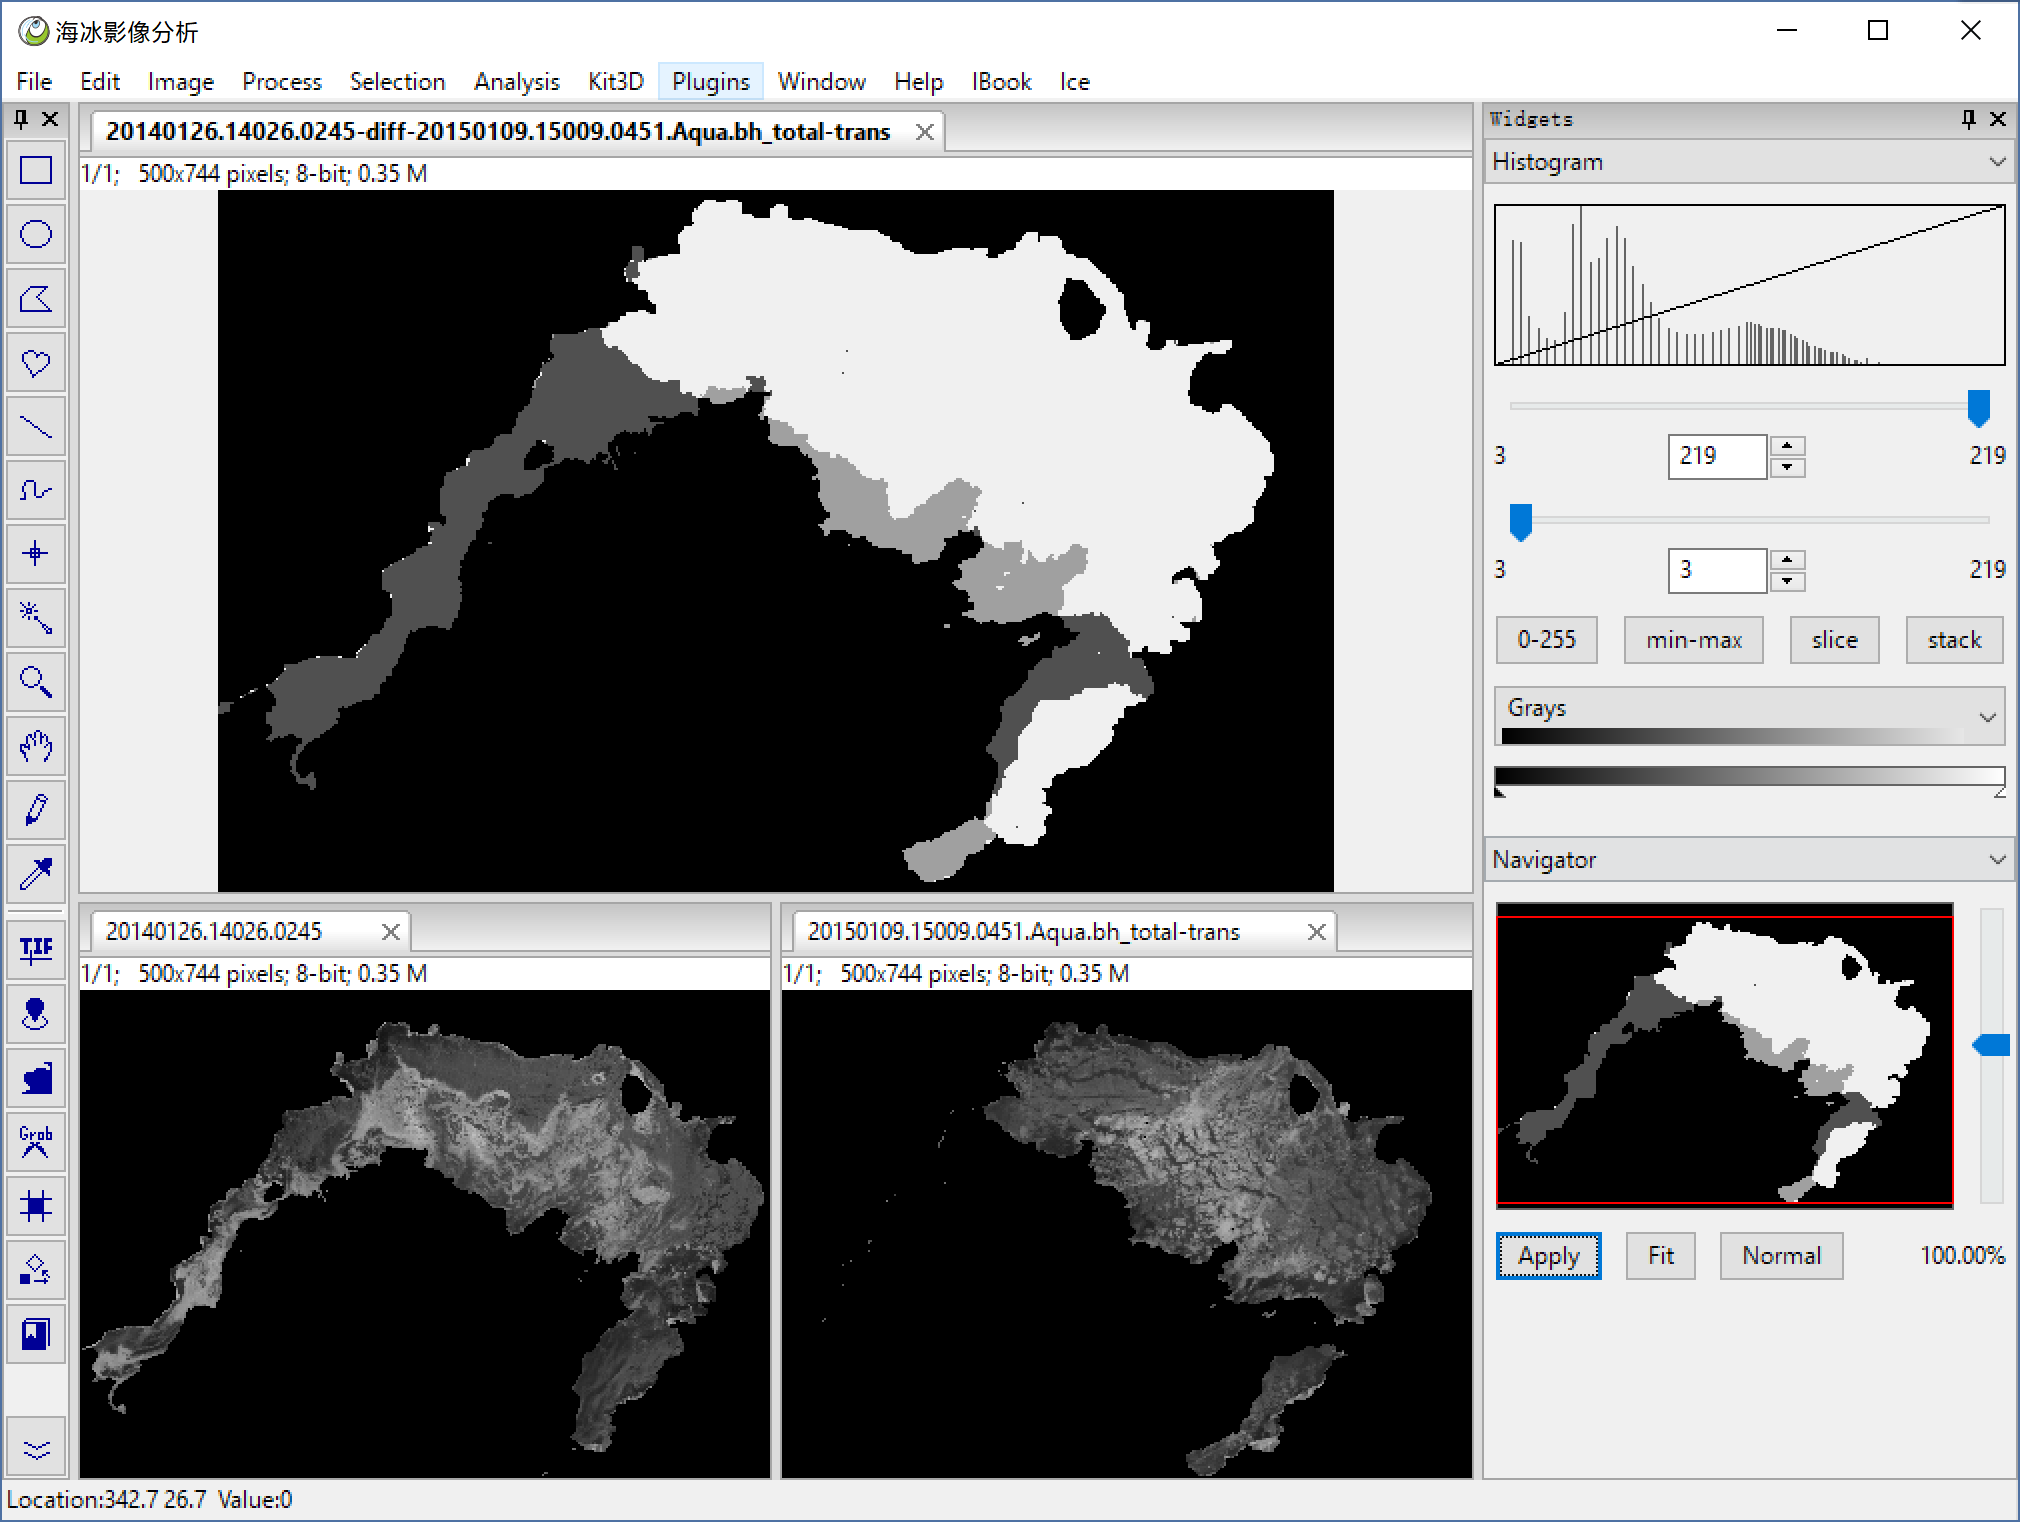
Ice > Ice Differenc we got a new image, which has 4 colors. both water, both ice, the new ice, water->ice, ice->water.
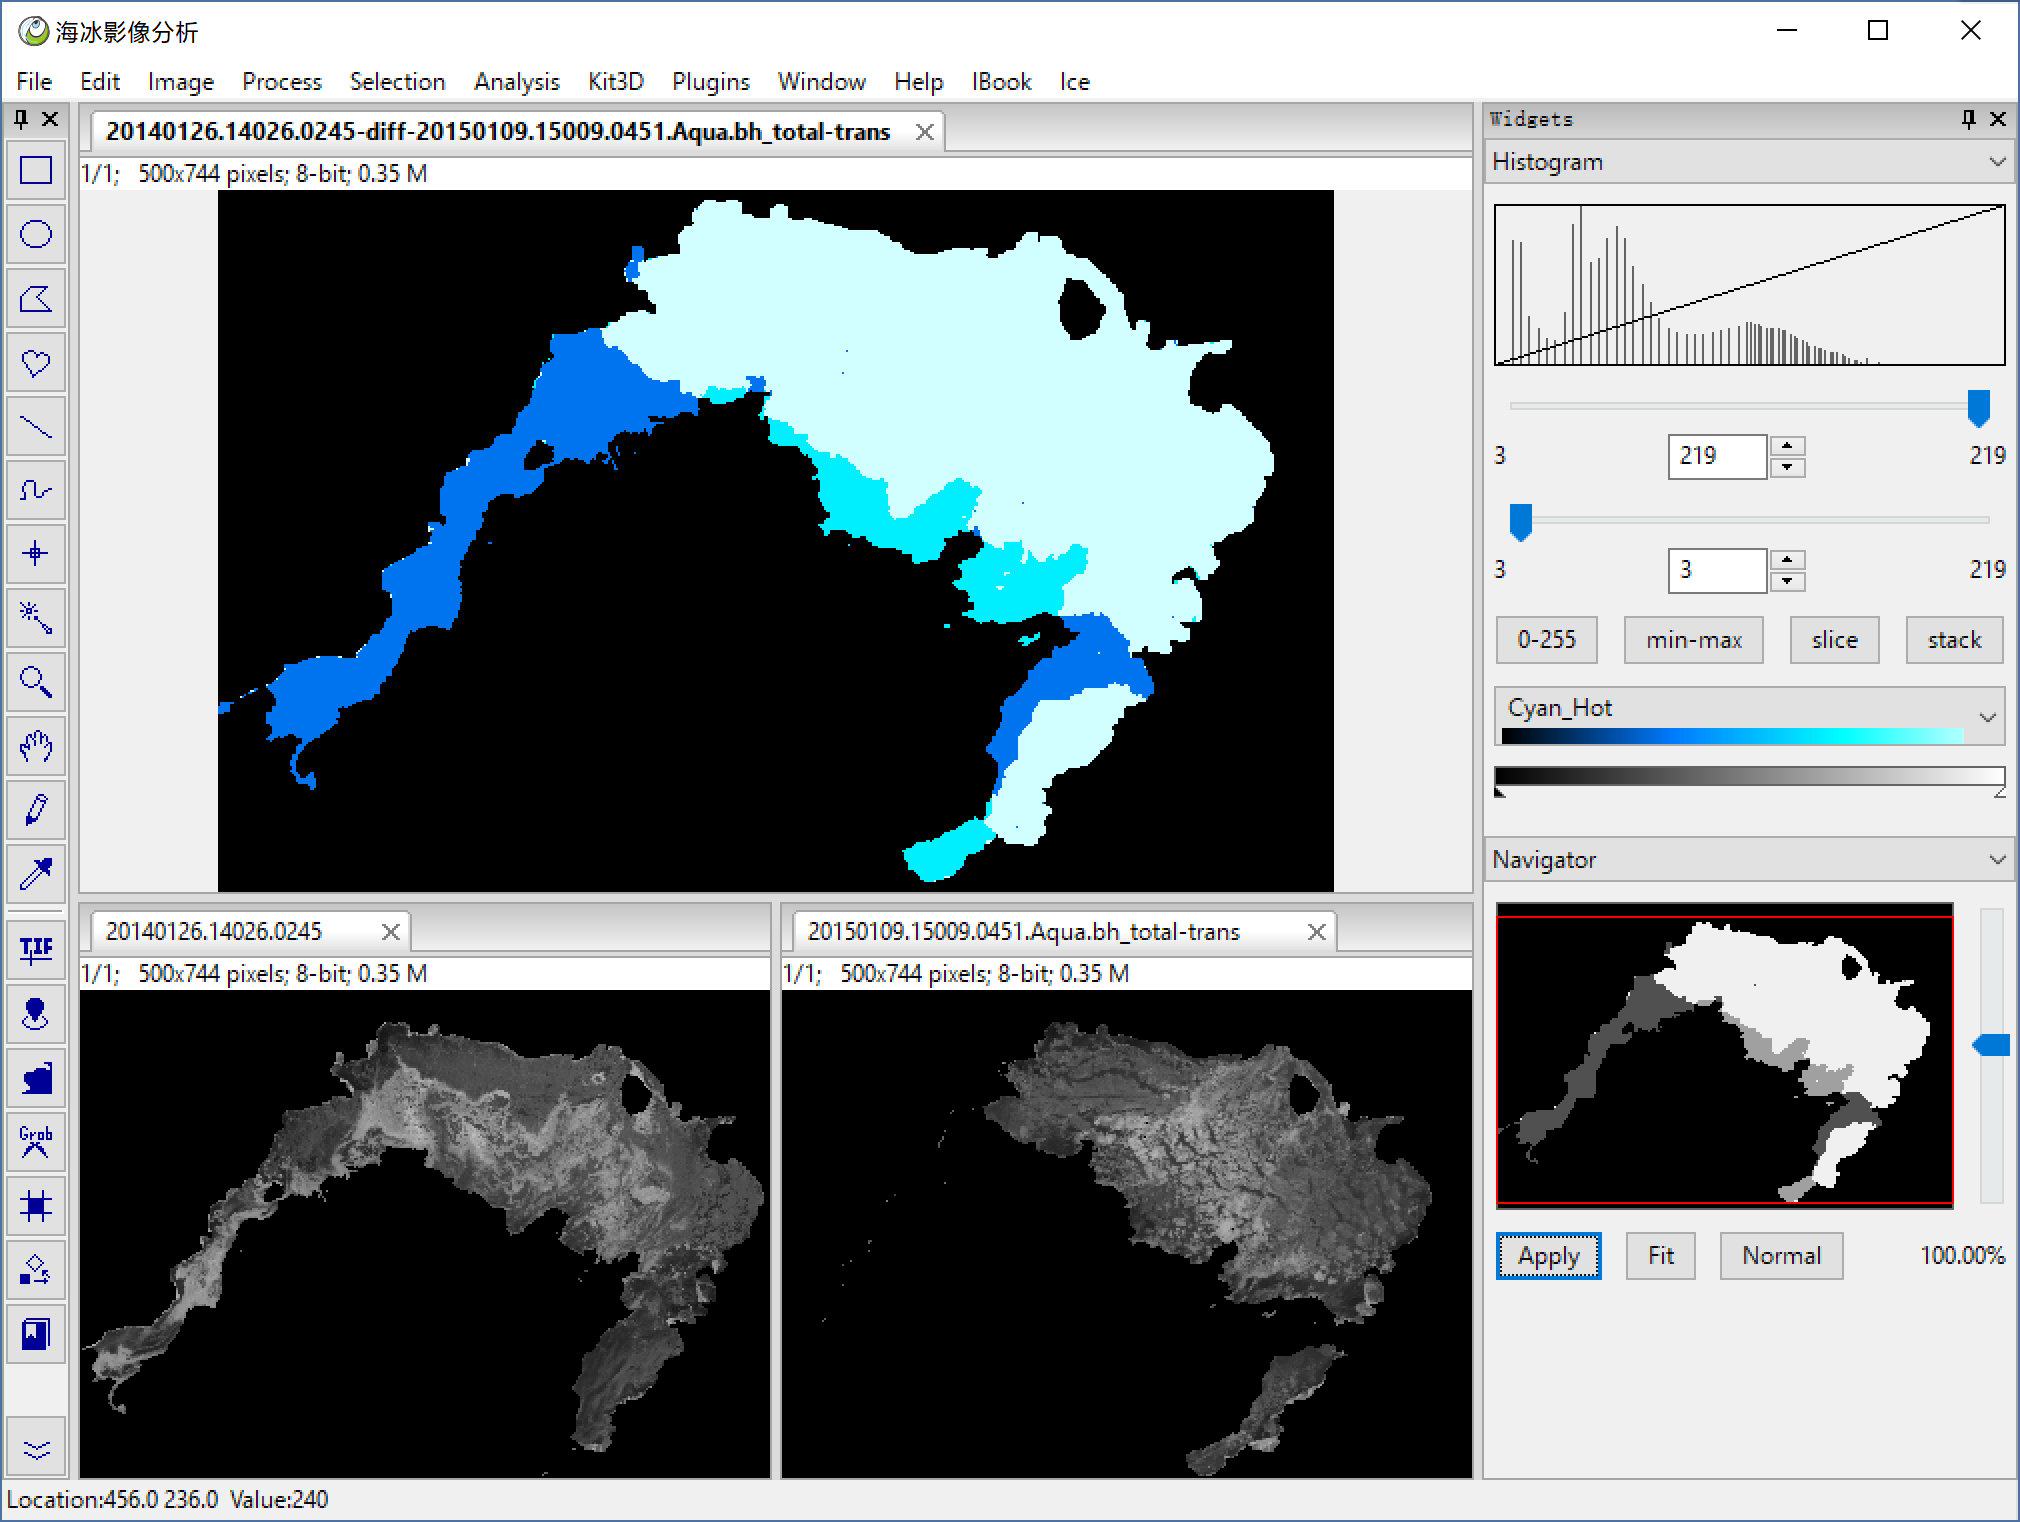
choose a blue color map
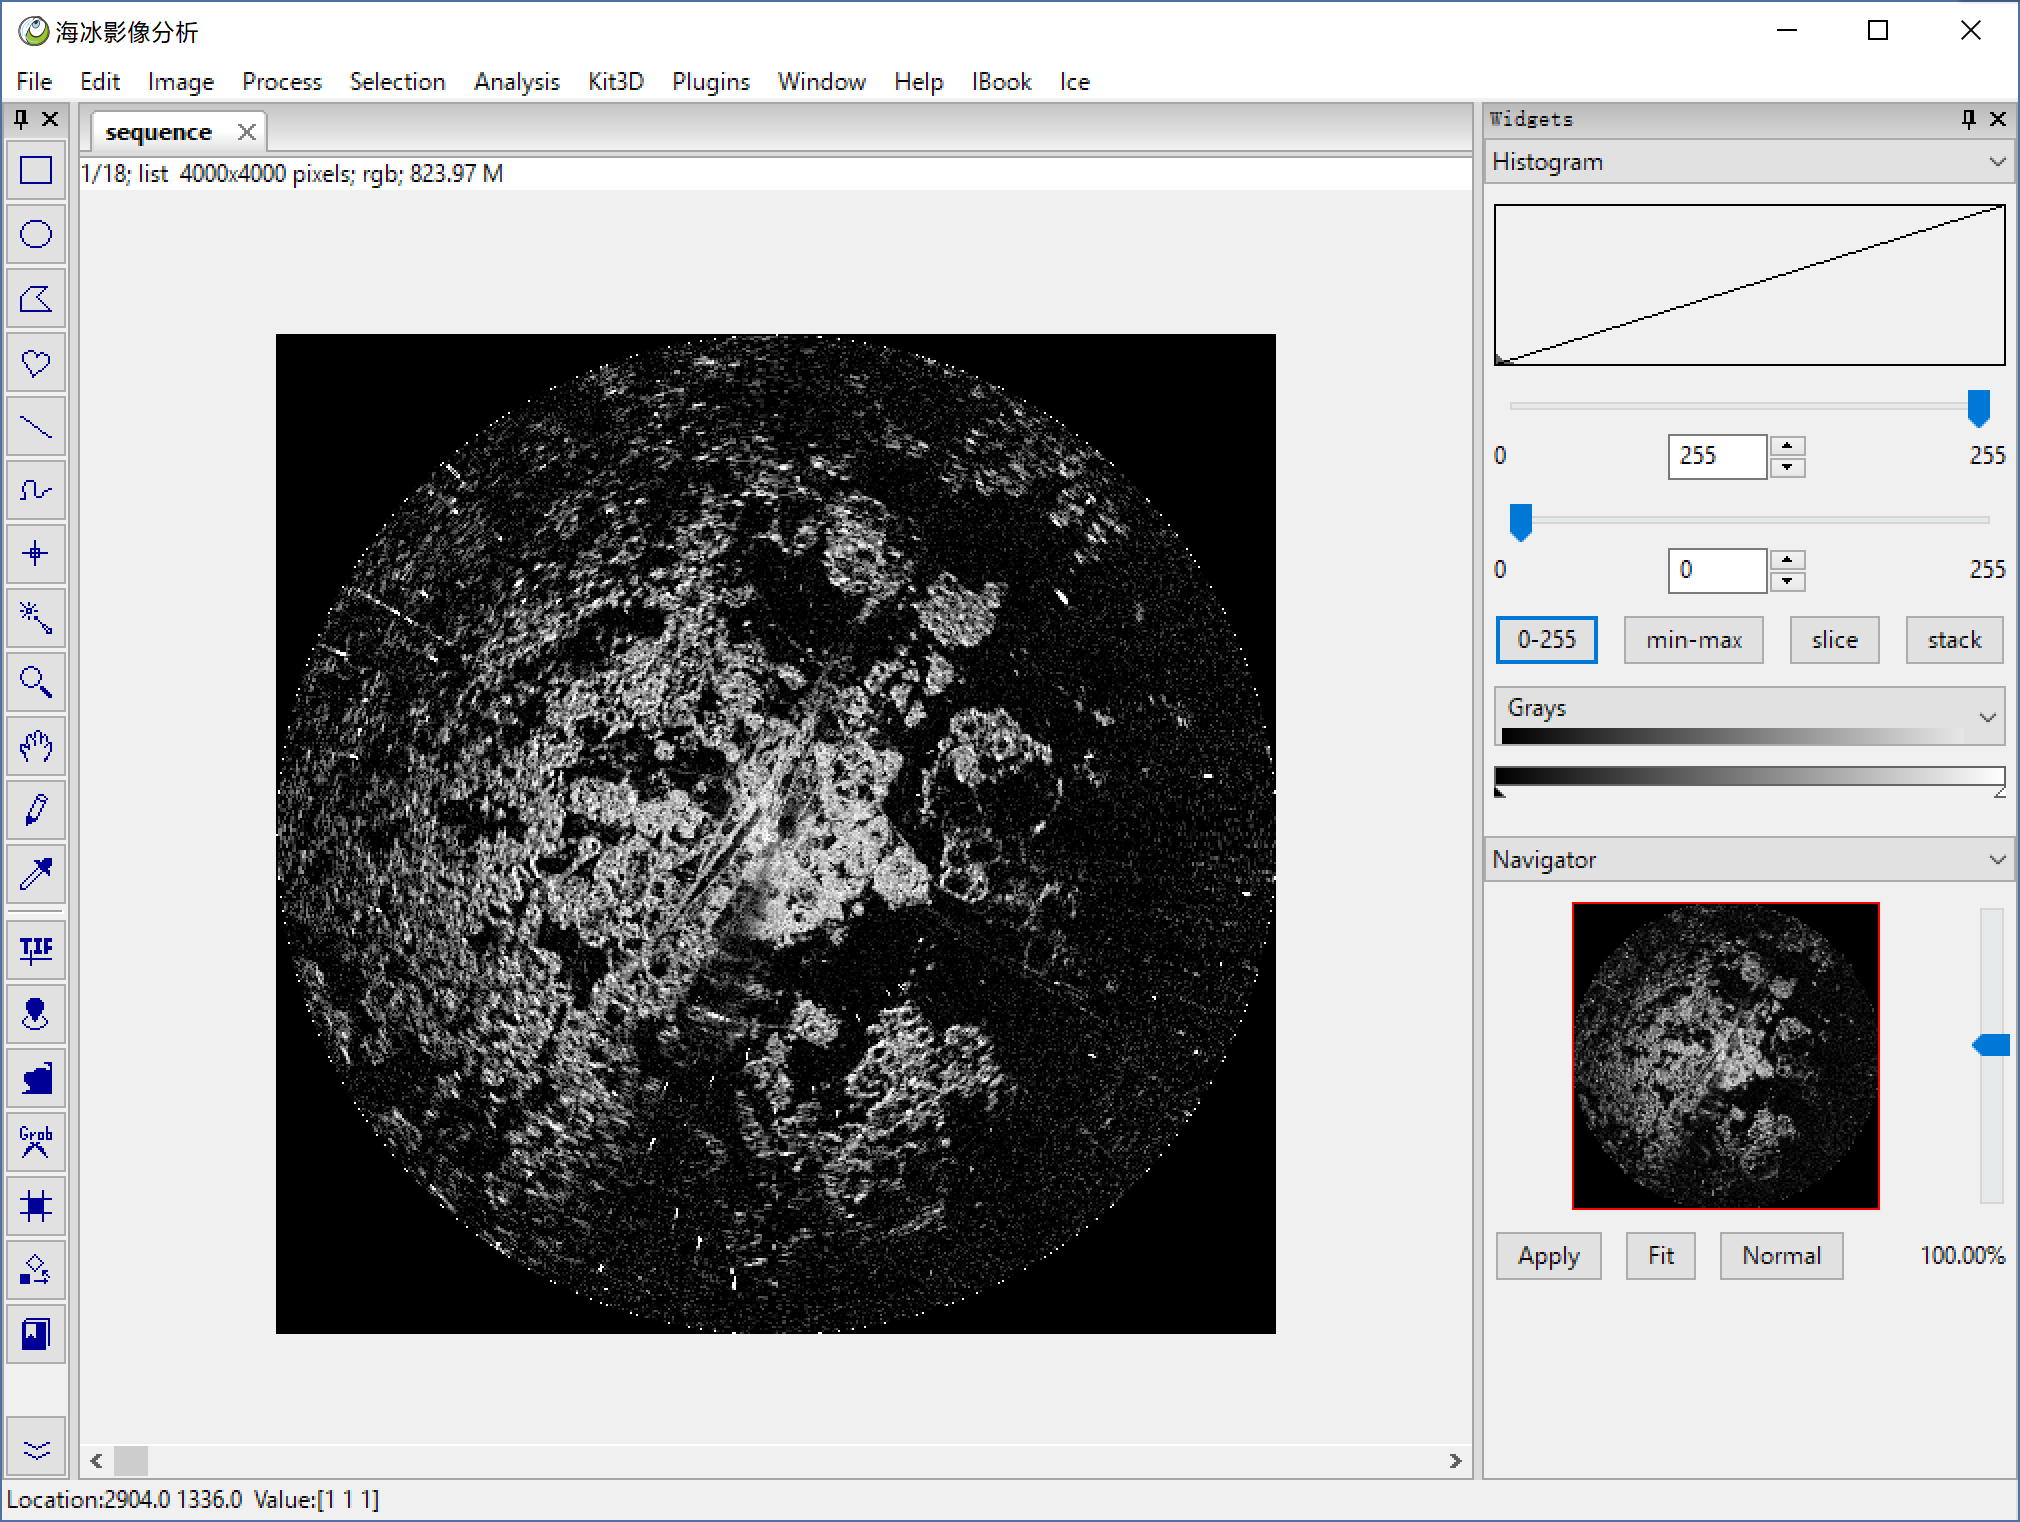
Here are some thunder time series image data, we need detect the water's direction and velocity from the time series. You can follow the method below, And you can also use Ice > Move Detect Demo, you can got a macros like an animation.
File > Import Sequence to import image sequence, or you can use Ice > Thunder Sequence open the demo data.
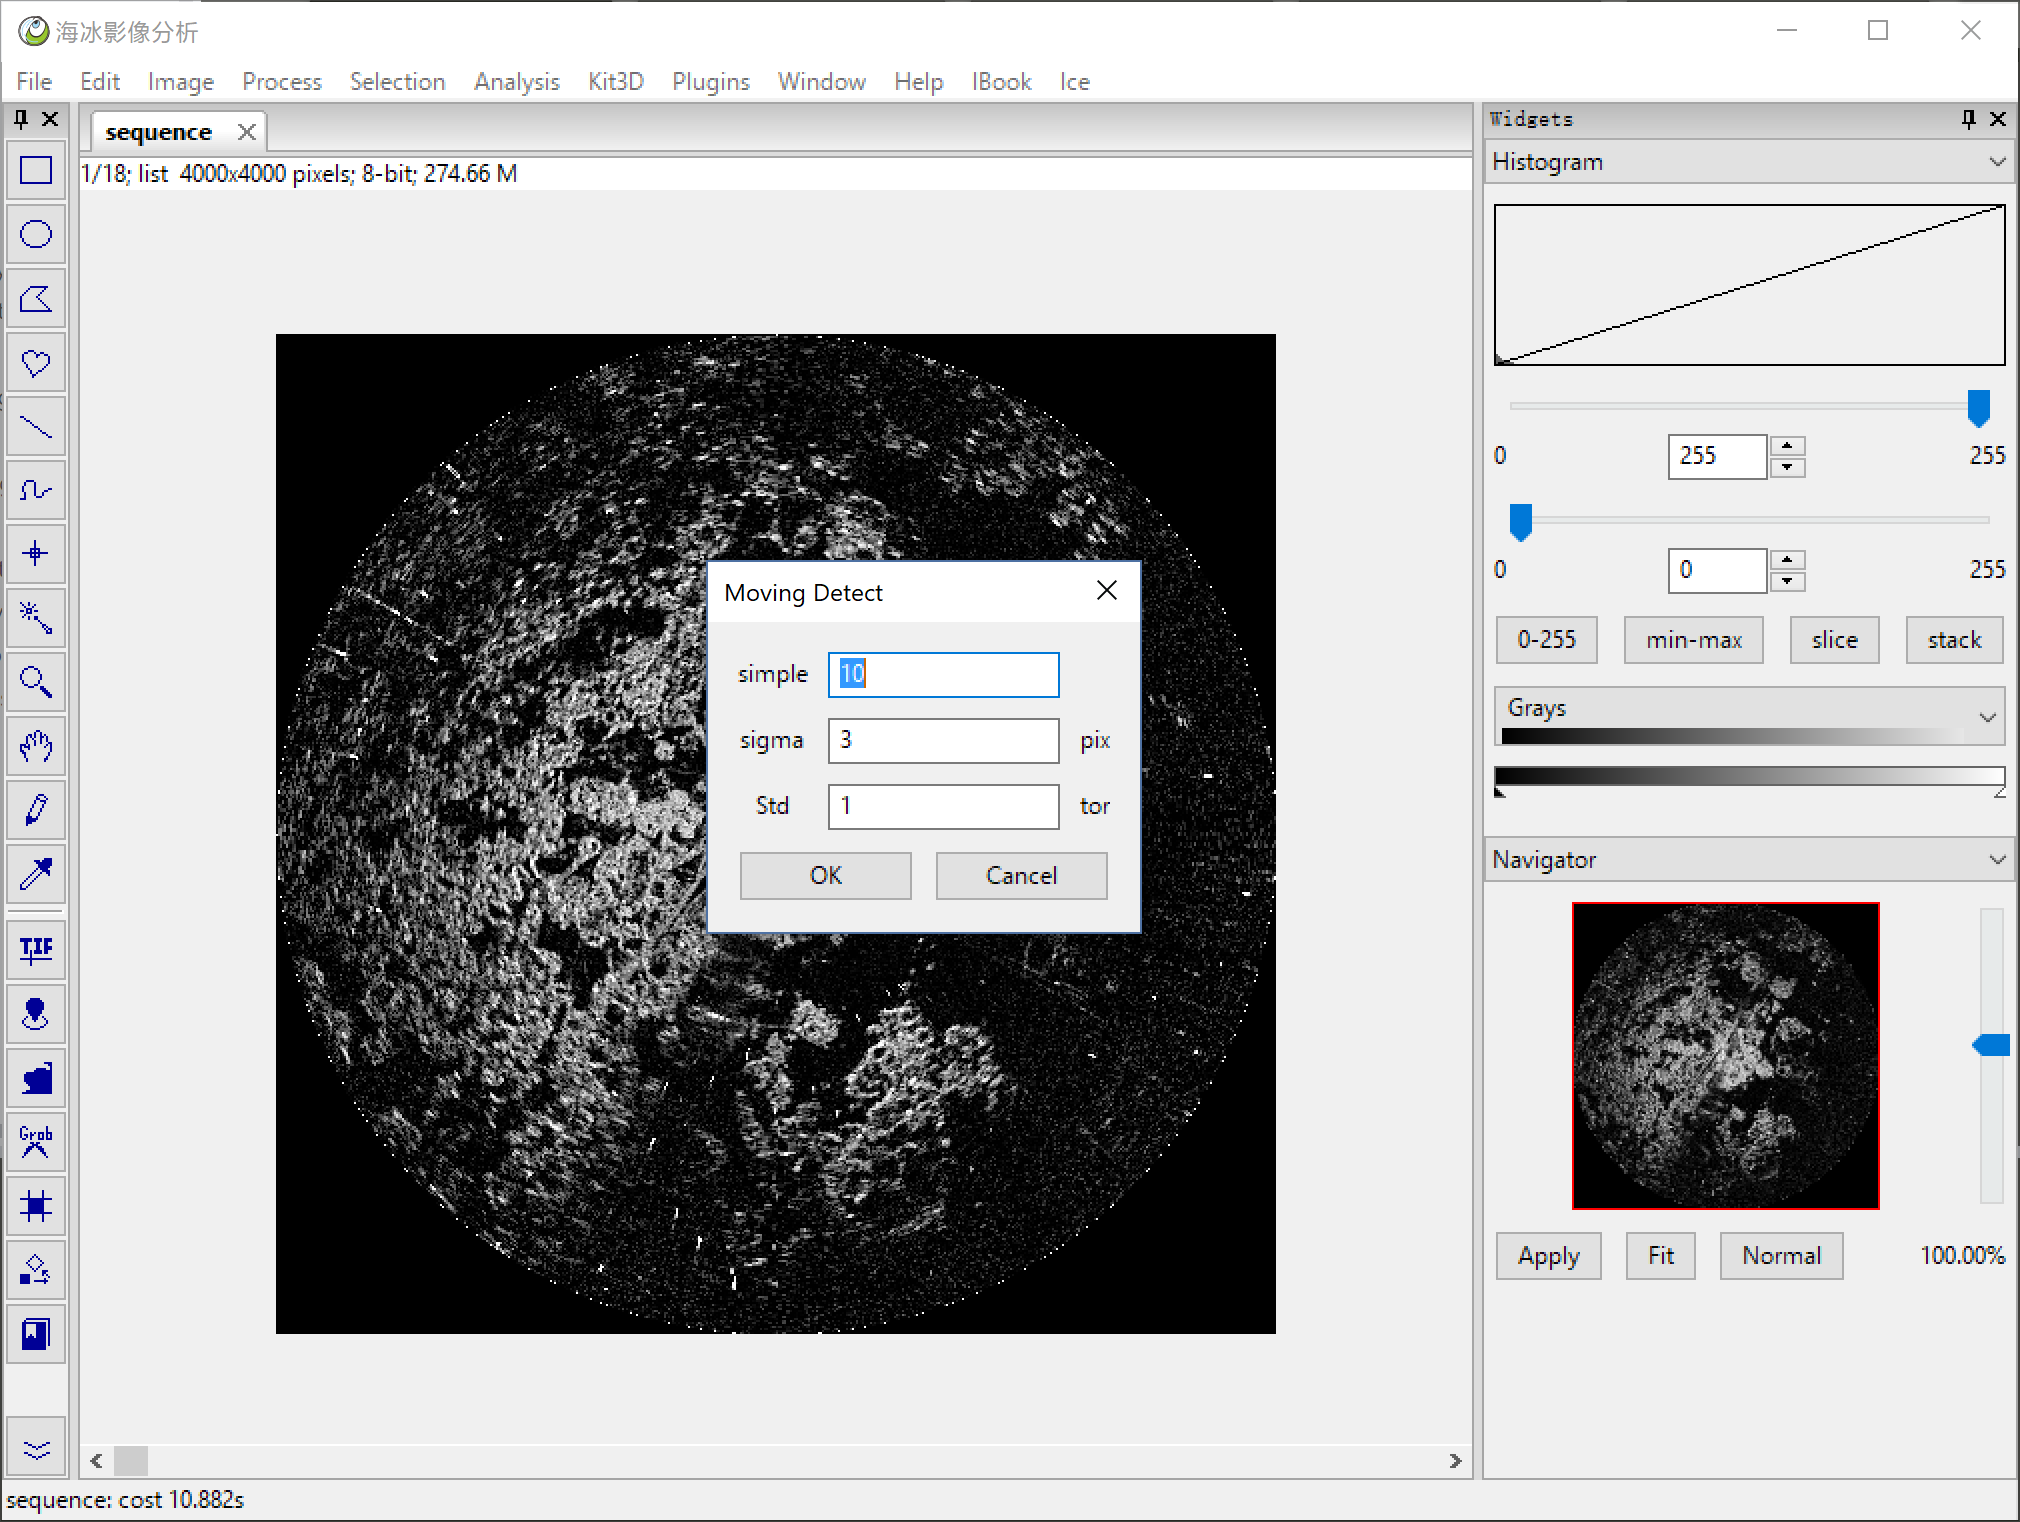
Ice > Move Detec moving detect use scikit-image's orb feature descripter do match within each slice, sample means the down sample scale, sigma means do a gaussian befor the feature extract, and std means the limit when count the affine matrix.
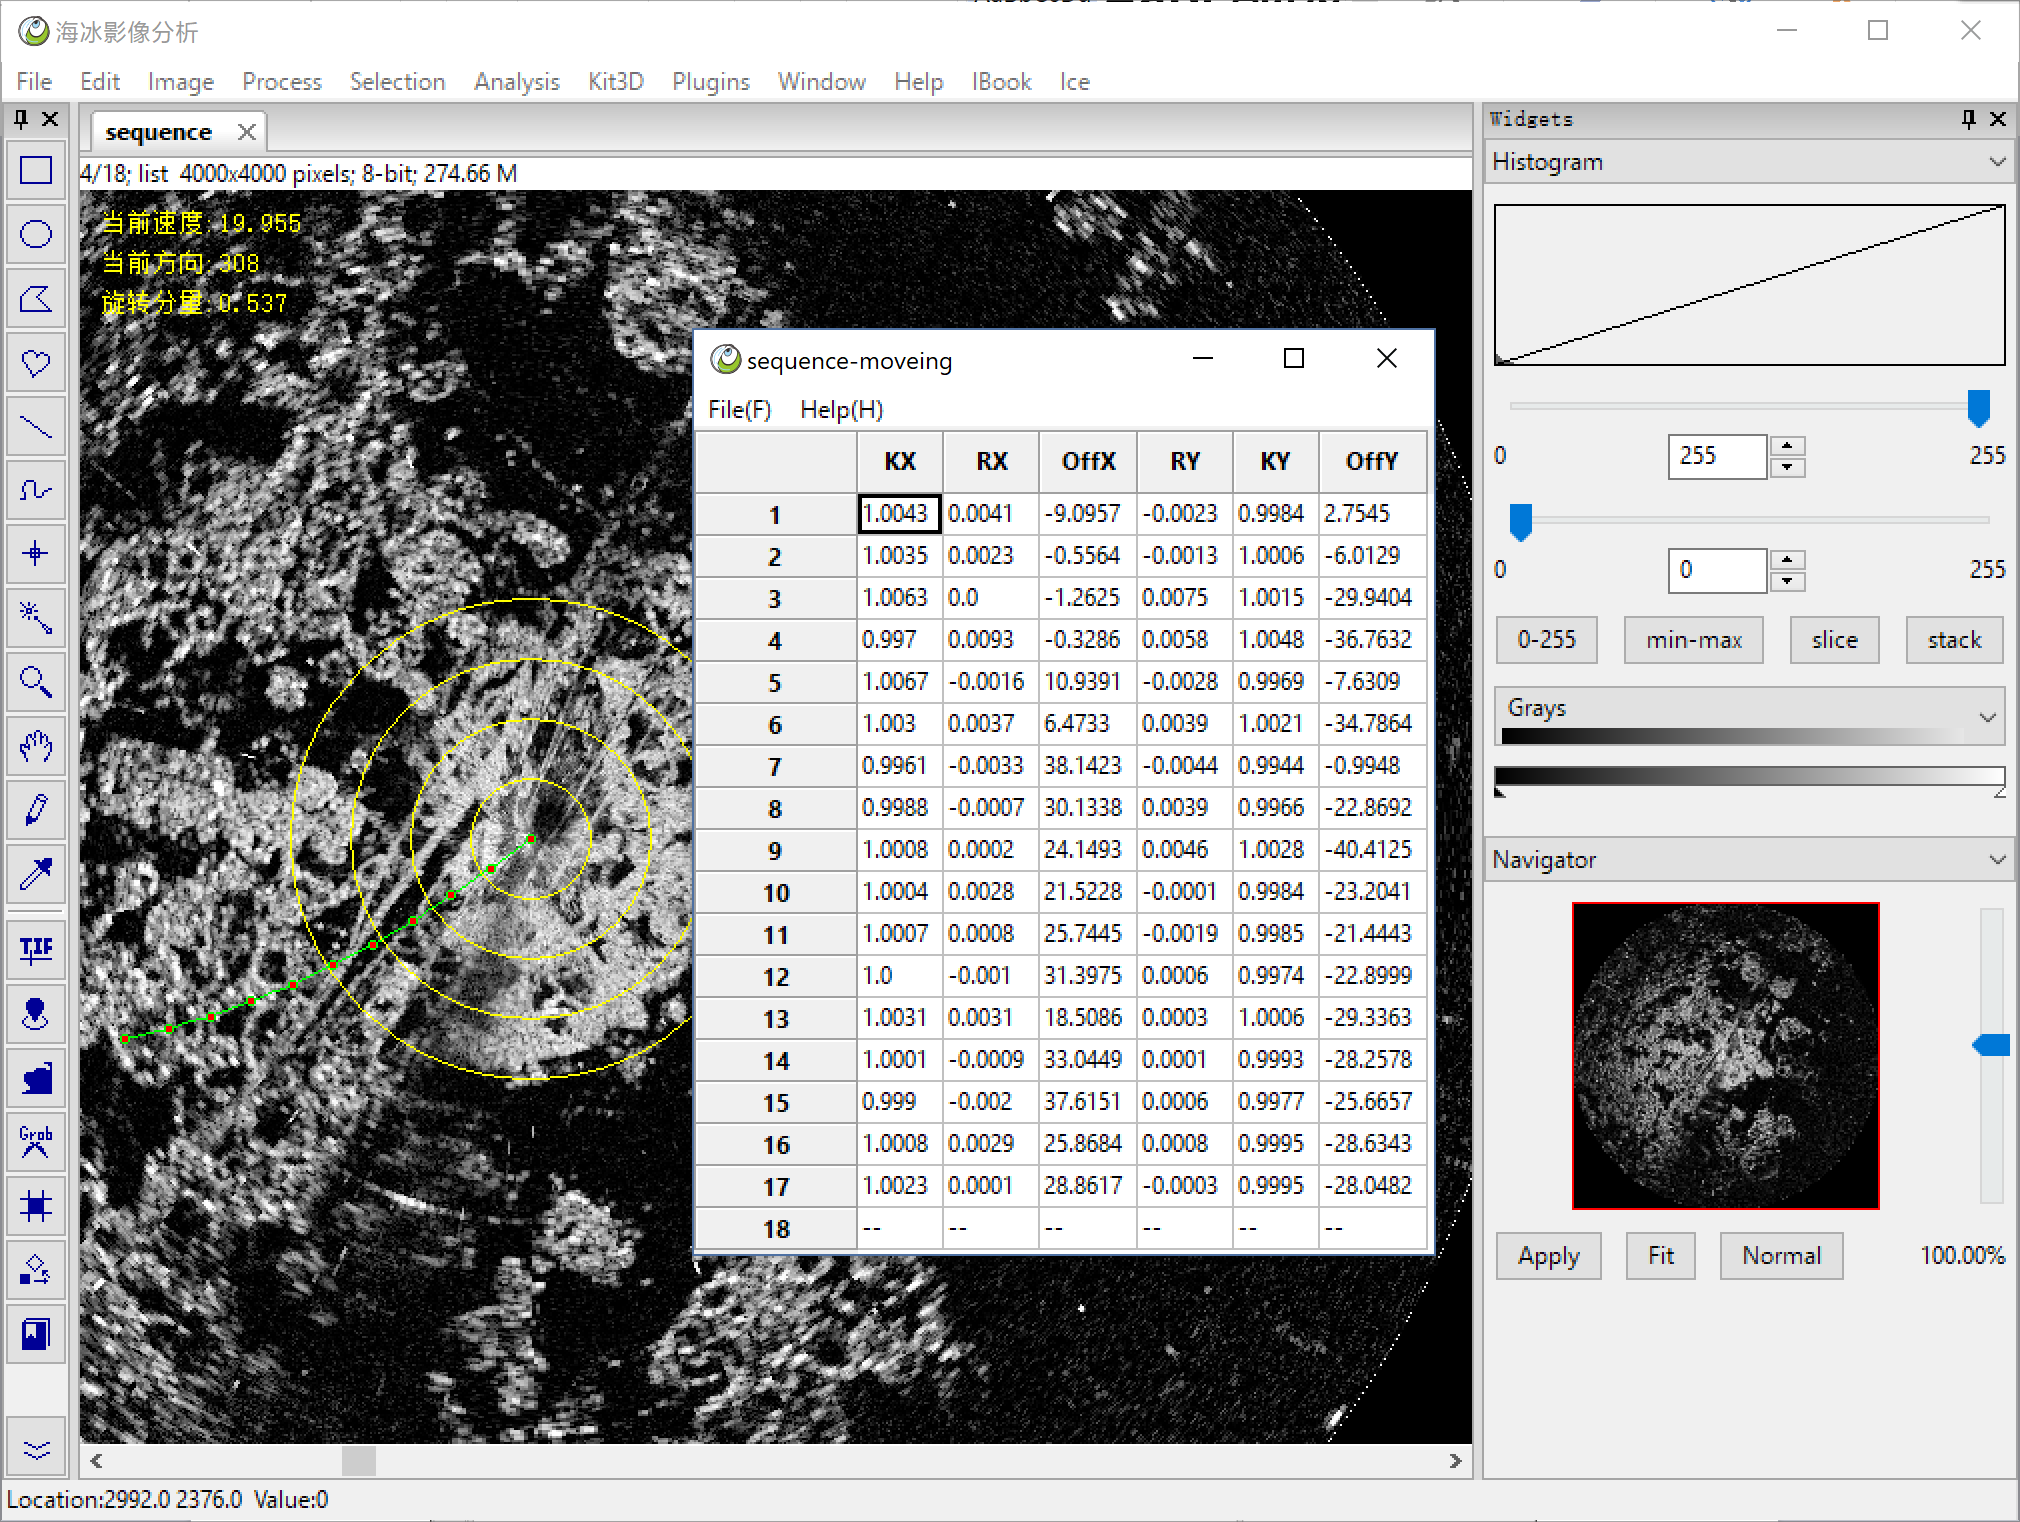
then we got a table, each row means one transformation, and mark the current velocity and direction on the image.
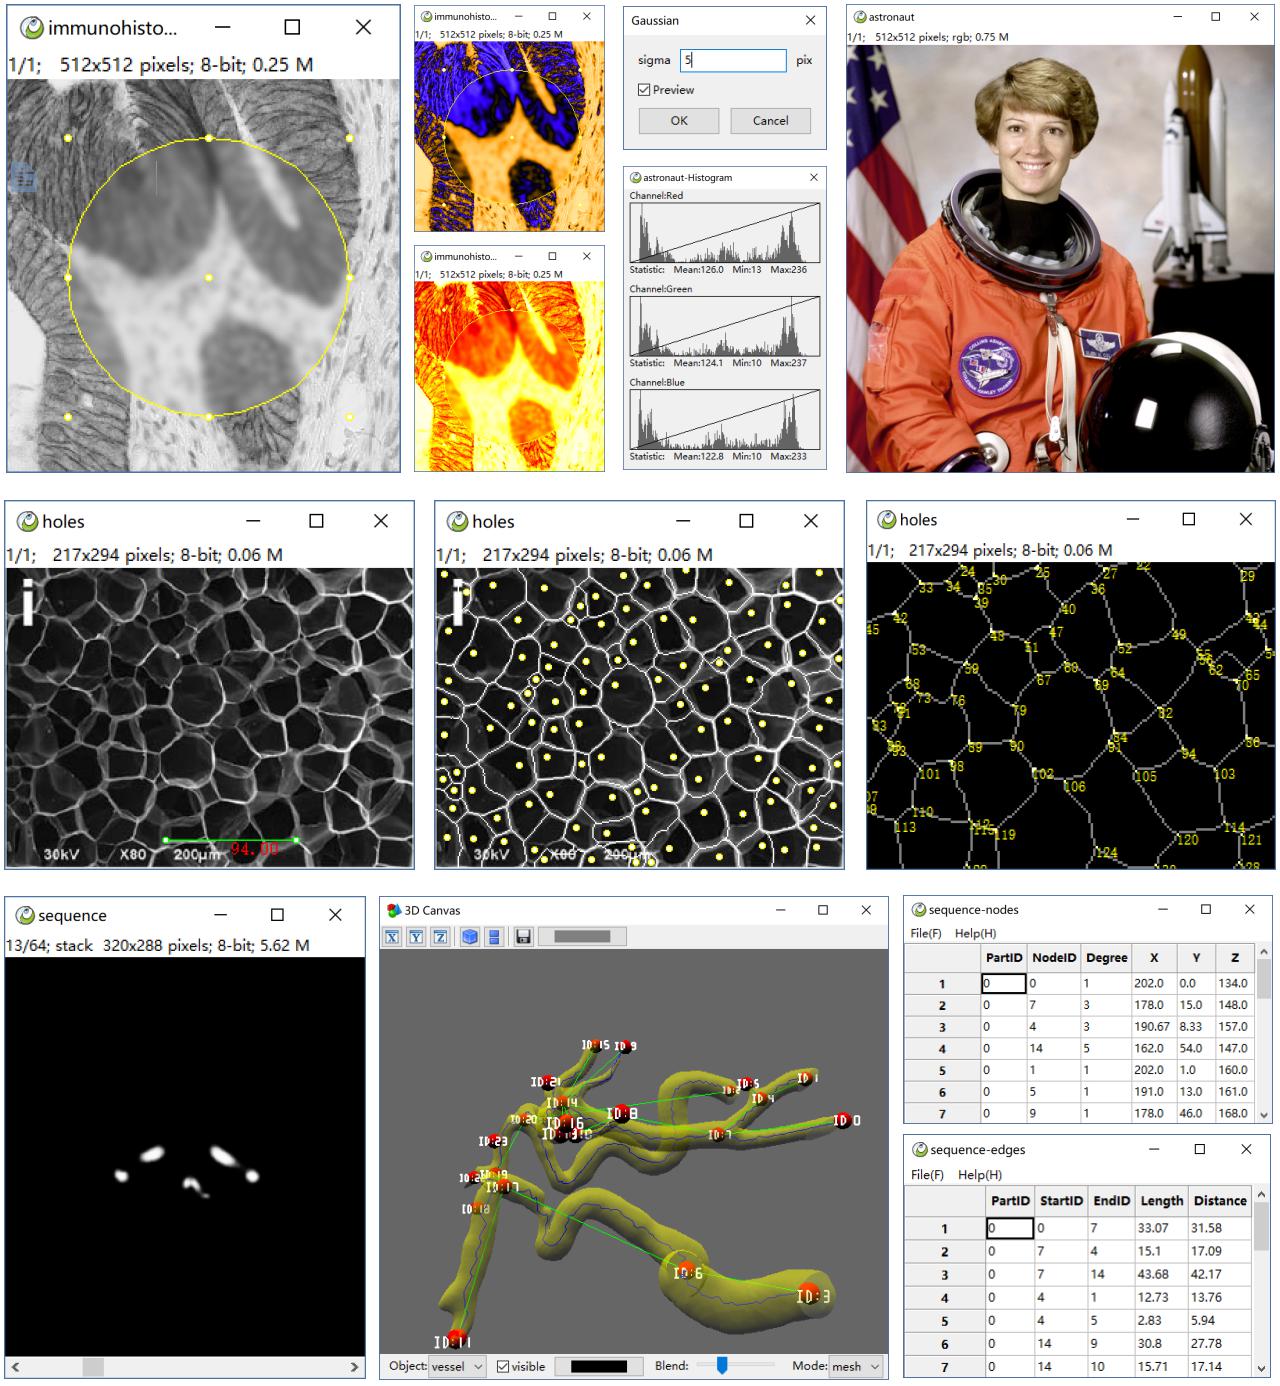
ImagePy could do many other things, the basic mathematical operations, filters, pixel statistics, 3D reconstruction and other functions, It is useful in biology, material, industry... here is a brief gallery.