An open-source framework to evaluate, test and monitor ML models in production.
Docs | Discord Community | User Newsletter | Blog | Twitter
Evidently is an open-source Python library for data scientists and ML engineers. It helps evaluate, test, and monitor the performance of ML models from validation to production. It works with tabular, text data and embeddings.
Evidently has a modular approach with 3 interfaces on top of the shared metrics functionality.
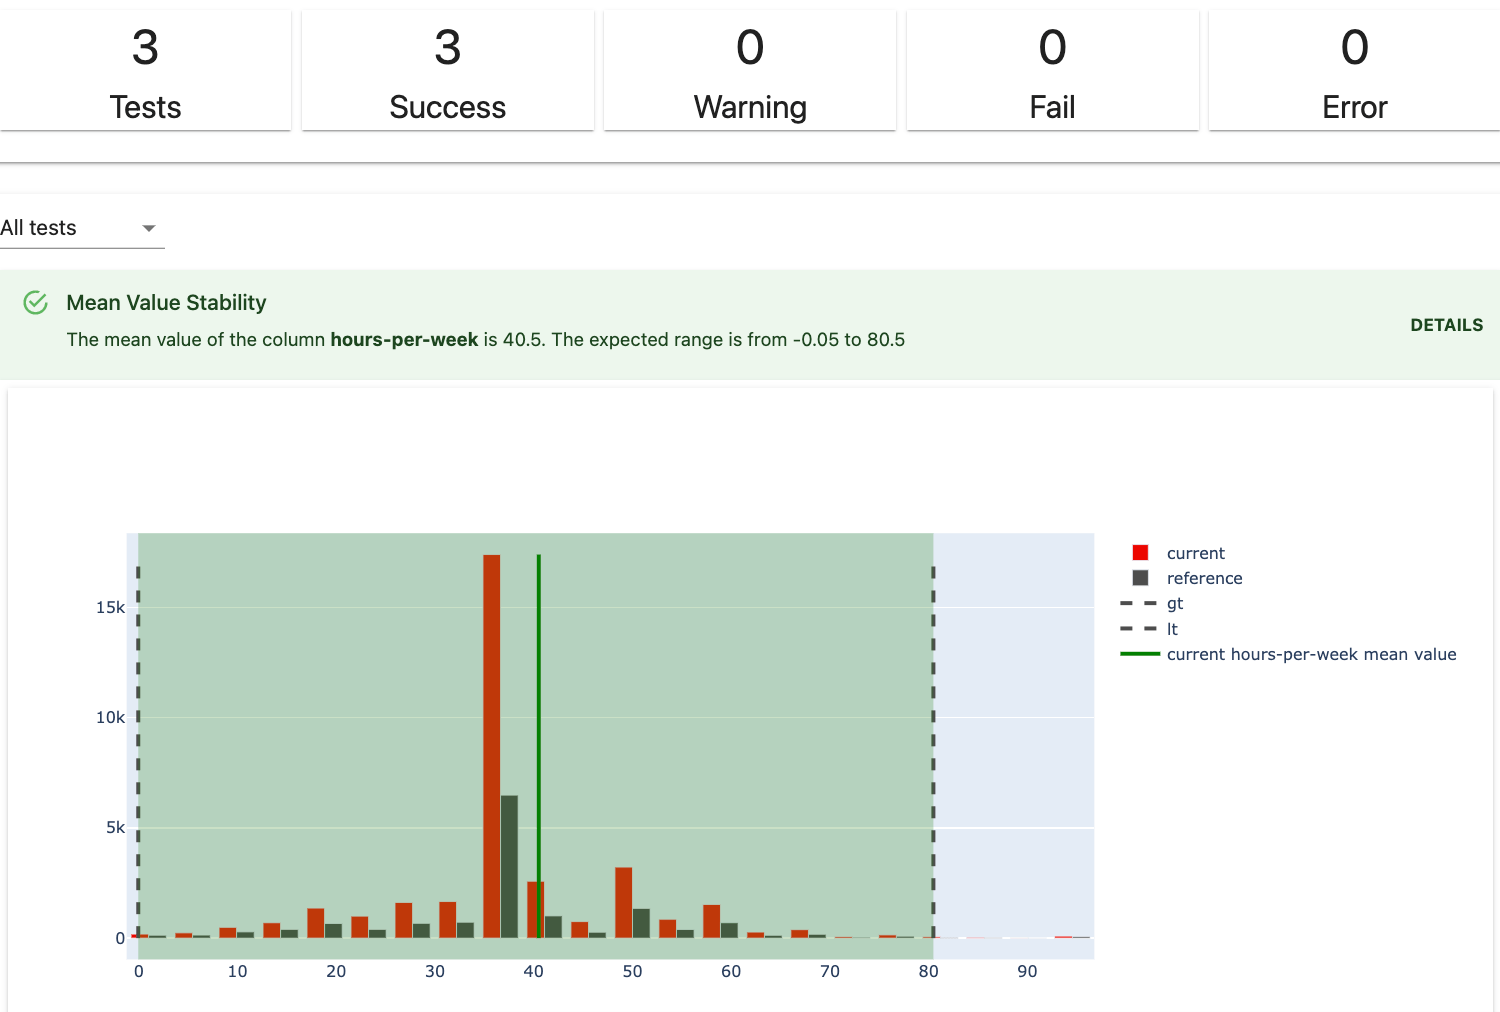
Tests perform structured data and ML model quality checks. They verify a condition and return an explicit pass or fail result.
You can create a custom Test Suite from 50+ individual tests or run a preset (for example, Data Drift or Regression Performance). You can get results as an interactive visual dashboard inside Jupyter notebook or Colab, or export as JSON or Python dictionary.
Tests are best for automated batch model checks. You can integrate them as a pipeline step using tools like Airlfow.
Note We added a new Report object starting from v0.1.59. Reports unite the functionality of Dashboards and JSON profiles with a new, cleaner API. The old Dashboards API was removed from the code base in v0.3.0. If your existing code is breaking, read the guide.
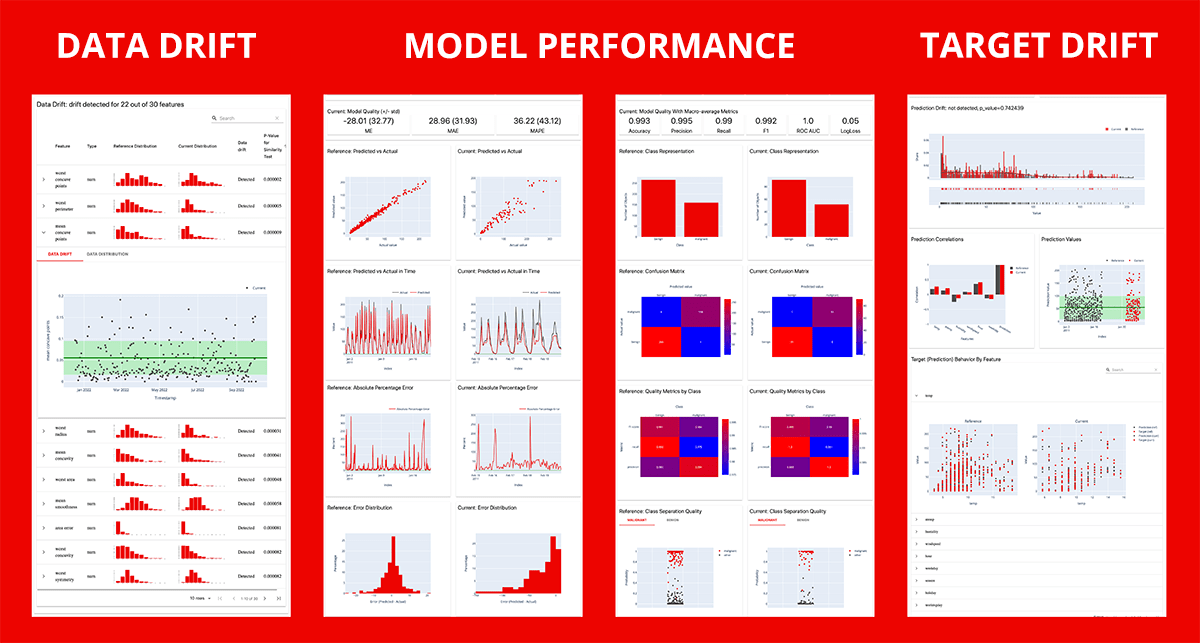
Reports calculate various data and ML metrics and render rich visualizations. You can create a custom Report or run a preset to evaluate a specific aspect of the model or data performance. For example, a Data Quality or Classification Performance report.
You can get an HTML report (best for exploratory analysis and debugging) or export results as JSON or Python dictionary (best for logging, documention or to integrate with BI tools).
Note This functionality is in development and subject to API change.
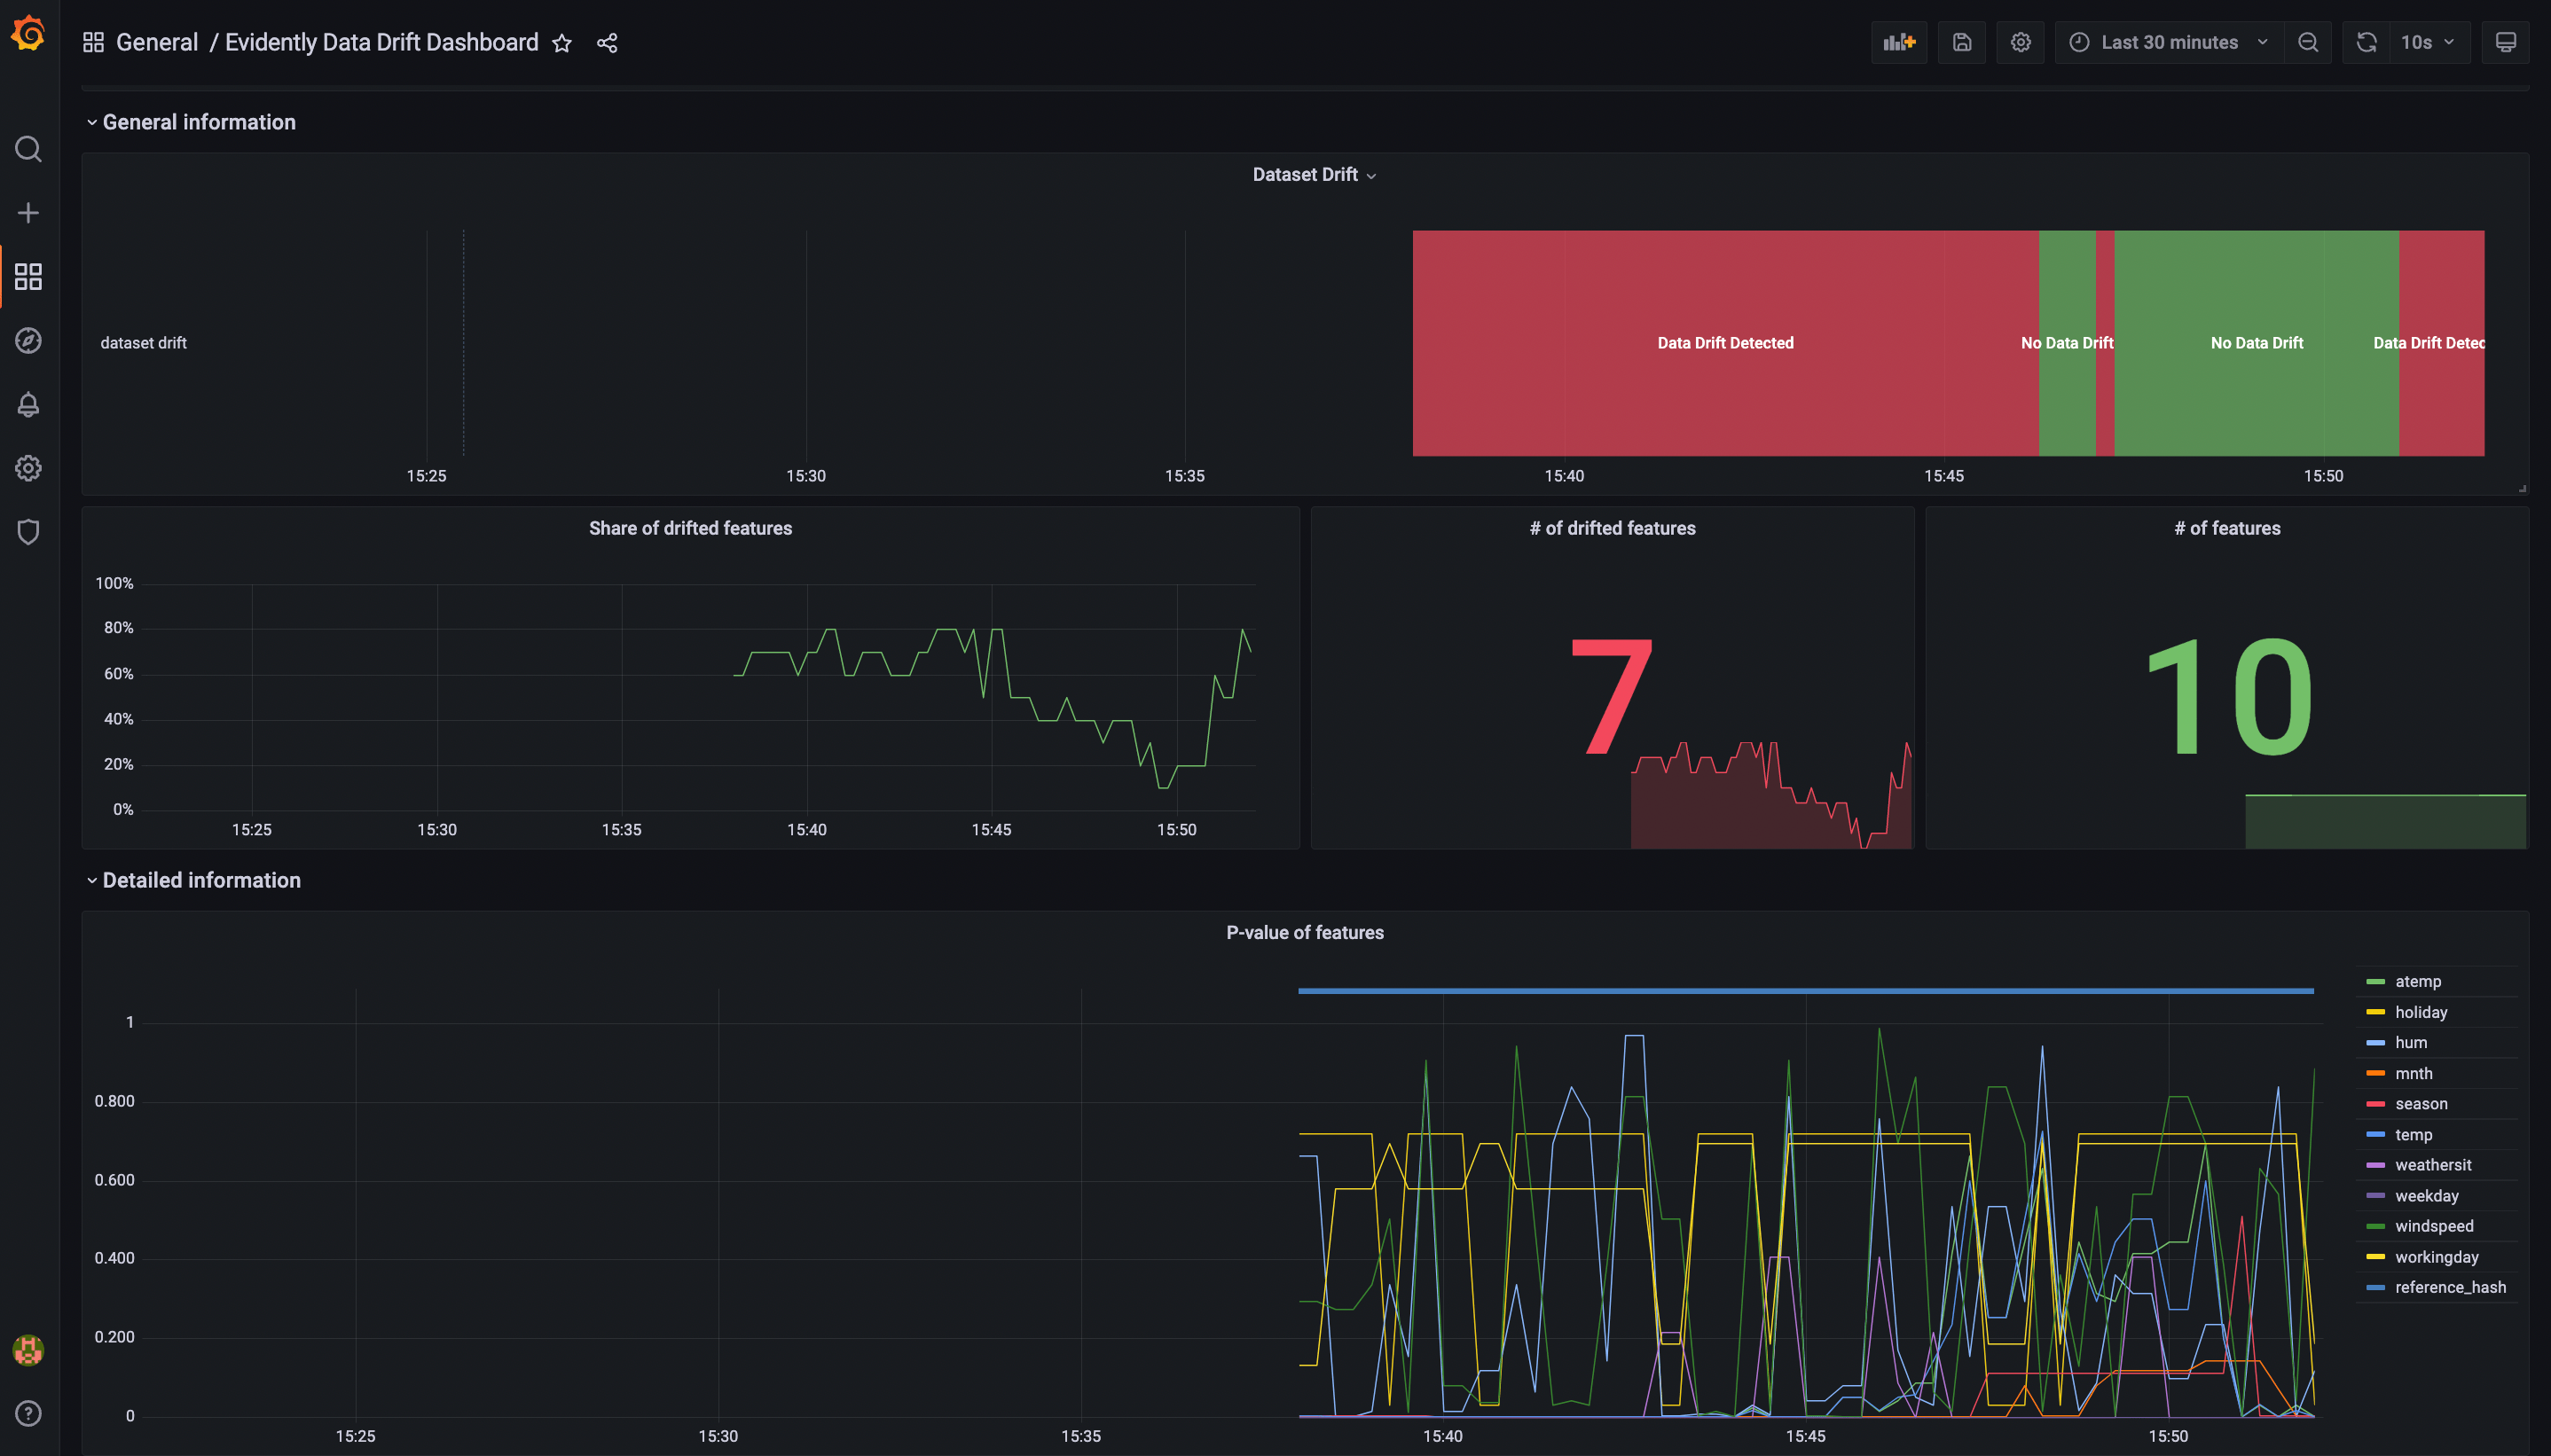
Evidently has monitors that collect data and model metrics from a deployed ML service. You can use it to build live monitoring dashboards. Evidently configures the monitoring on top of streaming data and emits the metrics in Prometheus format. There are pre-built Grafana dashboards to visualize them.
Evidently is available as a PyPI package. To install it using pip package manager, run:
pip install evidentlySince version 0.2.4 Evidently is available in Anaconda distribution platform. To install Evidently using conda installer, run:
conda install -c conda-forge evidentlyIf you only want to get results as HTML or JSON files, the installation is now complete. To display the dashboards inside a Jupyter notebook, you need jupyter nbextension. After installing evidently, run the two following commands in the terminal from the evidently directory.
To install jupyter nbextension, run:
jupyter nbextension install --sys-prefix --symlink --overwrite --py evidentlyTo enable it, run:
jupyter nbextension enable evidently --py --sys-prefixThat's it! A single run after the installation is enough.
Note: if you use Jupyter Lab, the reports might not display in the notebook. However, you can still save them as HTML files.
Evidently is available as a PyPI package. To install it using pip package manager, run:
pip install evidentlyTo install Evidently using conda installer, run:
conda install -c conda-forge evidentlyUnfortunately, building reports inside a Jupyter notebook using jupyter nbextension is not yet possible for Windows. The reason is Windows requires administrator privileges to create symlink. You can still display reports and testsuites inside a Jupyter notebook by explicitly adding the argument inline when calling it: report.show(mode='inline'). And you can generate the HTML to view externally as well.
Note This is a simple Hello World example. You can find a complete Getting Started Tutorial in the docs.
To start, prepare your data as two pandas DataFrames. The first should include your reference data, the second - current production data. The structure of both datasets should be identical. To run some of the evaluations (e.g. Data Drift), you need input features only. In other cases (e.g. Target Drift, Classification Performance), you need Target and/or Prediction.
After installing the tool, import Evidently test suite and required presets. We'll use a simple toy dataset:
import pandas as pd

from sklearn import datasets

from evidently.test_suite import TestSuite
from evidently.test_preset import DataStabilityTestPreset
from evidently.test_preset import DataQualityTestPreset

iris_data = datasets.load_iris(as_frame='auto')
iris_frame = iris_data.frame
To run the Data Stability test suite and display the reports in the notebook:
data_stability= TestSuite(tests=[
    DataStabilityTestPreset(),
])
data_stability.run(current_data=iris_frame.iloc[:60], reference_data=iris_frame.iloc[60:], column_mapping=None)
data_stability
To save the results as an HTML file:
data_stability.save_html("file.html")You'll need to open it from the destination folder.
To get the output as JSON:
data_stability.json()After installing the tool, import Evidently report and required presets:
import pandas as pd

from sklearn import datasets

from evidently.report import Report
from evidently.metric_preset import DataDriftPreset

iris_data = datasets.load_iris(as_frame='auto')
iris_frame = iris_data.frame
To generate the Data Drift report, run:
data_drift_report = Report(metrics=[
    DataDriftPreset(),
])

data_drift_report.run(current_data=iris_frame.iloc[:60], reference_data=iris_frame.iloc[60:], column_mapping=None)
data_drift_report
To save the report as HTML:
data_drift_report.save_html("file.html")You'll need to open it from the destination folder.
To get the output as JSON:
data_drift_report.json()We welcome contributions! Read the Guide to learn more.
For more information, refer to a complete Documentation. You can start with this Tutorial for a quick introduction.
Here you can find simple examples on toy datasets to quickly explore what Evidently can do right out of the box.
| Report | Jupyter notebook | Colab notebook | Contents |
|---|---|---|---|
| Getting Started Tutorial | link | link | Data Stability and custom test suites, Data Drift and Target Drift reports |
| Evidently Metric Presets | link | link | Data Drift, Target Drift, Data Quality, Regression, Classification reports |
| Evidently Metrics | link | link | All individual metrics |
| Evidently Test Presets | link | link | No Target Performance, Data Stability, Data Quality, Data Drift Regression, Multi-class Classification, Binary Classification, Binary Classification top-K test suites |
| Evidently Tests | link | link | All individual tests |
See how to integrate Evidently in your prediction pipelines and use it with other tools.
| Title | link to tutorial |
|---|---|
| Real-time ML monitoring with Grafana | Evidently + Grafana |
| Batch ML monitoring with Airflow | Evidently + Airflow |
| Log Evidently metrics in MLflow UI | Evidently + MLflow |
To get updates on new features, integrations and code tutorials, sign up for the Evidently User Newsletter.
If you want to chat and connect, join our Discord community!


