Hedging options by using Monte Carlo simulations or real data
After inputting the parameters (e.g. r, sig(vol), dt), this project can give users the results of dynamic delta hedging. The dynamic stock price can come from Monte Carlo Simulation or real data.
Python 3.X should be installed on your machine.
- Import different files to run the code:
<import delta_hedging_mc>- Daily delta hedging when market close
- stock price: Monte Carlo Simulation
<import hedging_based_s>- Delta hedging based on changes in stock price
- stock price: Monte Carlo Simulation
<import hedging_real_data>- Delta hedging based on changes in stock price
- stock price: real price
- The parameters:
k = strike price
s0 = initial stock price
dt = t/T = time to maturity
rf = remaining time
r = risk-less short rate
sig = volatility of stock value
m = the number of path nodes
n = the number of simulations
name: "c"=call, "p"=put
towards: buy=1, sell=-1
number = the number of contract
<import delta_hedging_mc>
Suppose we buy 100 numbers of call option. The parameters are as follows:
strike price = 100; initial stock price = 100; time to maturity = 20/250 = 0.08;
risk-less short rate = 0.03; volatility of stock value = 0.2
the number of path nodes = 20; the number of simulations = 100000
Then one price path can be simulated based on Monte Carlo method:
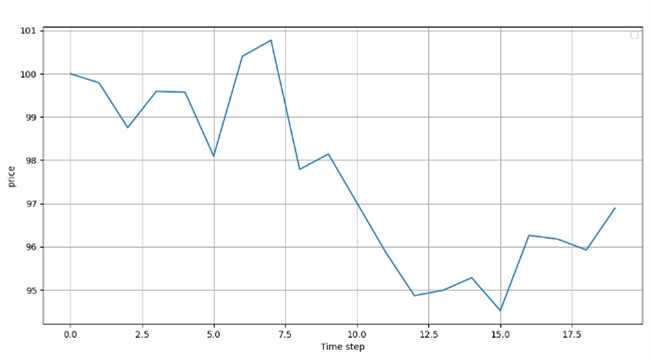
Following this price path, the result about daily delta hedging when market close are as follows:
             s    k     value     delta  underlying_position  PoL_in_stock
0   100.000000  100  2.249024  0.528186                -53.0      0.000000
1    99.792657  100  2.088297  0.512475                -51.0     10.989176
2    98.754161  100  1.557154  0.433872                -43.0     52.963311
3    99.594844  100  1.874472  0.494953                -49.0    -36.149385
4    99.574226  100  1.803350  0.491589                -49.0      1.010282
5    98.096180  100  1.127525  0.370275                -37.0     72.424269
6   100.403404  100  2.095604  0.557338                -56.0    -85.367279
7   100.775555  100  2.235728  0.589557                -59.0    -20.840460
8    97.788877  100  0.841258  0.324372                -32.0    176.213957
9    98.144736  100  0.890919  0.346811                -35.0    -11.387459
10   97.011756  100  0.508059  0.239333                -24.0     39.654271
11   95.874580  100  0.249233  0.143943                -14.0     27.292239
12   94.869292  100  0.108490  0.076725                 -8.0     14.074034
13   94.992759  100  0.088016  0.067702                 -7.0     -0.987740
14   95.283589  100  0.077165  0.064186                 -6.0     -2.035809
15   94.524201  100  0.023866  0.025253                 -3.0      4.556329
16   96.263196  100  0.071753  0.070270                 -7.0     -5.216984
17   96.177148  100  0.032285  0.039910                 -4.0      0.602333
18   95.925056  100  0.005943  0.010631                 -1.0      1.008369
19   96.892785  100  0.002529  0.006576                 -1.0     -0.967729
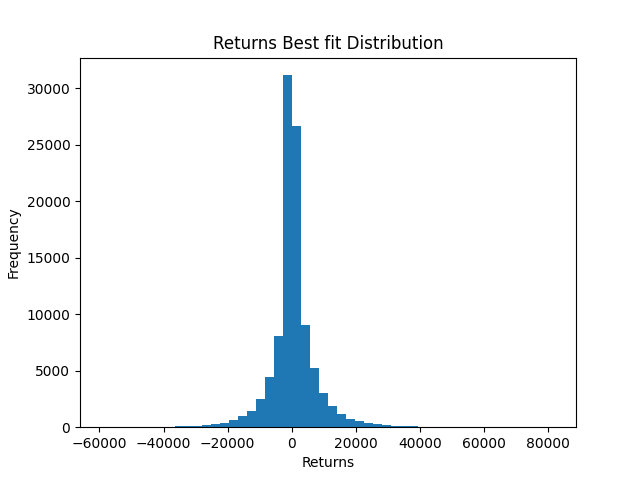
Repeating this process 100000 times and then calcultaing profit each time, we can get returns best fit distribution. It is a normal distribution centered on 0.
<import hedging_real_data>
Delta will be hedged when the the variation of the stock price is greater or less than sigma / 16
First, we select the closing price of HC2110 in every 30 minutes from July 2, 2021 to July 29, 2021 HC2110.xls
The following are parameters:
Suppose expiration time is on July 29, 2021.
r = risk-less short rate = 0.03
sig = volatility of stock value = 0.21
Suppose we bought 100 numbers of call option
The results are as follows:
        s  s (prior)     k        ds       value     delta        underlying_position    position (prior)            time              PoL
0  5402.0        0.0  5402  0.000000  151.749074  0.533275   			-53.0            0.0        2021-7-2   09:30:00        0.0
1  5580.0     5402.0  5402  0.015653  249.045541  0.716173   			-72.0          -53.0        2021-7-6   09:30:00    -9434.0
2  5883.0     5580.0  5402  0.015186  489.418648  0.940885   		        -94.0          -72.0        2021-7-12  09:30:00   -21816.0
3  5955.0     5883.0  5402  0.014999  556.160107  0.969373   		   	-97.0          -94.0        2021-7-14  09:30:00    -6768.0
4  5895.0     5955.0  5402 -0.015531  496.853432  0.963866   			-96.0          -97.0        2021-7-16  13:45:00     5820.0
5  5909.0     5895.0  5402  0.013377  507.197840  0.991441   			-99.0          -96.0        2021-7-22  14:15:00    -1344.0
6  5974.0     5909.0  5402 -0.014517  571.704391  0.999868   		       -100.0          -99.0        2021-7-26  13:45:00    -6435.0

--------------------------------------------------------------------------------------------------------------------------------------
profit in options market is 41995
profit in stock market is -39977
the final profit is 2018
@ITNeri