The purpose of ggvwline is to provide a set of layer functions for
drawing variable-width curves.
You can install the development version of ggvwline from GitHub with:
# install.packages("devtools")
devtools::install_github("Hy4m/ggvwline")This is a basic example which shows you how to draw variable-width curves:
library(ggvwline)
library(ggplot2)
tt <- seq(0, 2 * pi, length.out = 102)[-c(1, 102)]
dd <- data.frame(x = cos(tt),
                 y = sin(tt),
                 w = runif(100, 10, 30),
                 g = rep(LETTERS[1:4], each = 25))

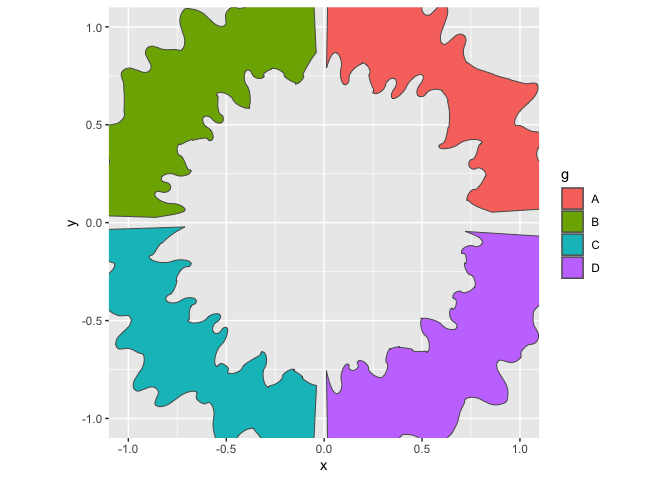
ggplot(dd, aes(x, y, fill = g)) +
  geom_vwline() +
coord_fixed()ggplot(dd, aes(x, y, fill = g)) +
geom_offset_xspline(aes(width = w)) +
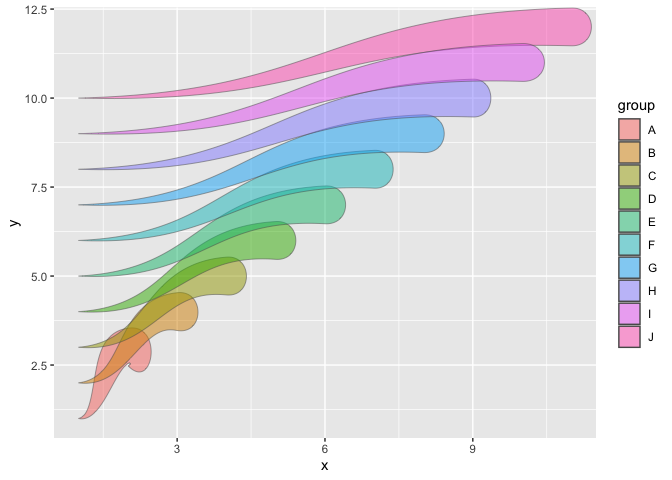
coord_fixed()dd2 <- data.frame(x = 1,
y = 1:10,
xend = 2:11,
yend = 3:12,
width = runif(10, 3, 20),
group = LETTERS[1:10])
ggplot(dd2, aes(x, y, xend = xend, yend = yend)) +
geom_vwdiagonal(aes(width = stat(index), fill = group),
width_units = "cm",
lineend = "round",
alpha = 0.5)

