- Clone to local
- Install dependencies
pip install -r requirements.txt - Create a data directory, and add server data CSV into it
- Run the app :
streamlit run streamlit_app.py
There are two main code files
- power_data_handler.py: data processing module with Pandas
- streamlit_app.py: the dashboard itself
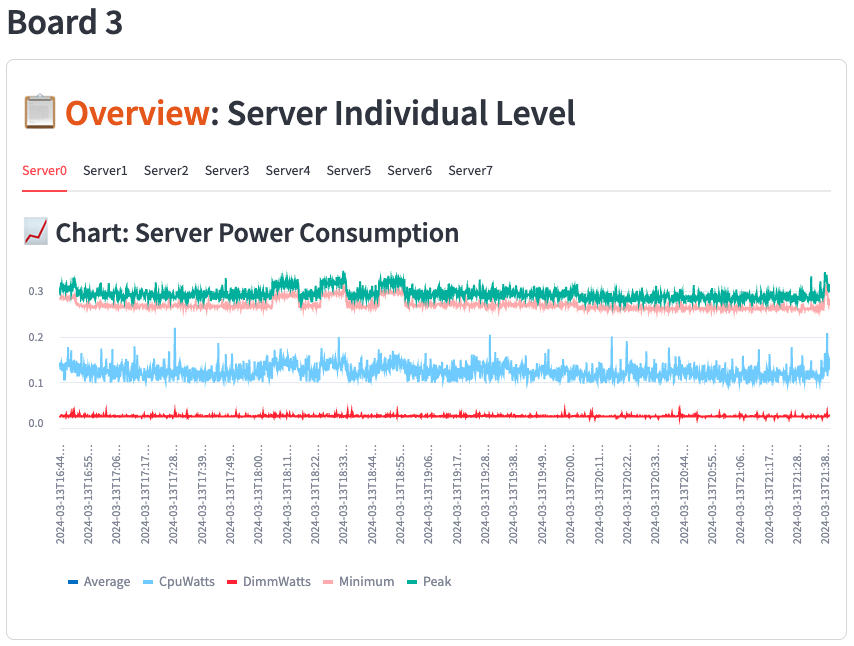
There are server power data from 8 servers. each server has 6 metrics:
- CpuUtil CPU utilization in percent.
- CpuWatts The power consumed by the system CPUs in Watts.
- DimmWatts The power consumed by the system memory DIMMs in Watts.
- Minumum Minimum power in Watts over the sample time(10 seconds).
- Peak Peak power in Watts over the sample time.
- Average Average power in Watts over the sample time.
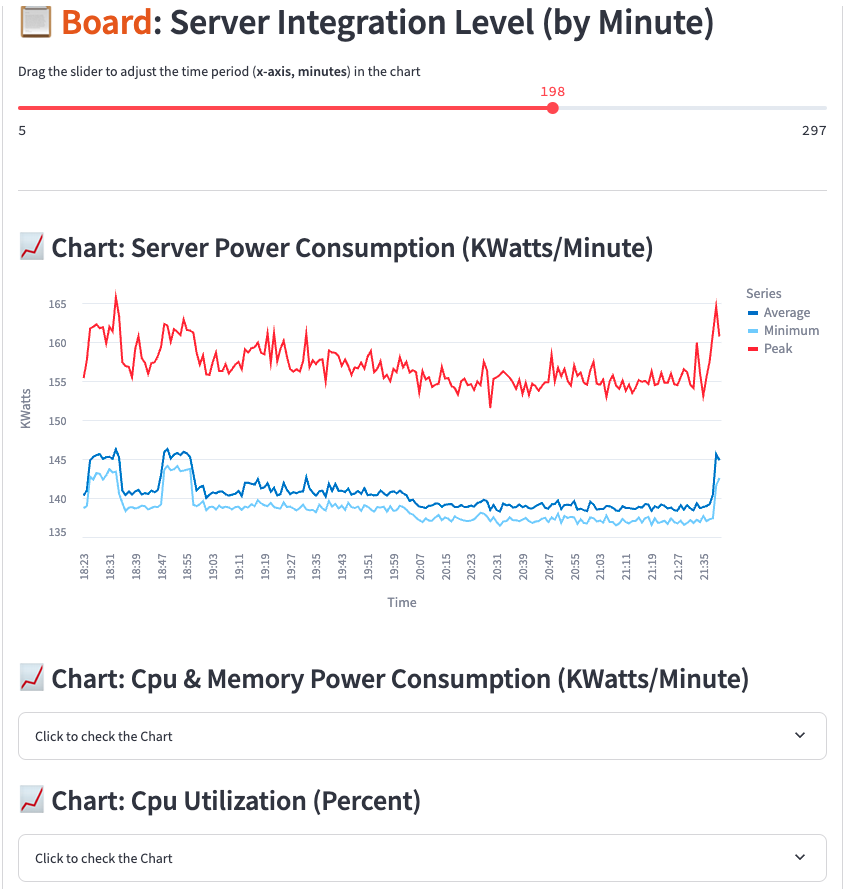
The Dashboard includes 3 main boards.

- Server Integration Level Power consumption and CPU utilization overview
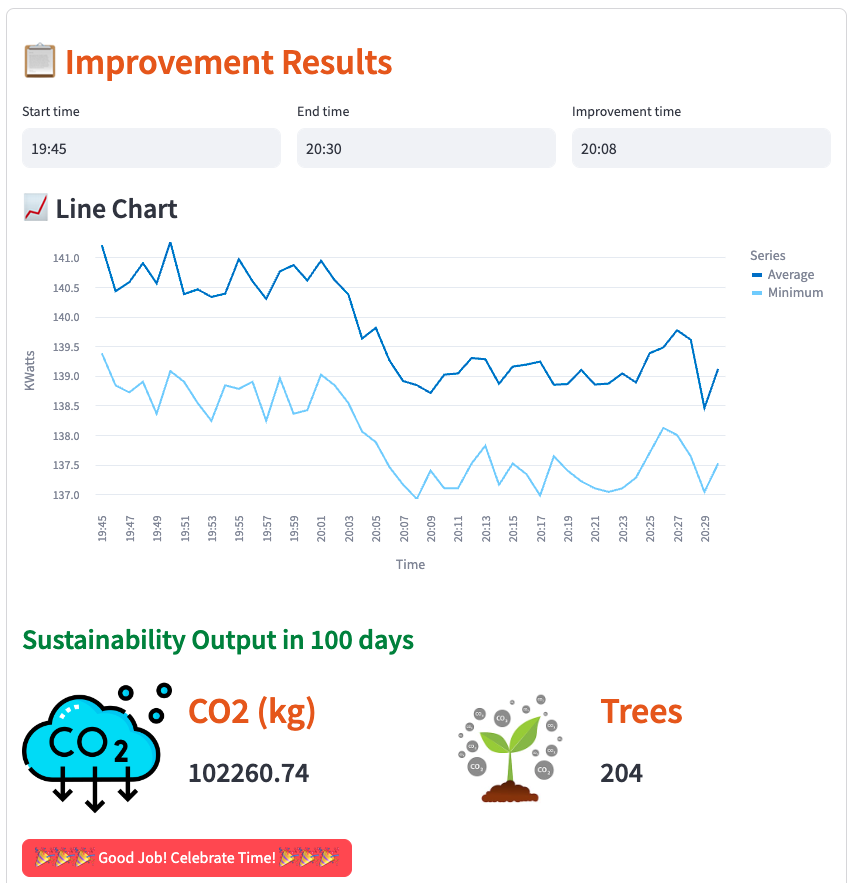
- Improvement Results Board
- Server Individual Level Board