Open-source community mapping tool with generative street network generation in Grasshopper and AI-driven empty spaces definition and suggestive activated spaces
View Web
Table of Contents
Inbetweens.xyz revolves around using artificial intelligence to support, document and resolve issues of the unplanned portions in urban areas. The scope of INBETWEENSPACES expands way beyond documenting informal settlements, It involves mapping empty spaces within informal settlements through a participatory approach. Which not only aids improving accessibility by generating new street networks. But also locates potential nodes for various infrastructure development within these organic urban systems.
The process documentation consists of resources to create data sets and train a Pix2Pix model to map unmapped portions. Followed by the use of web based resources such as webflow and map box; focussing on their integration for building an interface to collect data through a participatory approach. It further shares how collected data can be used to inform a different Machine Learning algorithm through a Live Google sheets and how the results can be used to analyse and generate street networks within the settlement, improving the accessibility within these settlements.
IN-BETWEEN SPACES is a project of IAAC, Institute for Advanced Architecture of Catalonia developed in the Master in Advanced Computation for Architecture & Design in 2020/21 by Hesham Shawqy, João Silva, Polina Hadjimitova, and Varun Mehta. Faculty: Angelos Chronis and Lea Khairallah.
This compilation is a dissemination of our project and the processes involved. It documents the various tools and methods we used to build the project. The intent of this documentation is to enable anyone to replicate and grow on any/all parts of the project.
Satellite Images/ Aerial Shots
[A] Gathering Training Data
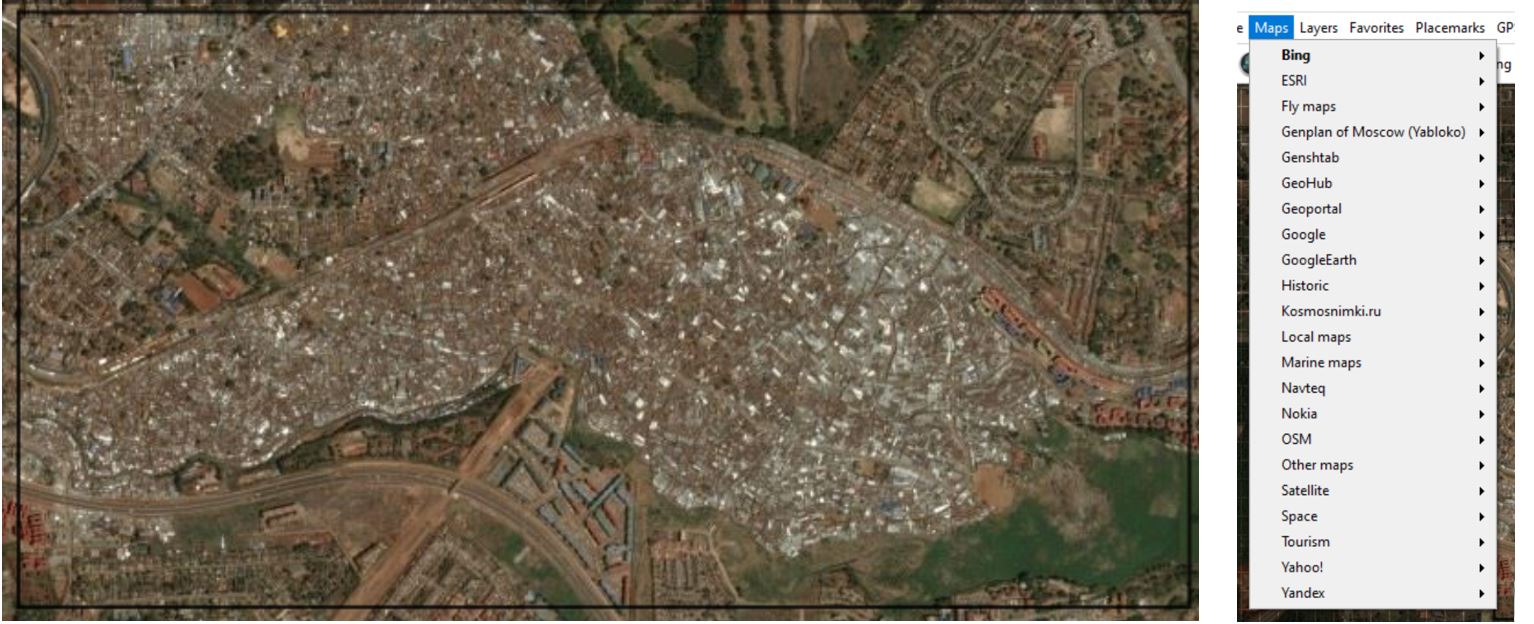
Satellite Images/ Aerial Shots Use existing Satellite Images or Drone Images clicked manually for your Raster Data for your Pix2Pix Model. If you do not have access to high resolution satellite images. You can use resources like Google earth for Satellite images.
We used SAS.Planet [Download Link], which allowed us to mark a location of choice, and cache completely 2M zoomed satellite images through Bing Maps, Google Maps, OSM and plenty other options.
Reference Tutorial: https://www.youtube.com/watch?v=rA1IqZcgB_Q
Shape files through Open Street Maps Open Street Maps is a good resource to download vector data, and shape files for your training data. These shape files can be accessed through open source GIS software such as QGIS. Here you can change the fill and stroke based on choice and export them as raster files.
(Alternative resources can be manual attempts documented in a GIS or Vector Format)
[B] Aligning images
For Aligning the Image and built infrastructure outlines, Overlay both exports onto each other on Photoshop as separate layers, and fix alignment. This can slo be done on QGIS, and exported as rasters although adjustments on photoshop might be more fluent.[C] Creating Dataset
Here are some snippets of code that will help you create a clean dataset using Imagemagick. Download + Documentation here: https://imagemagick.org/ Here we have curated some snippets of code which might come in handy. They probably might not be the cleanest way to do this, and there might better methods, but they worked for me, so hope they work for you .
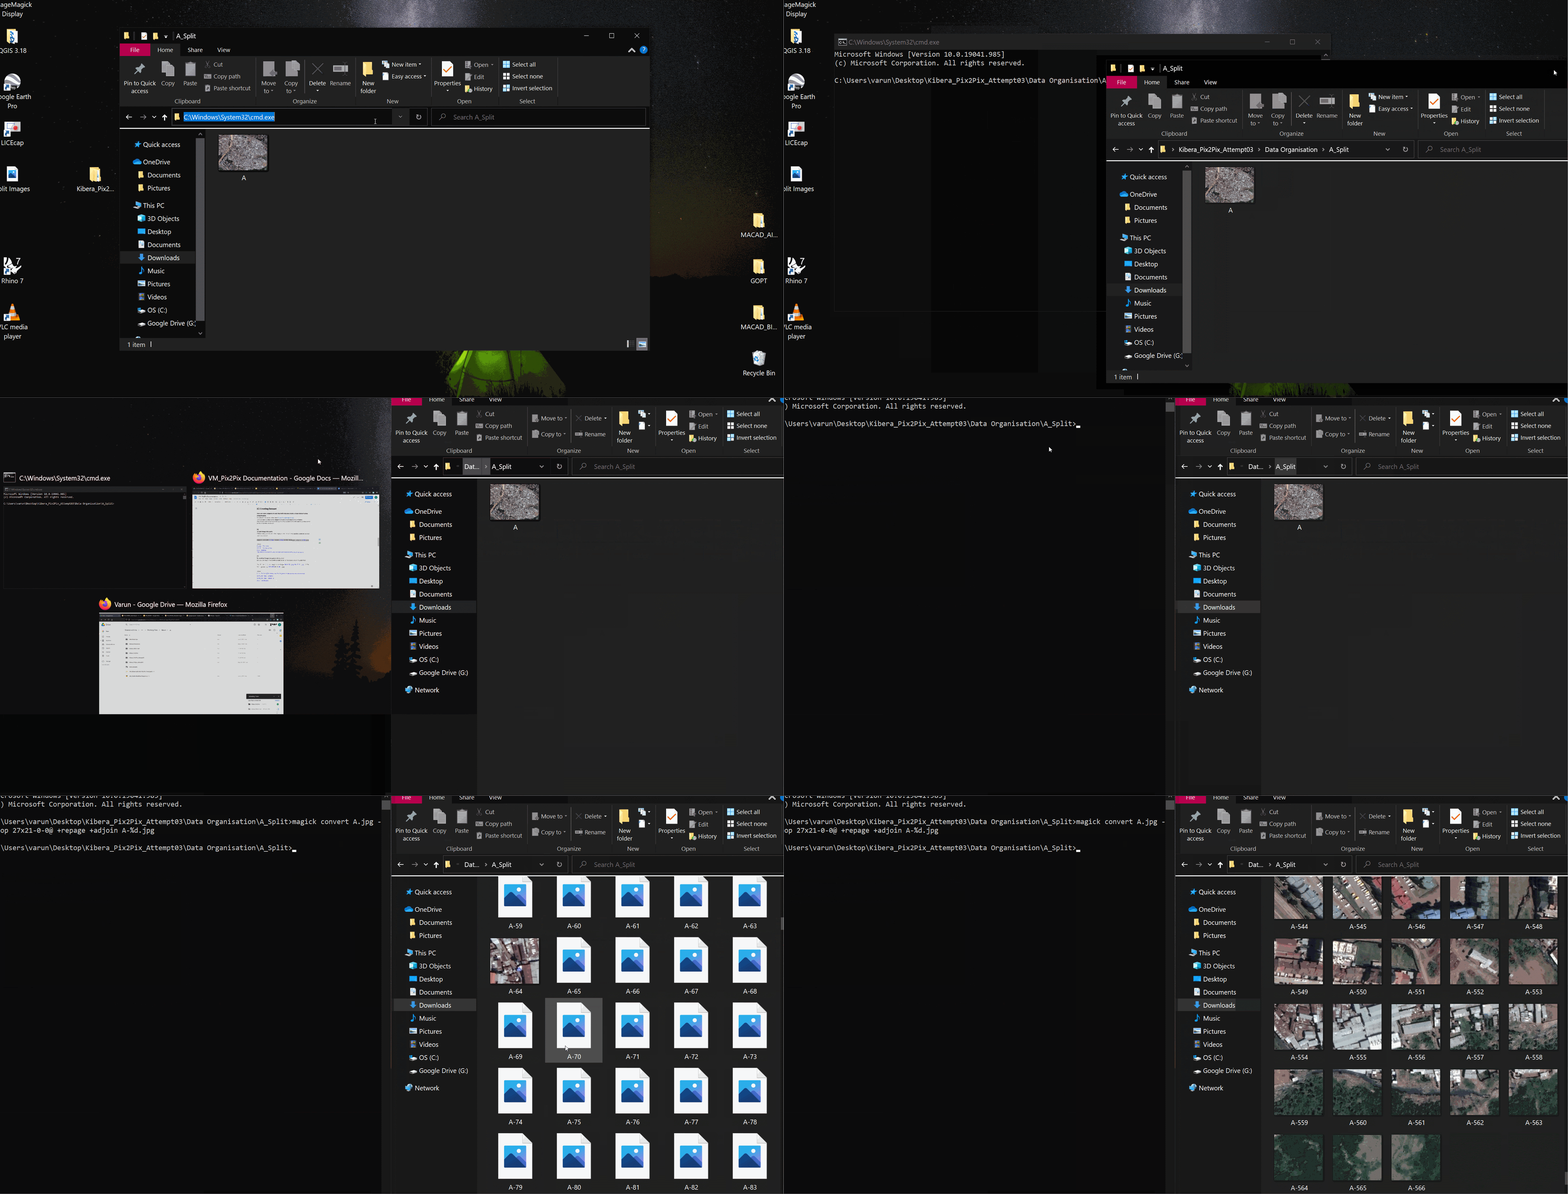
Make an empty folder with the image you want to split and run this command in your common prompt:
magick convert A.jpg -crop 27x21-0-0@ +repage +adjoin A%d.png
where; A.jpg- File name 27x21- Number of tiles 0-0- Padding **Its better to have exports as pngs, since the model usually converts to that format anyway
[2] Growing your DataSet We would do this step ideally post the cleaning [D], based on the size of your dataset. By flipping, rotating the images you can increase the number of images for your training data.
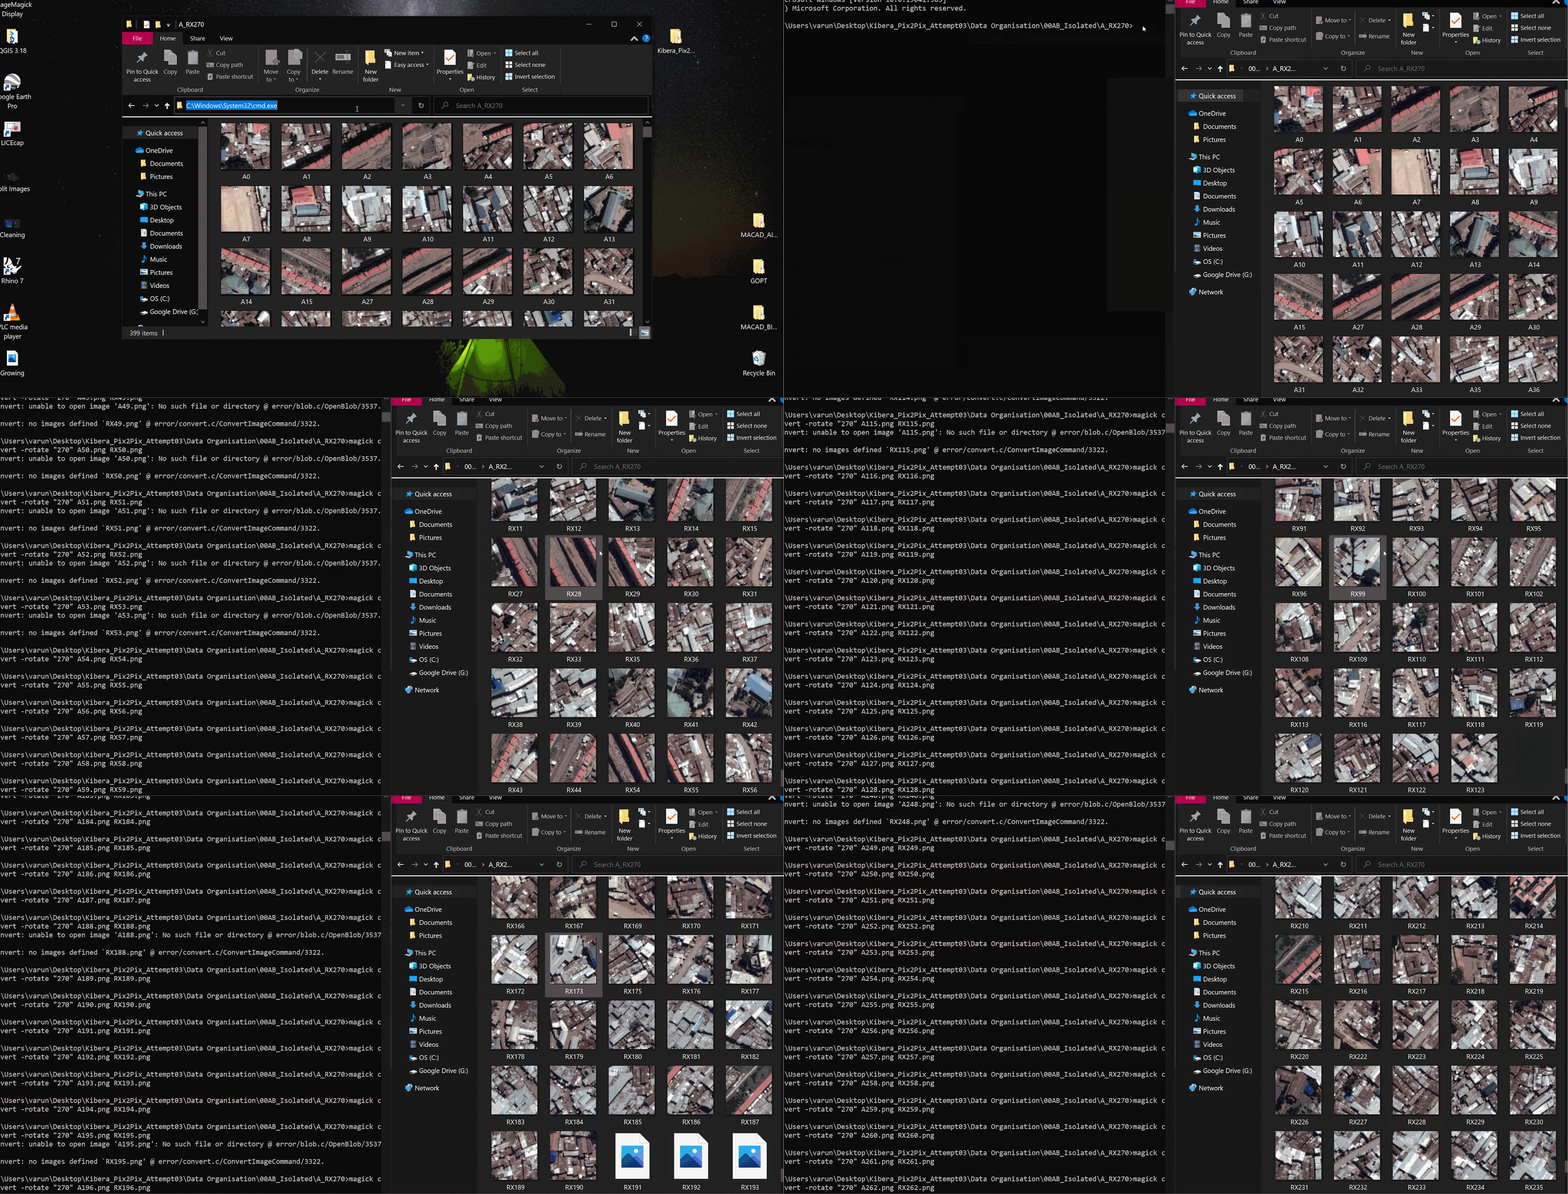
This is how you can rotate the image by 90deg, you can run this thrice in the command prompt in the folder with all the images, provided your images are square proportions ie. n pixels x n pixels, if not rotate only once by 180deg. If they are of square (equal) proportions you will create 3 folder copies and rotate (here RZ,RY,RX) rotated by 90, 180, 270deg respectively. This pattern needs to be repeated for A and B sets both.
for %i in ( ); do magick convert -rotate "90" A%i.png RY%i.png
where; ( )- Put list of file names, use this list generator (https://rechneronline.de/number-list/) 90- Angle of rotation A%i.png- Input File RY%i.png- Output File The first file will be the input file, followed by the output file
Reference Link: https://codeyarns.com/tech/2016-07-05-how-to-rotate-image-using-imagemagick.html It's safer to mirror your images, since the pixel proportions of the image don't get affected. You can also mirror your dataset to increase the number of images. You can use convert command from imagemagick flop for horizontal mirroring and flip for vertical mirroring.
Again through the command prompt in the folder where all your images are present.
for %i in ( ); do magick convert -flop A%i.png RZ%i.png for %i in ( ); do magick convert -flip A%i.png RX%i.png
where; ( )- Put list of file names, use this list generator (https://rechneronline.de/number-list/) A%i.png- Input File RYZ%i.png and RX%i.png- Output File The first file will be the input file, followed by the output file
Reference Link: https://codeyarns.com/tech/2016-07-05-how-to-rotate-image-using-imagemagick.html
[3] To combine Image into pairs (side by side) Put all the images that need to go size by side in the same folder and run the following code snippet in your command prompt. We use a for loop in the command line to do run the same line on multiple files.
Add compressed GIF image
for %i in ( ); do magick montage SetA_%i.jpg SetB_%i.jpg -tile 2x1 -geometry 675x505+0+0 A%i.jpg
where; ( )- Put list of file names, use this list generator (https://rechneronline.de/number-list/) SetA_%i.jpg- Image 1 SetB_%i.jpg- Image 2 2x1- The tile grid 675x505- Size of one Image +0+0- Padding A%i- Export Name
Reference Link: https://medium.com/@mheavers/generating-pix2pix-images-from-the-web-with-imagemagick-487ae5285ab7
[D] Cleaning Dataset
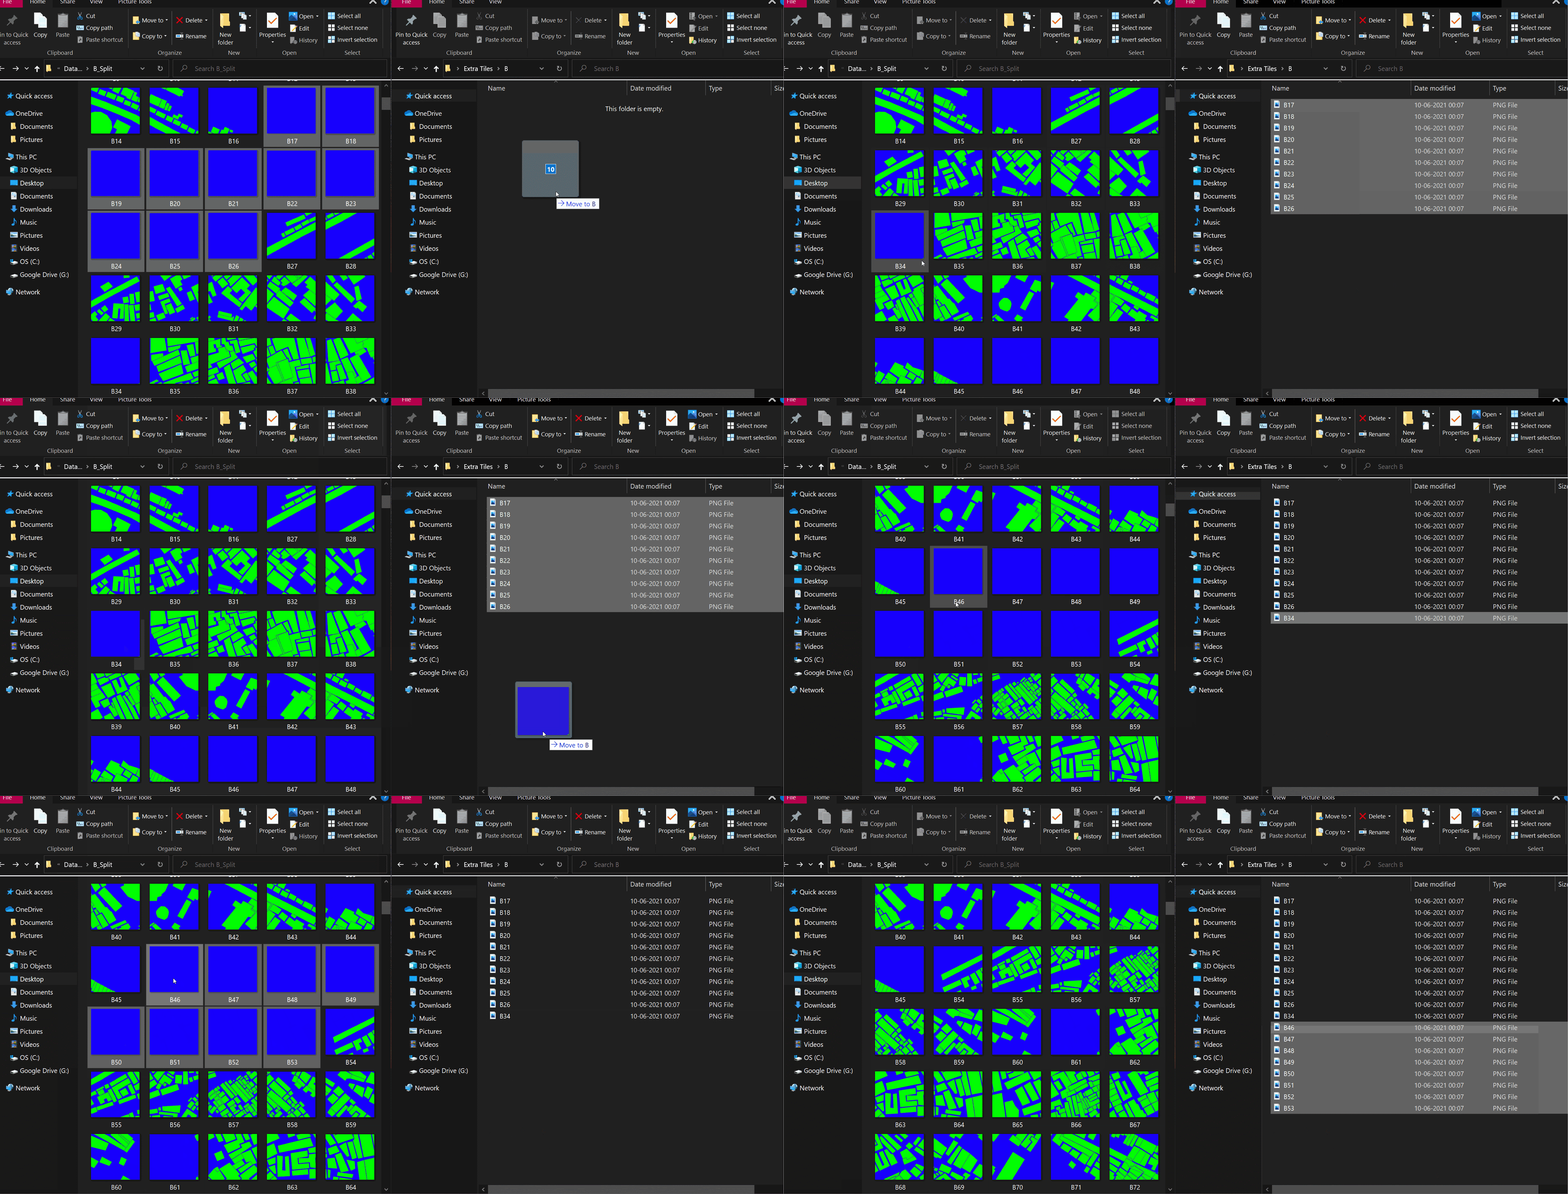 Getting rid of unused tiles
This is currently done manually, since no computer knows what is useful.
The model trains on the data you provide it, and make sure all the images look more or less the same and the variation is also uniform. It is very important to maintain visual uniformity within the training data, and delete images that are unique.
In the above example, we retain images that are covered by at least 30% of built infrastructure.
[E] Use Pix2Pix Notebooks Once you have created your data set, the images need to be serrated into train, test, val folders (use dataset folder as reference). We use Tensorflow 1.x, And clone Pix2Pix library as shown in the below Google colab notebooks. Our attempts involve using various kinds of input data and experimenting with different epochs to reduce the generator loss. Every Notebook mentions the stats of the input data, and the trail specification.
Reference Links:
[Notebook 1] [Notebook 2] [Notebook 3]
[Dataset Folder]
[F] Stitch Outputs together into a map
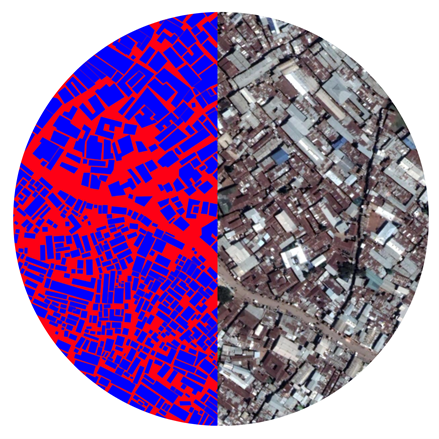
After having a trained model, we need to stitch all the output tiles together to form the completed map and compare it with the original satellite image.
To stitch outputs together
magick montage *.png -tile 27x21 -geometry +0+0 result.jpg
Tips: Use a map to rename data, and make sure the number of digits in the file naming is the same. The file format+size should also be the same, otherwise use the convert command to change them
To convert Formats Example converts jpegs to pngs, usually songs are preferable for Pix2Pix Models
for %i in ( ); do magick montage SetA_%i.jpg SetA_%i.png
Resizing for %i in (); do magick convert B%i.png -resize 256x256! %i.png
[G] Use OrfeoToolBox in QGIS
Oreo Toolbox is a QGIS Plugin with multiple machine learning algorithms embedded for image based segmentation and vectorisation from raster inputs.
It can be downloaded here:
https://www.orfeo-toolbox.org
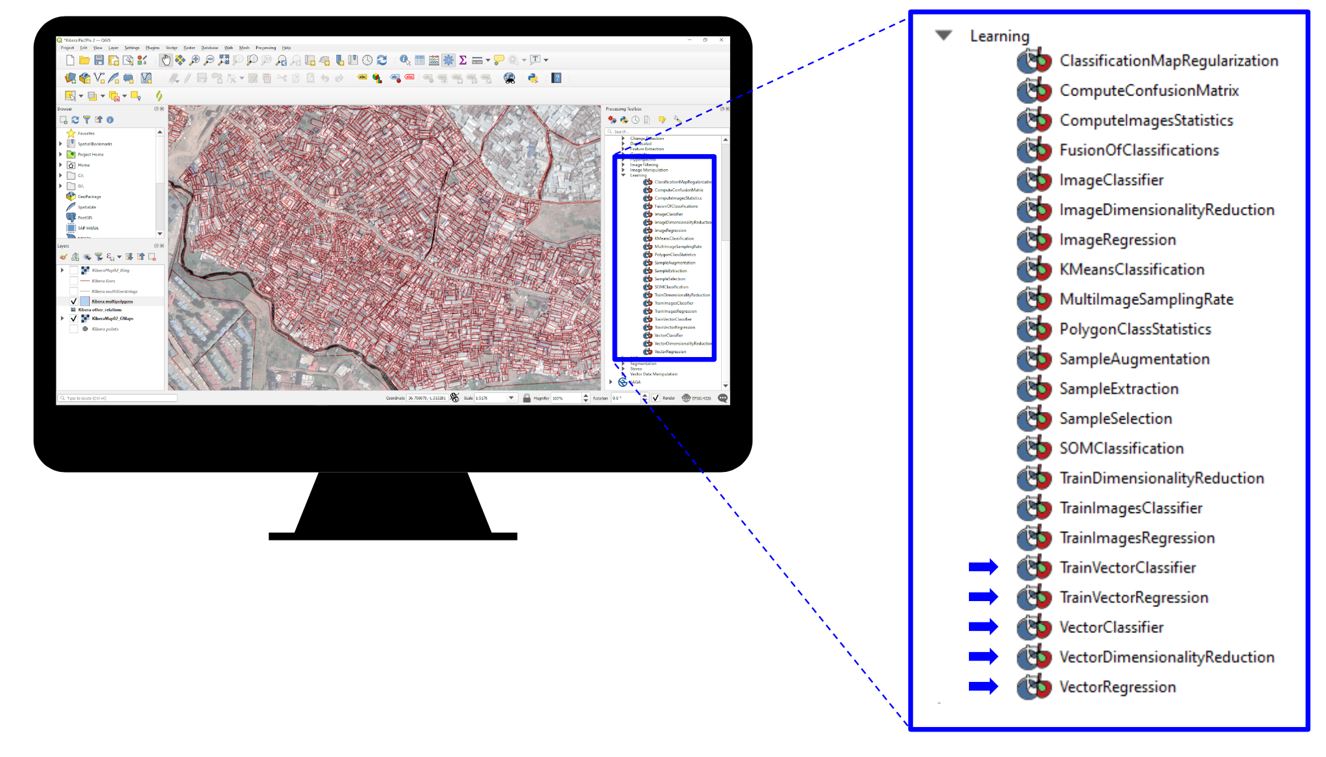
After vectorizing the mapping data of the informal settlement with pix2pix or in case it was available, it is imported to Mapbox. Mapbox Studio has easy to use interface where multiple file formats can be imported and desired visualization of the map can be selected. E.g. colors of streets, buildings etc. (https://www.mapbox.com/) Once created the visualization style is pasted in the mapbox embedded code on the web-site.
We have used webflow to build inbetweens.xyz interface
[H] Web Mapping of points and embedding the mapbox in a web inetrface
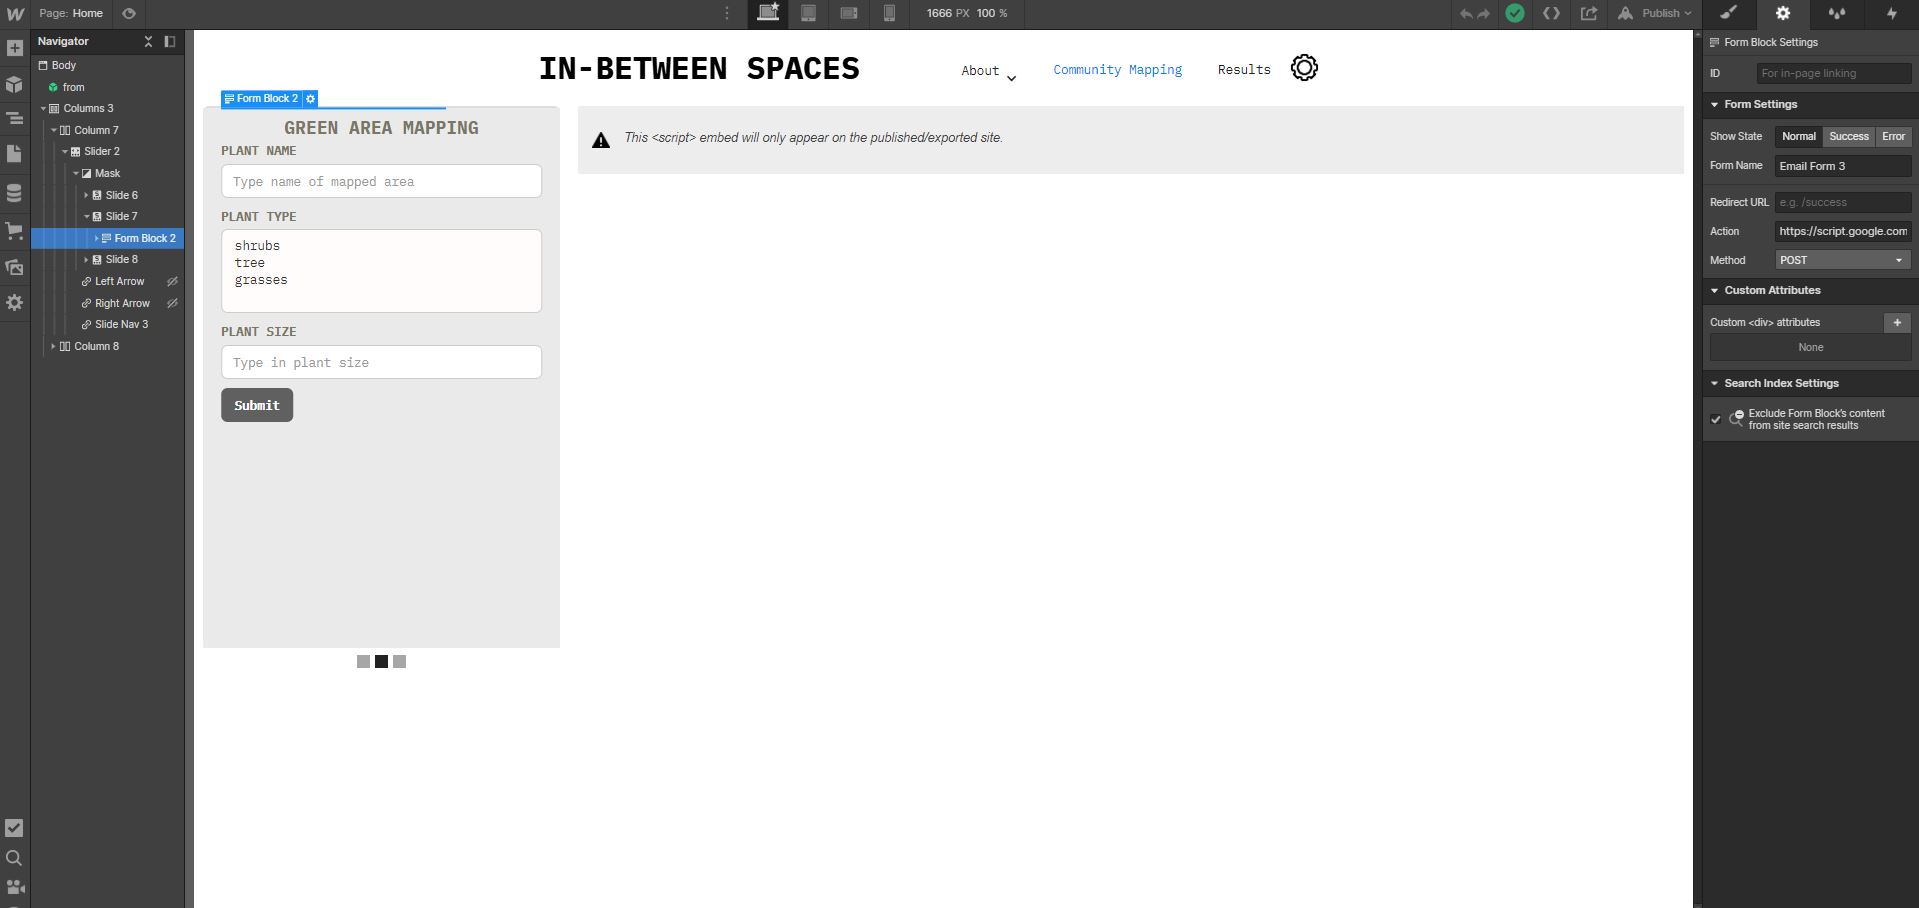
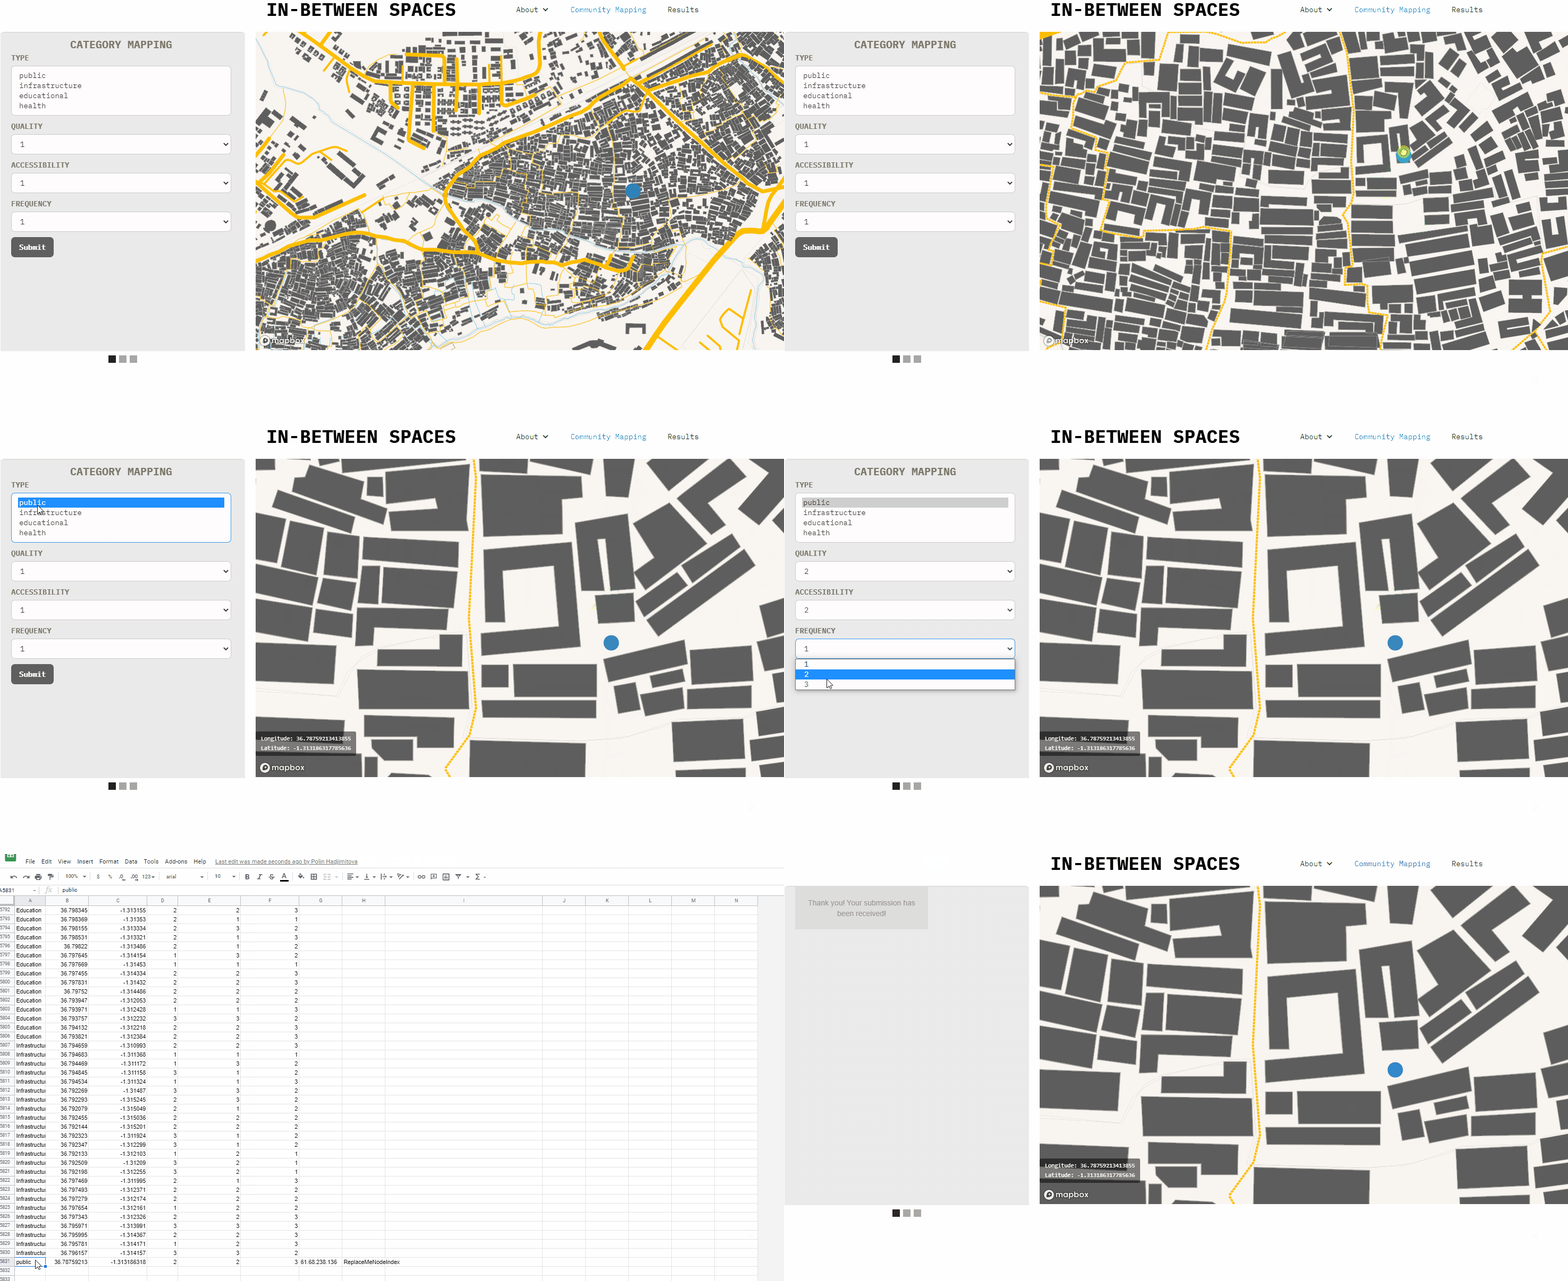 The interface currently allows to export point nodes to gsheet. The embedded code in the home-page can be copy-pasted to a new web-site and the map location and mapbox style can also be customized.
[I] Different forms
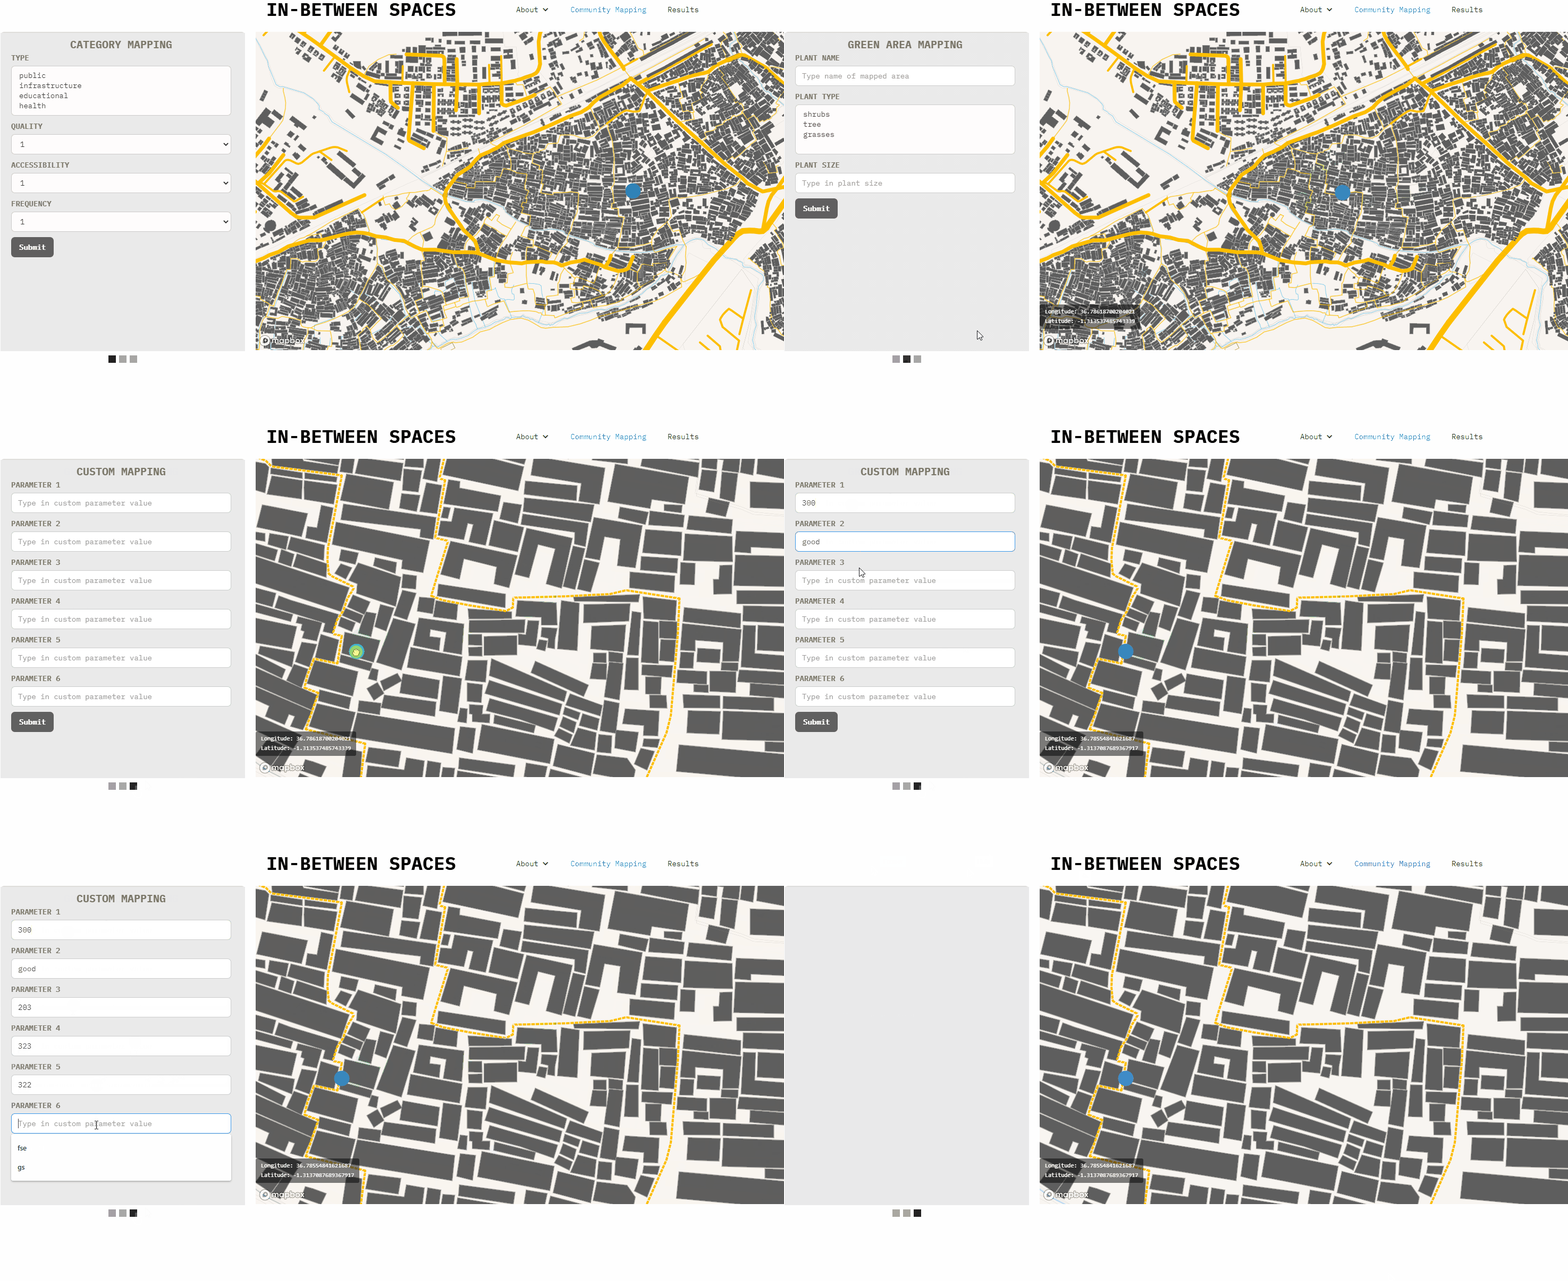 Adjecent to the mapbox is also a gallery made with Webflow with various forms. These forms can be easily created and/or modified with Webflow. Once the google spreadsheet has been deloyed in [G], the code needs to be pasted in the form settings action in Webflow or manually edited in an editor.
[J] Google spreadsheet posting coordinates
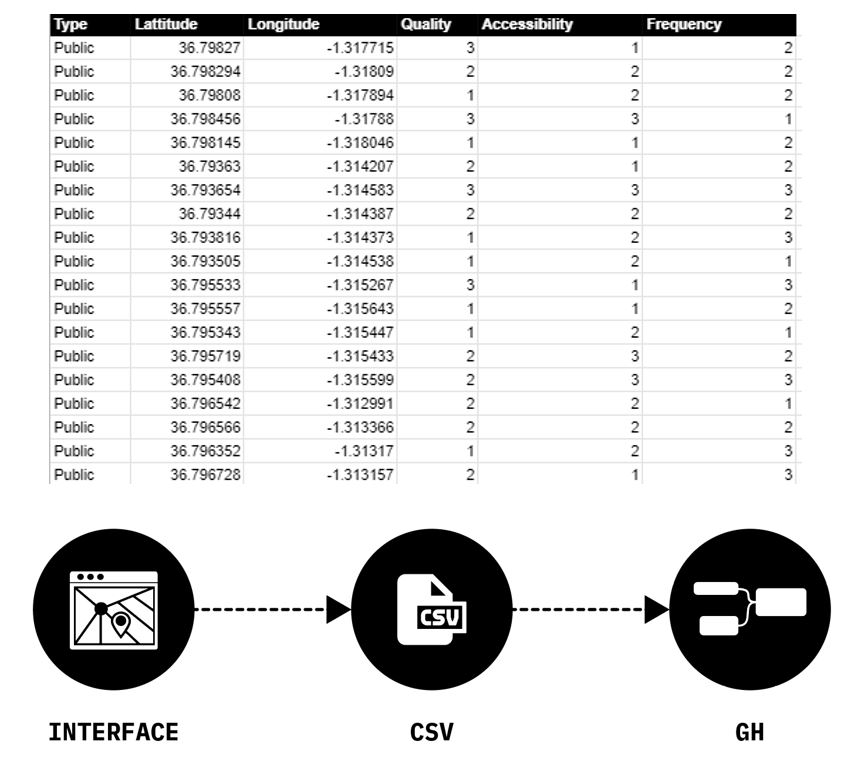
[K] Google spreadsheet receiving coordinates In the Results page you can also receive points and streets coordinates from Google spreadsheet. To receive points coordinates and streets from a google spreadsheet follow the instructions in google spreadsheet> Post and Receive from Google spreadsheet.
In order to apply the machine learning methodology developed in this project, you can choose to either access the notebooks associated with this repository or work directly inside the Hops Package, which includes both the training steps required to apply the machine learning model and access to the parameters utilized to activate street networks. Further information is given below.
-Training data: create a generous amount of random points on top of your shapefile in the Rhino/Grasshopper environment. The specific amount will depend on the size or area of interest you are working on. Establish the necessary rules for the relationship between the input features and the type of empty space they should relate too. Output a CSV file with both the metrics and the ID of the target empty space, for each randomly located point.
-Notebooks: The necessary notebooks are included in this repository. Inbetween_Classifcation_Model is the training process of a Classification model flexible to your use-case. Once trained, the model will be able to identify the correct empty space correlated with any new mapped locations by the community. The notebook Inbetween_Regression_Model is also provided as an extra, in case you are interested in filtering and sorting locations further down the process according to their distance to empty spaces.
-Hops Package: This package allows you to integrate the web application to the Rhino/Grasshopper environment where street networks and other metrics will be generated before being sent back to the web application. Inside you are provided with the three possible ways of activating empty spaces: Maximum Coverage Algorithm, Filter&Sort, and K-Means Clustering. The Maximum Coverage Algorithm will optimize the coverage of mapped locations to the number of empty spaces you wish to activate; Filter&Sort will allow you to pick the parameters (type of location, number of points) you are interested in for the activation and also handles the scoring functions for the empty spaces; and finally K-Means Clustering will predict a label to all activated empty spaces (that is, empty spaces with mapped locations nearby).
[L] Setup, Tools and plugins Rhinoceros3D and Grasshopper3d were the main tools to develop our script in this part.In order to run this script you need to install the following plugins: HumanUI Metahopper Urbano gHowl DeCoding spaces Clipper
[M] USER INTERFACE
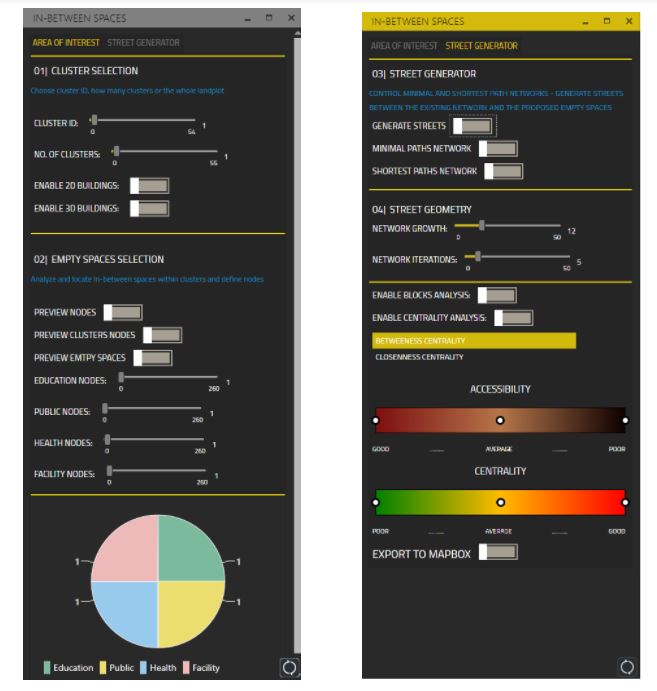
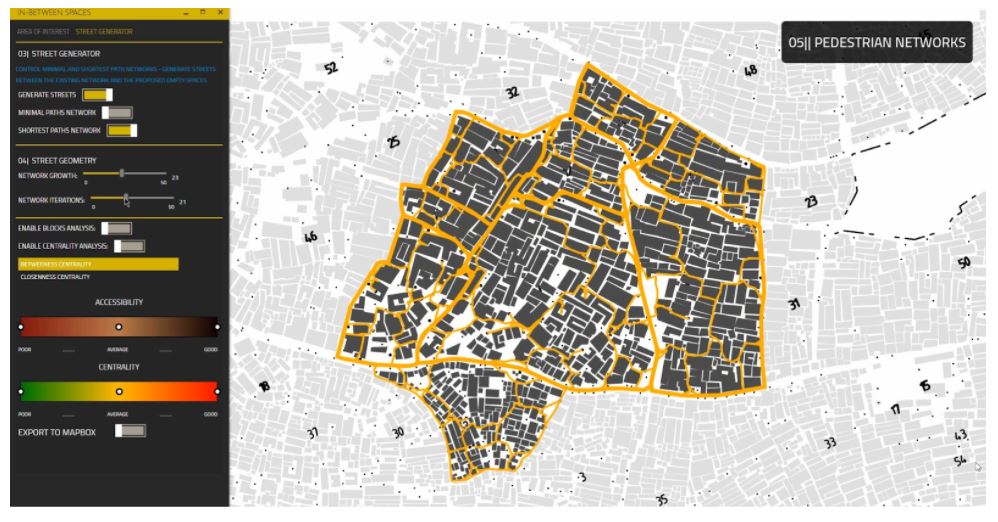
The user interface is divided into two parts; the first tab where the user can control the selected area within the settlement, visualization options, preview empty spaces, activating nodes using the machine learning model, and show nodes charts. The second tab where the user can enable streets network calculations, generating minimal paths network, generating shortest paths network, choose between streets iterations, apply buildings analysis, apply betweenness centrality, apply closeness centrality, and export results to mapbox.
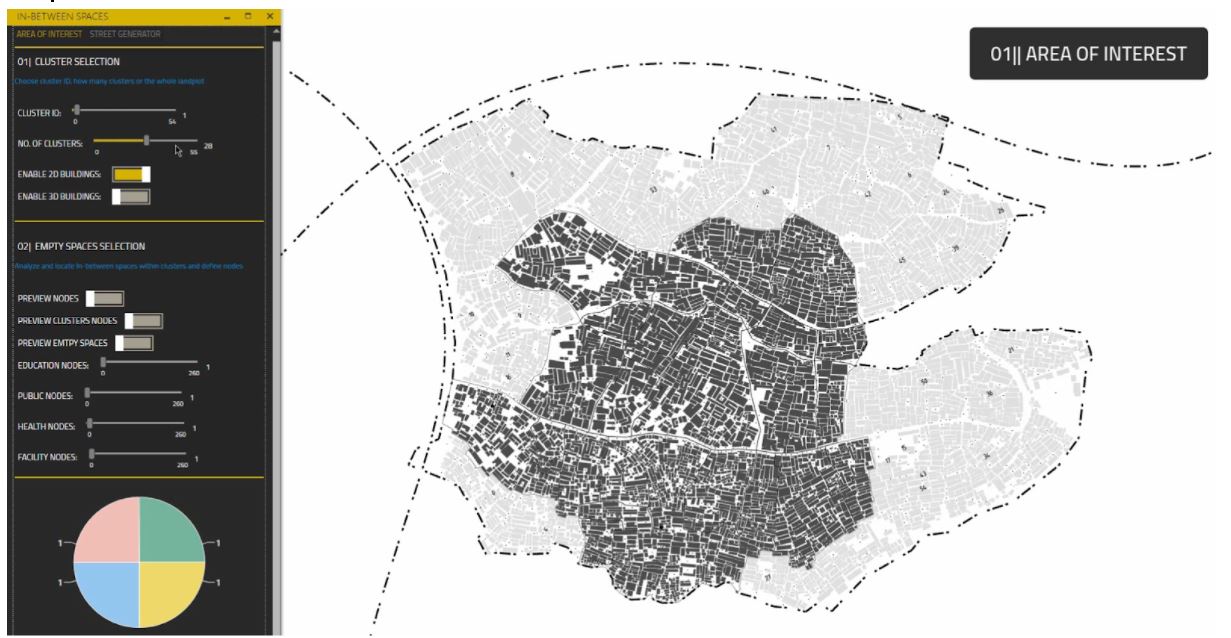
[N] Area of interest
The user is able to choose clusters ID, and how many clusters to be analyzed.
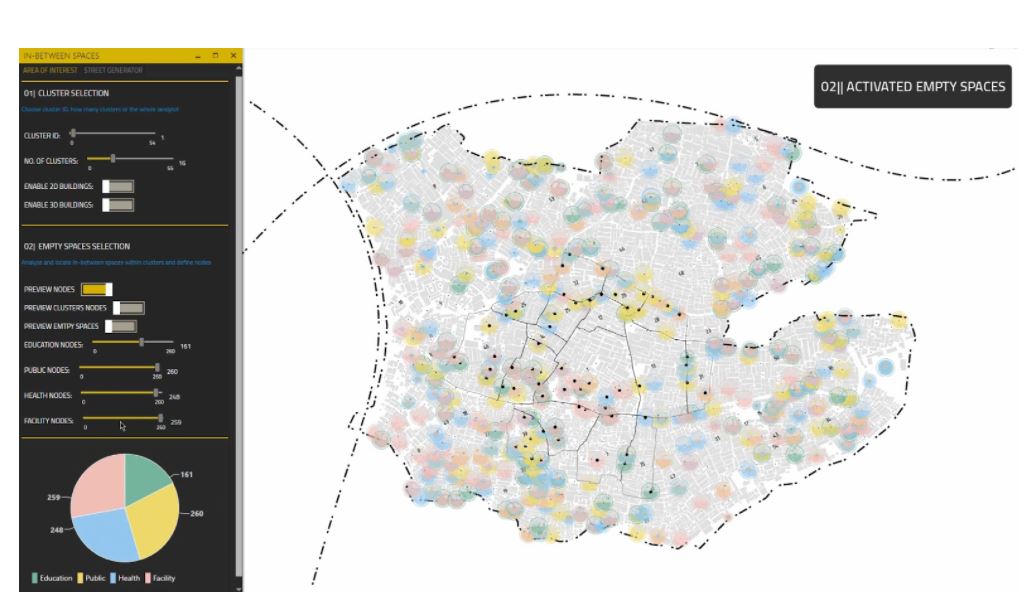
[O] Activating empty spaces from the ML model using Hops component
After training our ML model, the user can control how many nodes should be assigned to different activities using the Hops component.
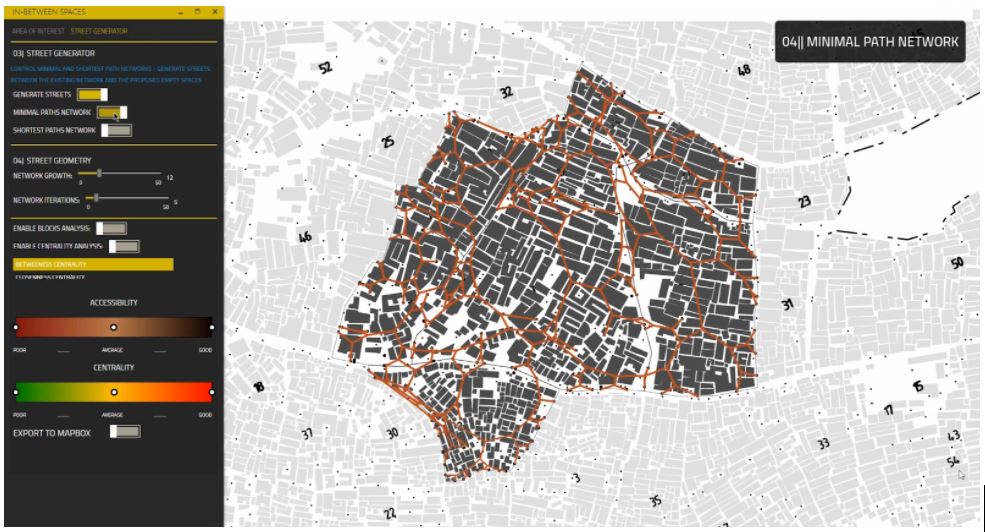
[P] Minimal Paths Network
To generate streets that connect different buildings with the activated nodes, first a minimal path network is created to optimize the walkable distance within the settlement. These network lines are used later as desired destinations to generate shortest paths networks.
[Q] Shortest Paths Network
The street network is created based on the minimal paths network. The user can change the network parameters, and the streets will only grow avoiding collision with buildings.
[R] Accessibility Analysis
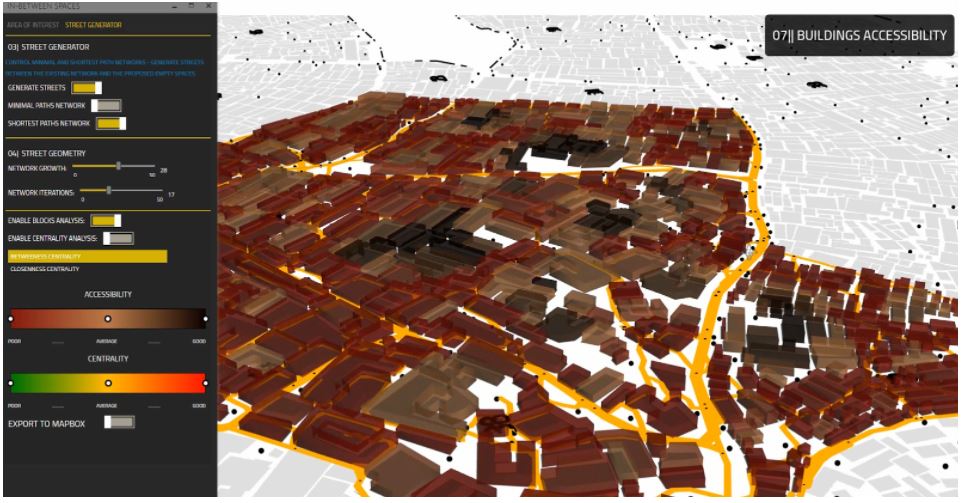
Using our script the user is able to analyze the walkable distance from the generated streetwork to different buildings. The result is a metrics for how many buildings are accessible and how many buildings are not.
[S] Closeness and Betweenness Centrality
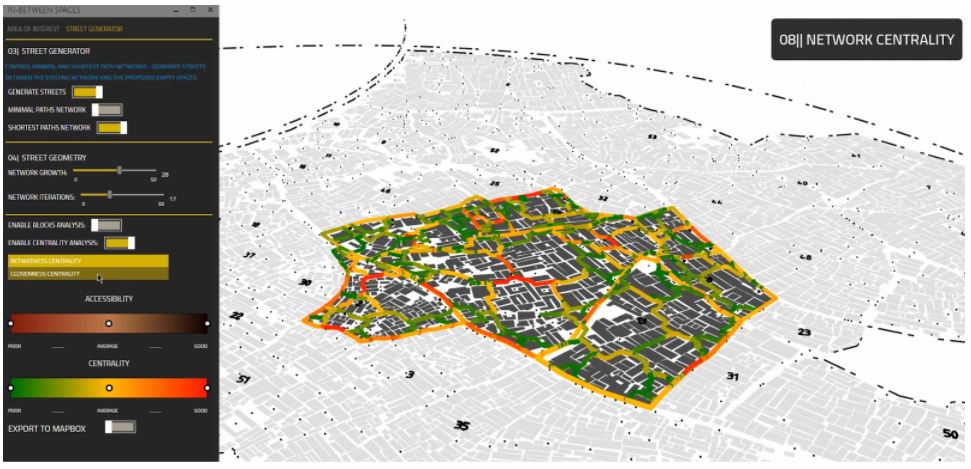
To be able to compare between different street network alternatives, the number of people walking in these streets (Betweenness Centrality) and the frequency of using streets (Closeness Centrality) are measured and visually represented to the user with a range from poor to good centrality.
An array of Projects that span over image segmentation, use of topology to improve street accessibility and analysis through satellite images.
https://towardsdatascience.com/cityclass-project-eng-15bc5fcd8e1
https://sevamoo.github.io/cityastext/
https://frontierdevelopmentlab.github.io/informal-settlements/
https://arxiv.org/pdf/1811.07896.pdf
https://stories.thinkingmachin.es/bridging-the-gap-with-geoai/
https://dymaxionlabs.medium.com/how-can-we-count-roofs-within-informal-settlements-in-latin-america-e8509f0d5534
https://github.com/cbsudux/Mumbai-slum-segmentation
https://www.google.com/url?sa=i&url=https%3A%2F%2Fijurca-pub.org%2Farticles%2F10.7710%2F2168-0620.0294%2Fgalley%2F270%2Fdownload%2F&psig=AOvVaw2u0yg4Ps2Pgrfvsr9LPRr3&ust=1619299681666000&source=images&cd=vfe&ved=0CA0QjhxqFwoTCIja4d-nlfACFQAAAAAdAAAAABAh
https://advances.sciencemag.org/content/4/8/eaar4644/tab-article-info http://openreblock.org
[1] Slum Segmentation and Change Detection in Mumbai, Github Repo+Paper https://github.com/cbsudux/Mumbai-slum-segmentation https://arxiv.org/abs/1811.07896
[2]Machine Learning-Based Slum Mapping The Case of Bandung City, Indonesia https://www.mdpi.com/2072-4292/10/10/1522
[3] Using QUICKBIRD Data to detect Slums in Pune https://www.researchgate.net/publication/276021906_Detecting_slums_from_quick_bird_data_in_pune_using_an_object_oriented_approach
[4] Road Classification https://www.researchgate.net/publication/334217077_Rural_Road_Extraction_using_Object_Based_Image_Analysis_OBIA_A_case_study_from_Assam_India
[5] Mapping Urban Slum Settlements Using Very High-Resolution Imagery and Land Boundary Data
Kibera, Nairobi Resources
[1] Attempts by Erica Hagen for Kibera, Mathare, Mukuru https://www.mapkibera.org/theme/download/
[2] Ground Truth other works https://groundtruth.in/about/
[3] Extra Data Points Such as schools
[4] Million Neighbourhoods https://millionneighborhoods.org/#16.63/-1.312506/36.792716/1.5/1
Dharavi India Resources [1] URBZ Articles Describing the relevance of micro communities within Dharavi Spatial Dimensions of Businesses in Dharavi+Social and Economic Resilience n Dharavi +Supply Chain Networks
[2] SRA Clustering Resources from SRA: Macro Slum Clusters GIS PORTAL of Dharavi [3] Other Mapping Attempts Dharavi Mapping[MASHAL] contact them about information. To call them use this link LoginMumbai UDRI Resources access [4] Cadastral maps dharavi Autocad Files
• Ecognition
LINK: https://geospatial.trimble.com/ecognition-trial
TUTORIAL: https://www.youtube.com/watch?v=iijWPY7hZbQ
• Orfeo Toolbox
Open Source Image classification with python and QGIS integration.
LINK: https://www.orfeo-toolbox.org
• Saga GIS
LINK: http://www.saga-gis.org/en/index.html
• Open CV
LINK: https://docs.opencv.org/master/index.html
• MaskRNN
Detecting Objects in Images
LINK: https://arxiv.org/abs/1703.06870
• Qgis
Open Source GIS Platform. Aids reading and exporting GIS information into shapefile for rhino.
LINK: https://qgis.org/en/site/
• ARCGIS
LINK: https://www.esri.com/en-us/arcgis/products/arcgis-online/trial
Machine Learning ESRI Library
Documentation: https://developers.arcgis.com/python/api-reference/arcgis.learn.toc.html
Tutorial: https://www.youtube.com/watch?v=mU8OpH_fTk8&t=13s
• Mapbox API
Embed mapping functions within the web
LINK: https://docs.mapbox.com/api/overview/
Feedback Stuff
• Kepler
Map Analysis and Visualisations
LINK: https://kepler.gl
• GPS Tracking
https://www.youtube.com/watch?v=kBygYRWbkPo
• Humanitarian Open Street Maps
https://www.hotosm.org/tools-and-data
• Urbano
GH Plugin to convert OSM files to parametric data
Tutorial: https://www.youtube.com/watch?v=3dibmohx1Wo
• Decoding Spaces
GH Plugin to convert OSM files to parametric data
Tutorial: https://www.youtube.com/watch?v=29SZcK7NgAg
• Dataset Tools
Github: https://github.com/dvschultz/dataset-tools
Tutorial Playlist: https://www.youtube.com/watch?v=e32ECuRZOYw&list=PLWuCzxqIpJs9v81cWpRC7nm94eTMtohHq&index=2
• Imagemick
http://www.imagemagick.org/script/montage.php
https://medium.com/@mheavers/generating-pix2pix-images-from-the-web-with-imagemagick-487ae5285ab7

