This repo should provide a repro case + results for @sentry/node SDK found at: https://github.com/getsentry/sentry-javascript/tree/master/packages/node
The file express.js in this repo was used to measure the following results.
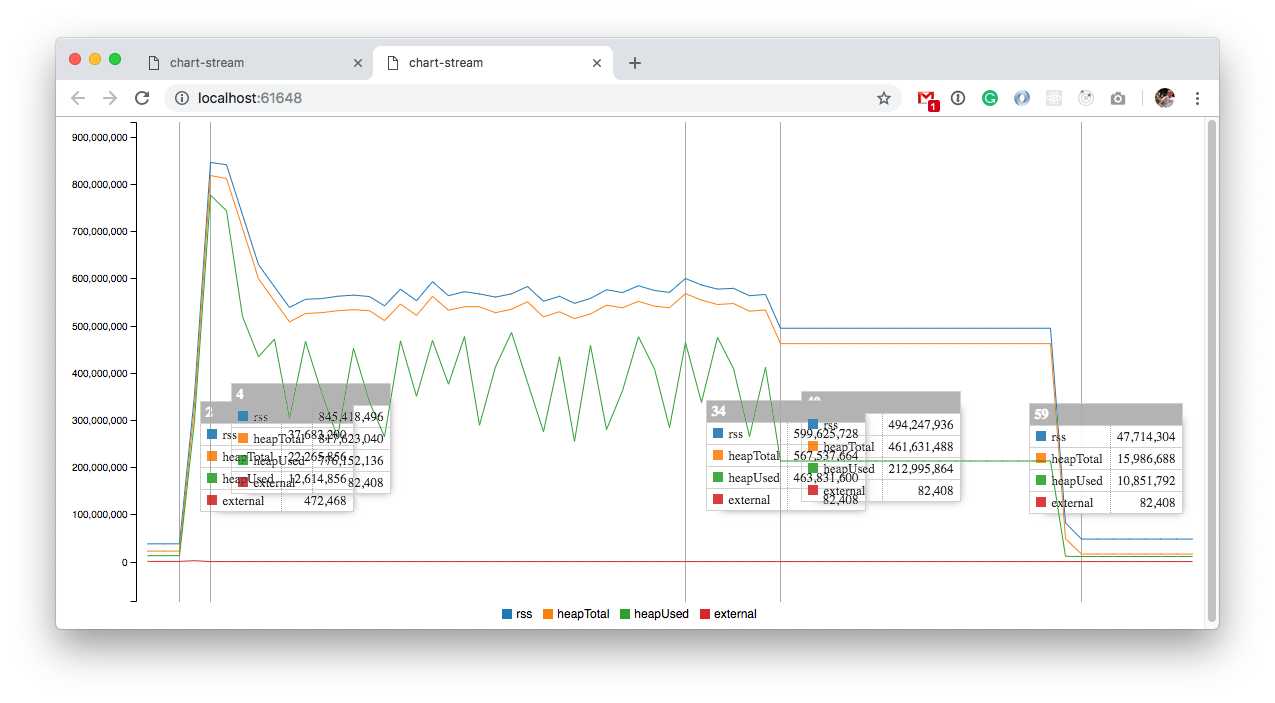
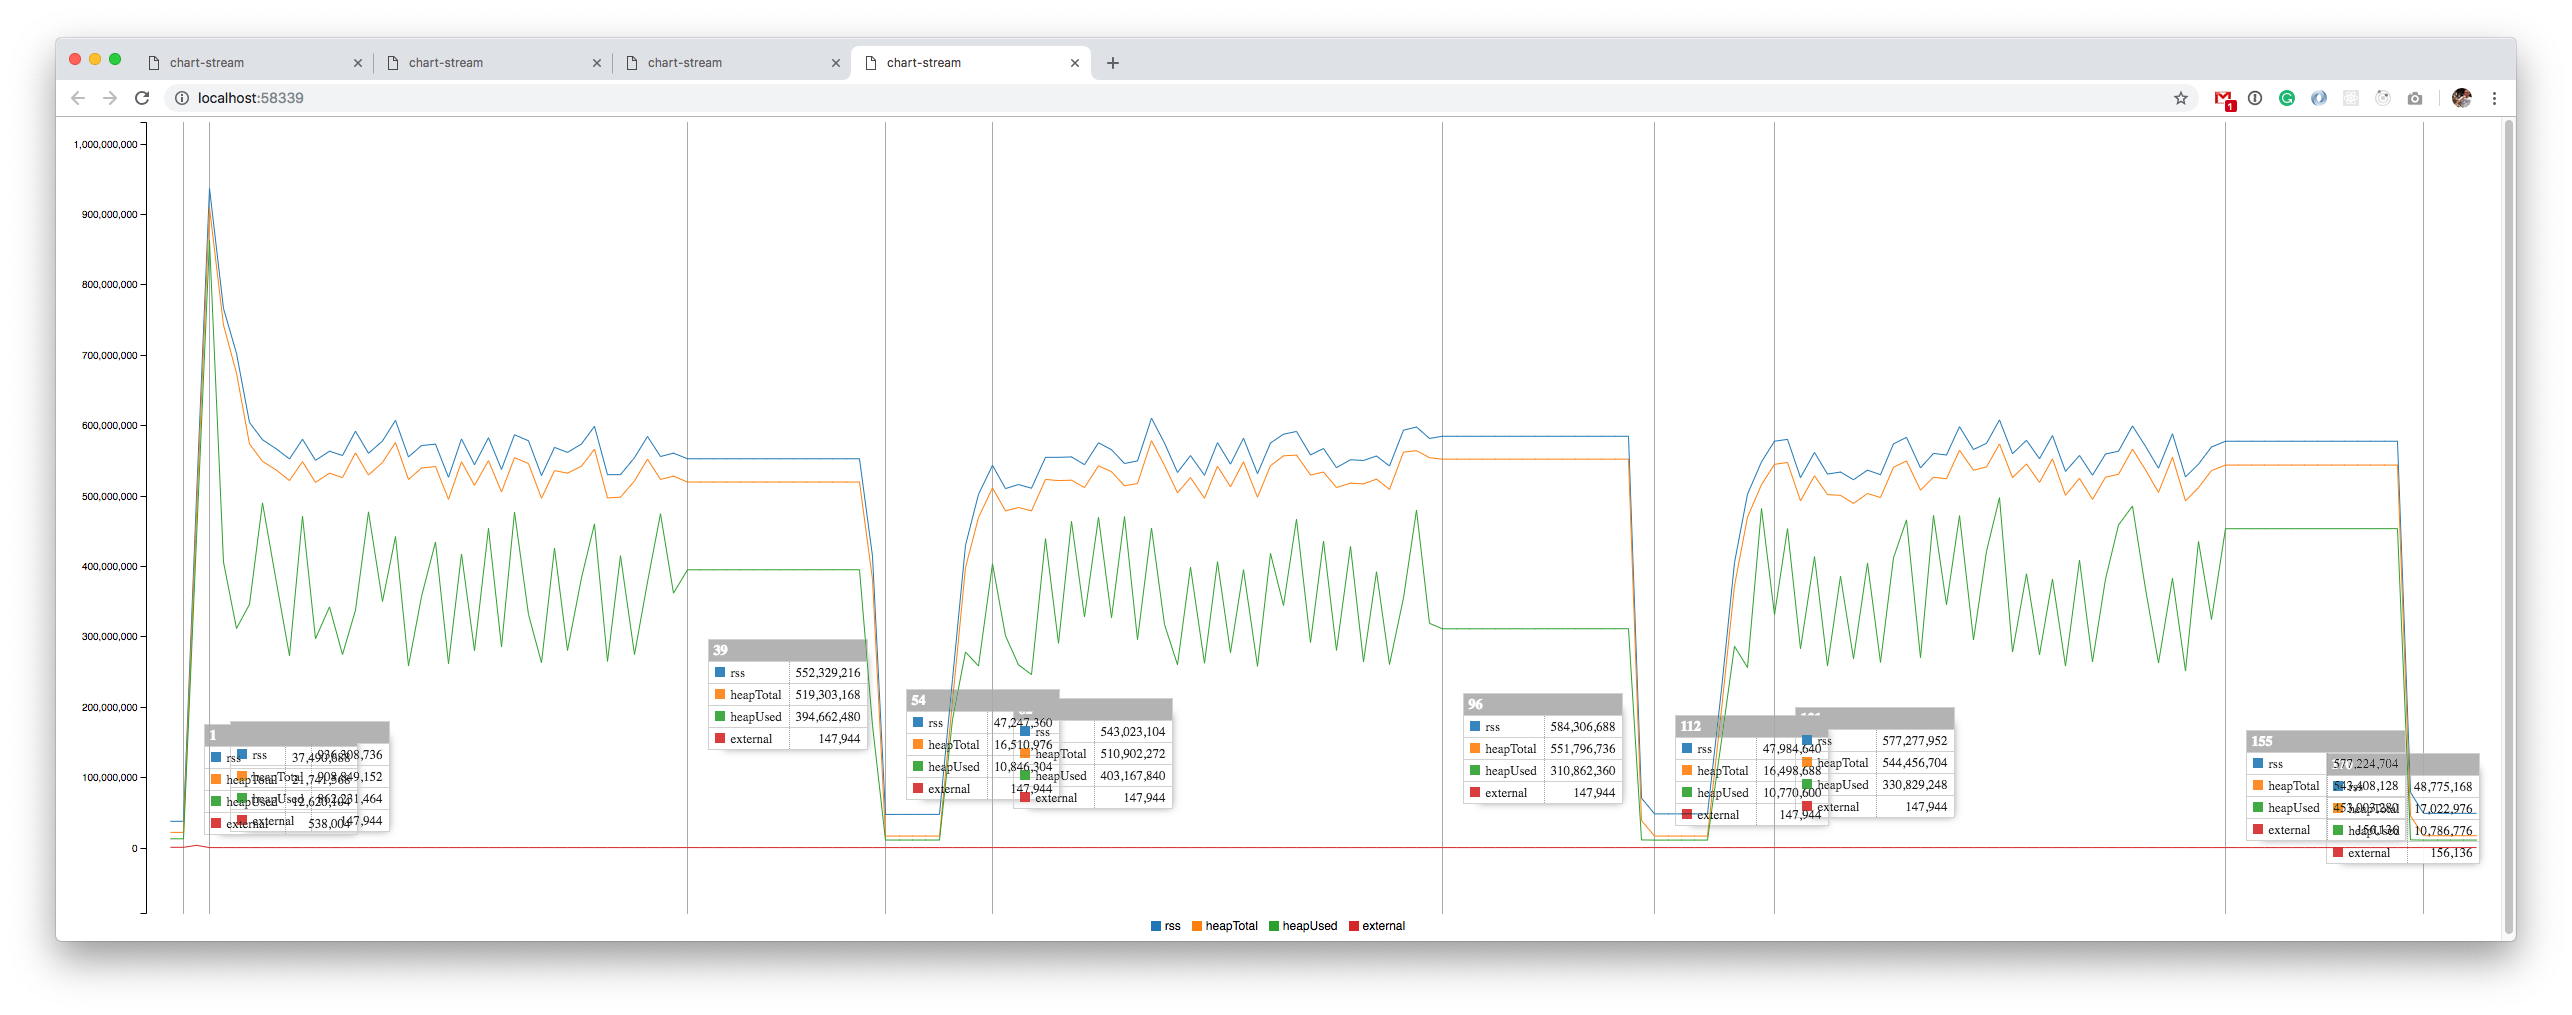
The peak memory usage decreased by ~80% from version 4.5.3 → 5.x.x
Average memory usage decreased by ~70% from version 4.5.3 → 5.x.x
We are also able to serve ~29% more requests/sec from version 4.5.3 → 5.x.x
(When referring to 5.x.x I mean this work in progress branch https://github.com/getsentry/sentry-javascript/tree/ref/make-sync)
git clone https://github.com/HazAT/sentry-node-sdk-memory-pm.git
npm install
or
yarn install
Then run the application with node --inspect express.js and open Google Chrome Memory inspection tool (can be found in the developer console).
The graphs in this repo where created with https://github.com/watson/memory-usage used exactly as described in the repo (ran with memory-usage express.js)
Node version 10.15.0 was used for all the tests.
After the server is started, we run a ApacheBench command:
ab -c 20 -n 10000 http://localhost:3000/
Running 10000 Requests with 20 concurrent connections.
ab -c 20 -n 10000 http://localhost:3000/
This is ApacheBench, Version 2.3 <$Revision: 1826891 $>
Copyright 1996 Adam Twiss, Zeus Technology Ltd, http://www.zeustech.net/
Licensed to The Apache Software Foundation, http://www.apache.org/

Benchmarking localhost (be patient)
Completed 1000 requests
Completed 2000 requests
Completed 3000 requests
Completed 4000 requests
Completed 5000 requests
Completed 6000 requests
Completed 7000 requests
Completed 8000 requests
Completed 9000 requests
Completed 10000 requests
Finished 10000 requests


Server Software:
Server Hostname:        localhost
Server Port:            3000

Document Path:          /
Document Length:        10 bytes

Concurrency Level:      20
Time taken for tests:   75.842 seconds
Complete requests:      10000
Failed requests:        0
Non-2xx responses:      10000
Total transferred:      1270000 bytes
HTML transferred:       100000 bytes
Requests per second:    131.85 [#/sec] (mean)
Time per request:       151.684 [ms] (mean)
Time per request:       7.584 [ms] (mean, across all concurrent requests)
Transfer rate:          16.35 [Kbytes/sec] received

Connection Times (ms)
              min  mean[+/-sd] median   max
Connect:        0    0   0.4      0      17
Processing:    25  151 103.8    107     759
Waiting:        8  126  93.7     89     714
Total:         25  152 103.8    108     760

Percentage of the requests served within a certain time (ms)
  50%    108
  66%    122
  75%    149
  80%    198
  90%    343
  95%    383
  98%    435
  99%    467
 100%    760 (longest request)
https://github.com/getsentry/sentry-javascript/tree/ref/make-sync
ab -c 20 -n 10000 http://localhost:3000/
This is ApacheBench, Version 2.3 <$Revision: 1826891 $>
Copyright 1996 Adam Twiss, Zeus Technology Ltd, http://www.zeustech.net/
Licensed to The Apache Software Foundation, http://www.apache.org/

Benchmarking localhost (be patient)
Completed 1000 requests
Completed 2000 requests
Completed 3000 requests
Completed 4000 requests
Completed 5000 requests
Completed 6000 requests
Completed 7000 requests
Completed 8000 requests
Completed 9000 requests
Completed 10000 requests
Finished 10000 requests


Server Software:
Server Hostname:        localhost
Server Port:            3000

Document Path:          /
Document Length:        10 bytes

Concurrency Level:      20
Time taken for tests:   58.991 seconds
Complete requests:      10000
Failed requests:        0
Non-2xx responses:      10000
Total transferred:      1270000 bytes
HTML transferred:       100000 bytes
Requests per second:    169.52 [#/sec] (mean)
Time per request:       117.983 [ms] (mean)
Time per request:       5.899 [ms] (mean, across all concurrent requests)
Transfer rate:          21.02 [Kbytes/sec] received

Connection Times (ms)
              min  mean[+/-sd] median   max
Connect:        0    0   0.3      0      12
Processing:    32  117  26.3    119     262
Waiting:       12   99  23.1    100     231
Total:         32  118  26.2    119     262

Percentage of the requests served within a certain time (ms)
  50%    119
  66%    128
  75%    134
  80%    138
  90%    148
  95%    158
  98%    169
  99%    183
 100%    262 (longest request)


