

English 简体中文
- Solve the problem of android tpl.html file reference;
- echarts version upgraded to 5.2.0;
- Support all kinds of charts;
- Support map chart;
- Support Extensions;
$ npm install react-native-echarts-pro --save
$ npm install react-native-webview --save
import React from "react";
import { View } from "react-native";
import RNEChartsPro from "react-native-echarts-pro";
export default function Demo() {
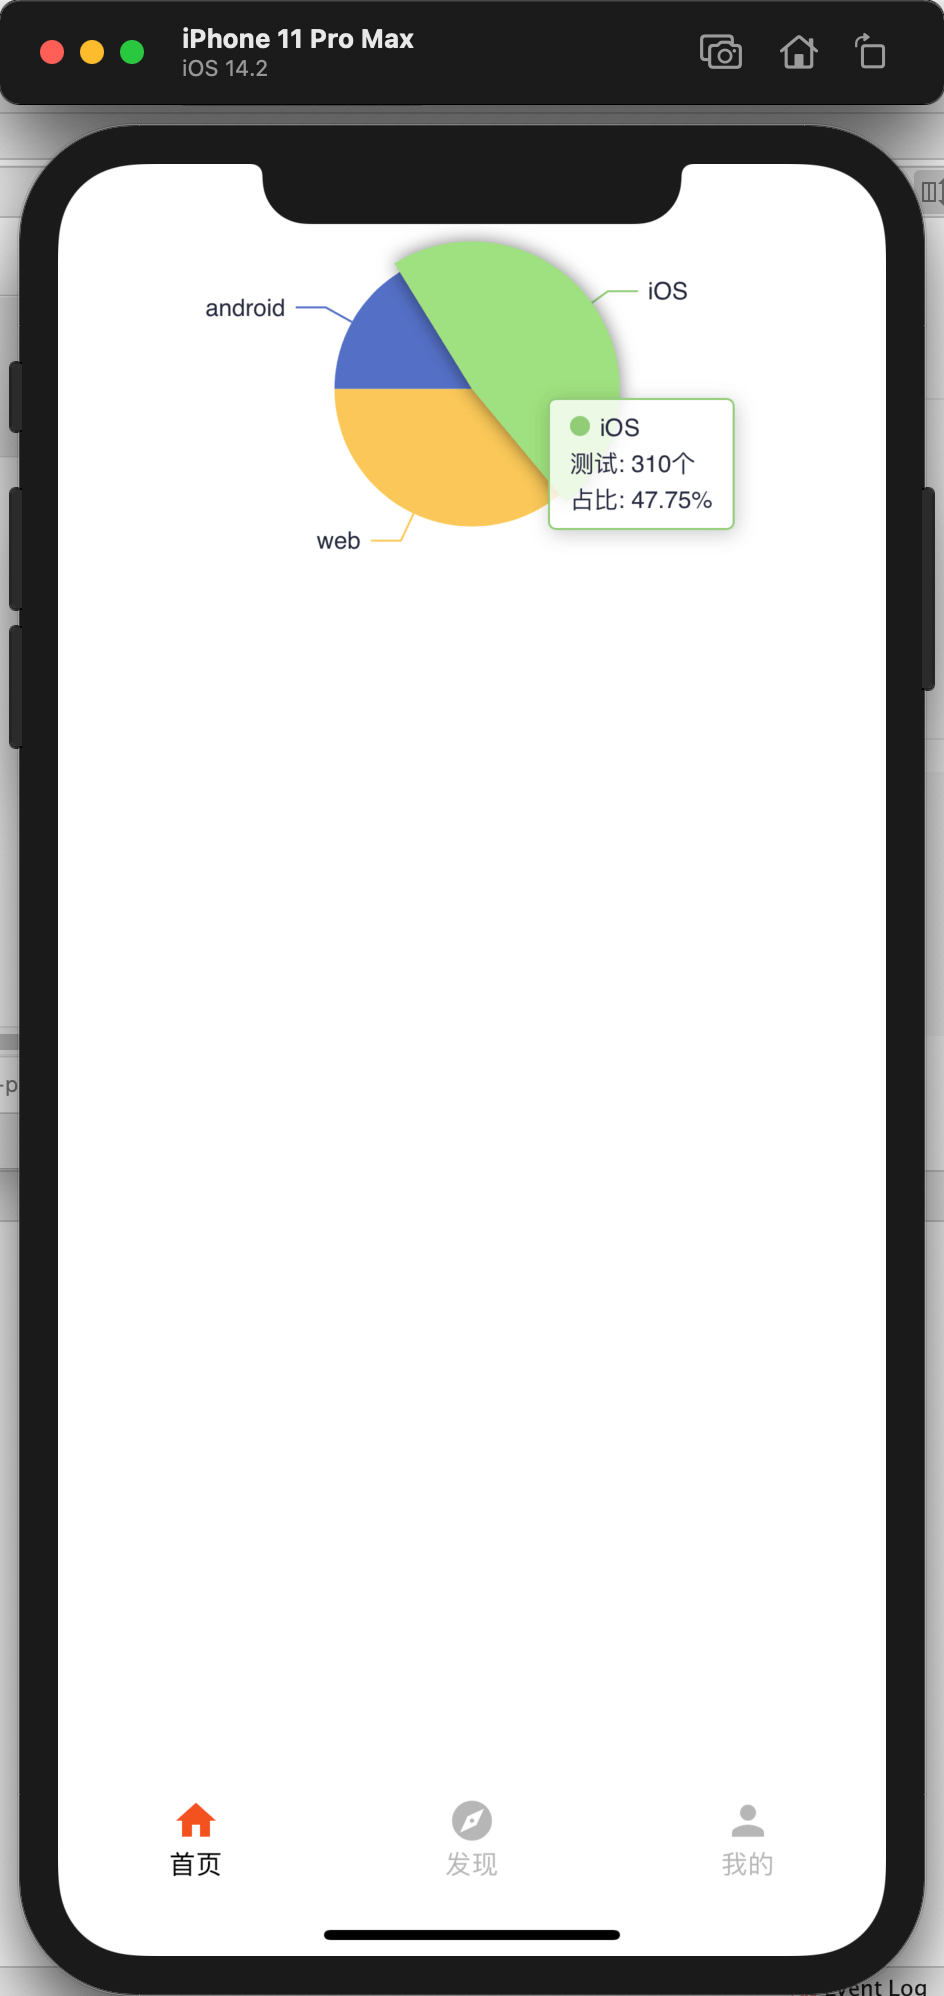
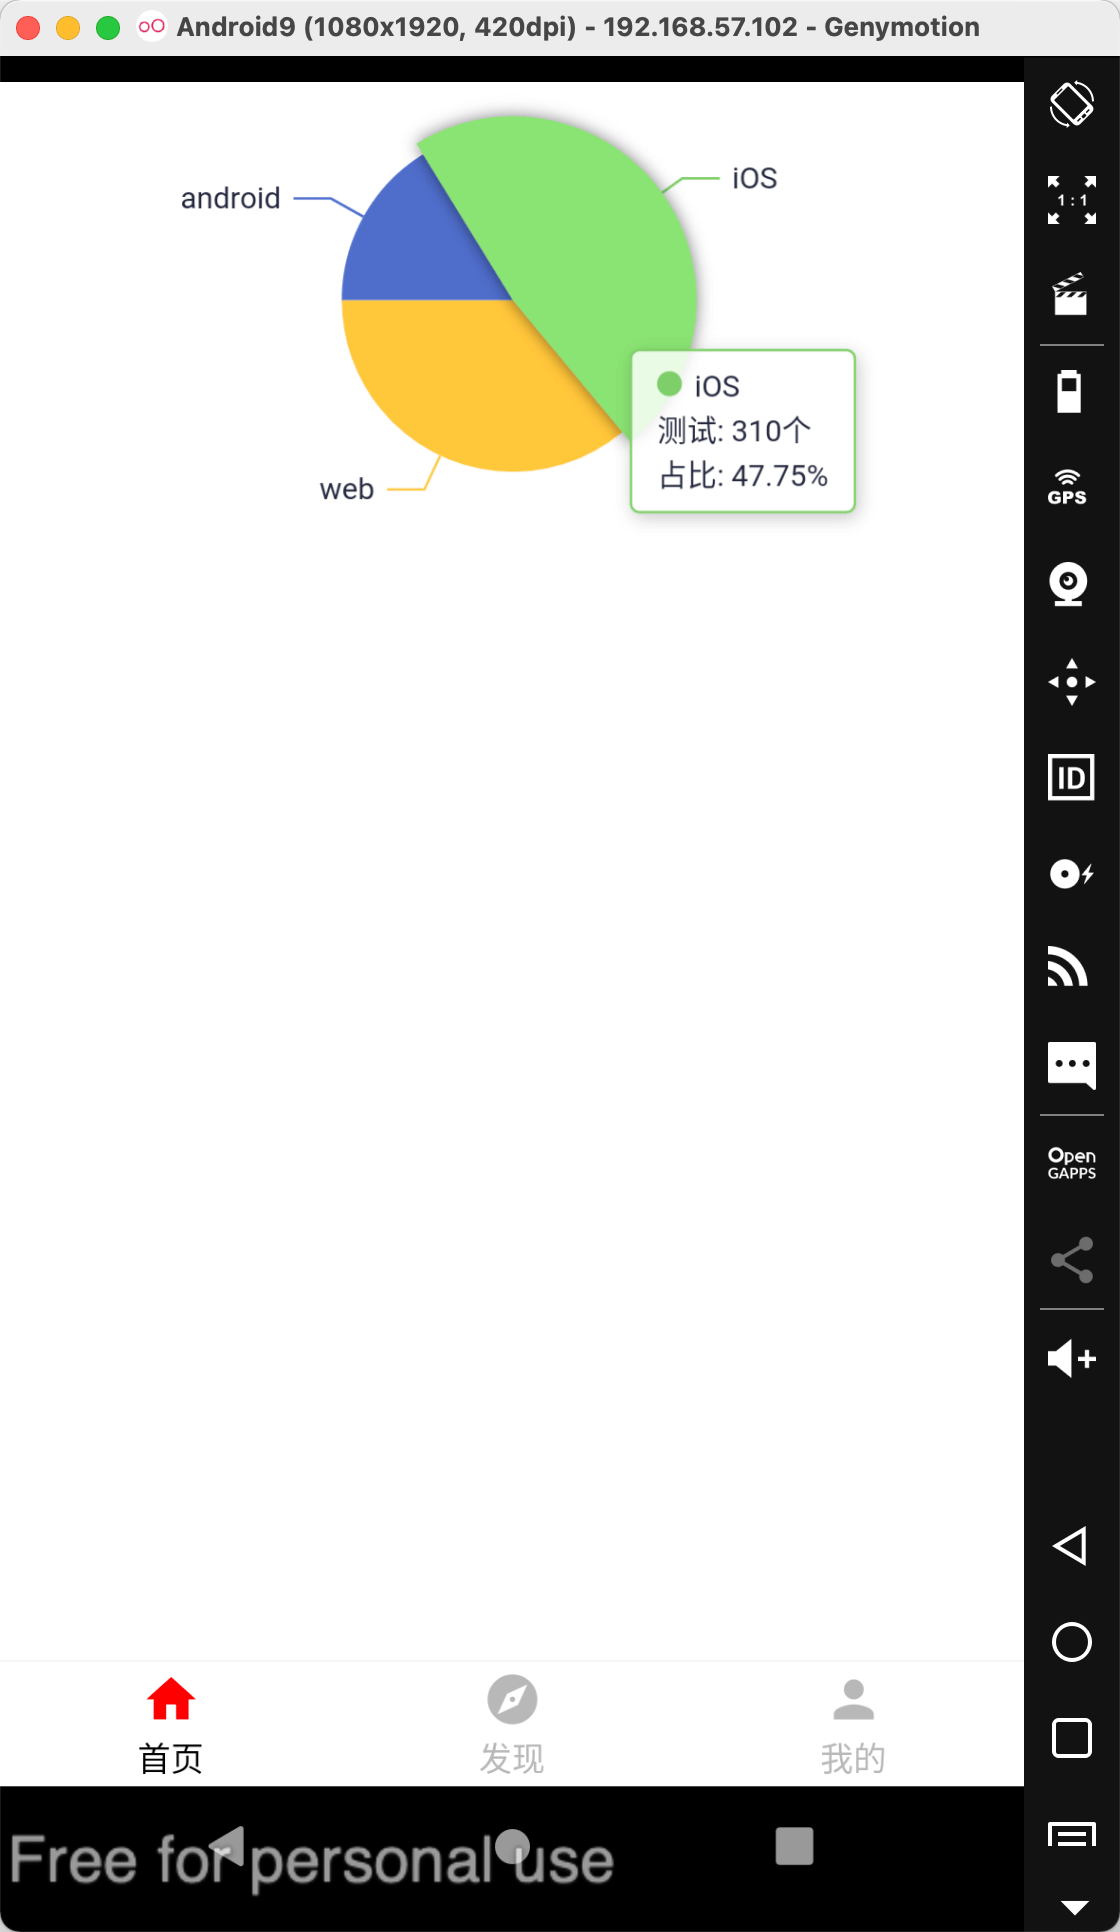
const pieOption = {
tooltip: {
backgroundColor: "rgba(255,255,255,0.8)",
borderColor: "#668BEE",
borderWidth: 1,
padding: [5, 10],
textStyle: {
color: "#24283C",
fontSize: 12,
},
trigger: "item",
formatter: function (a) {
return (
'<i style="display: inline-block;width: 10px;height: 10px;background: ' +
a["color"] +
';margin-right: 5px;border-radius: 50%;}"></i>' +
a["name"] +
"</br>Test: " +
a["value"] +
"个 " +
"<br>proportion: " +
a["percent"] +
"%"
);
},
},
series: [
{
name: "Source",
type: "pie",
legendHoverLink: true,
hoverAnimation: true,
avoidLabelOverlap: true,
startAngle: 180,
radius: "55%",
center: ["50%", "35%"],
data: [
{ value: 105.2, name: "android" },
{ value: 310, name: "iOS" },
{ value: 234, name: "web" },
],
label: {
normal: {
show: true,
textStyle: {
fontSize: 12,
color: "#23273C",
},
},
},
emphasis: {
lable: {
show: true,
fontSize: 12,
color: "#668BEE",
},
itemStyle: {
show: true,
shadowBlur: 10,
shadowOffsetX: 0,
shadowColor: "rgba(0, 0, 0, 0.5)",
},
},
},
],
};
return (
<View style={{ height: 300, paddingTop: 25 }}>
<RNEChartsPro height={250} option={pieOption} />
</View>
);
}
import React from "react";
import { View } from "react-native";
import RNEChartsPro from "react-native-echarts-pro";
export default function Demo() {
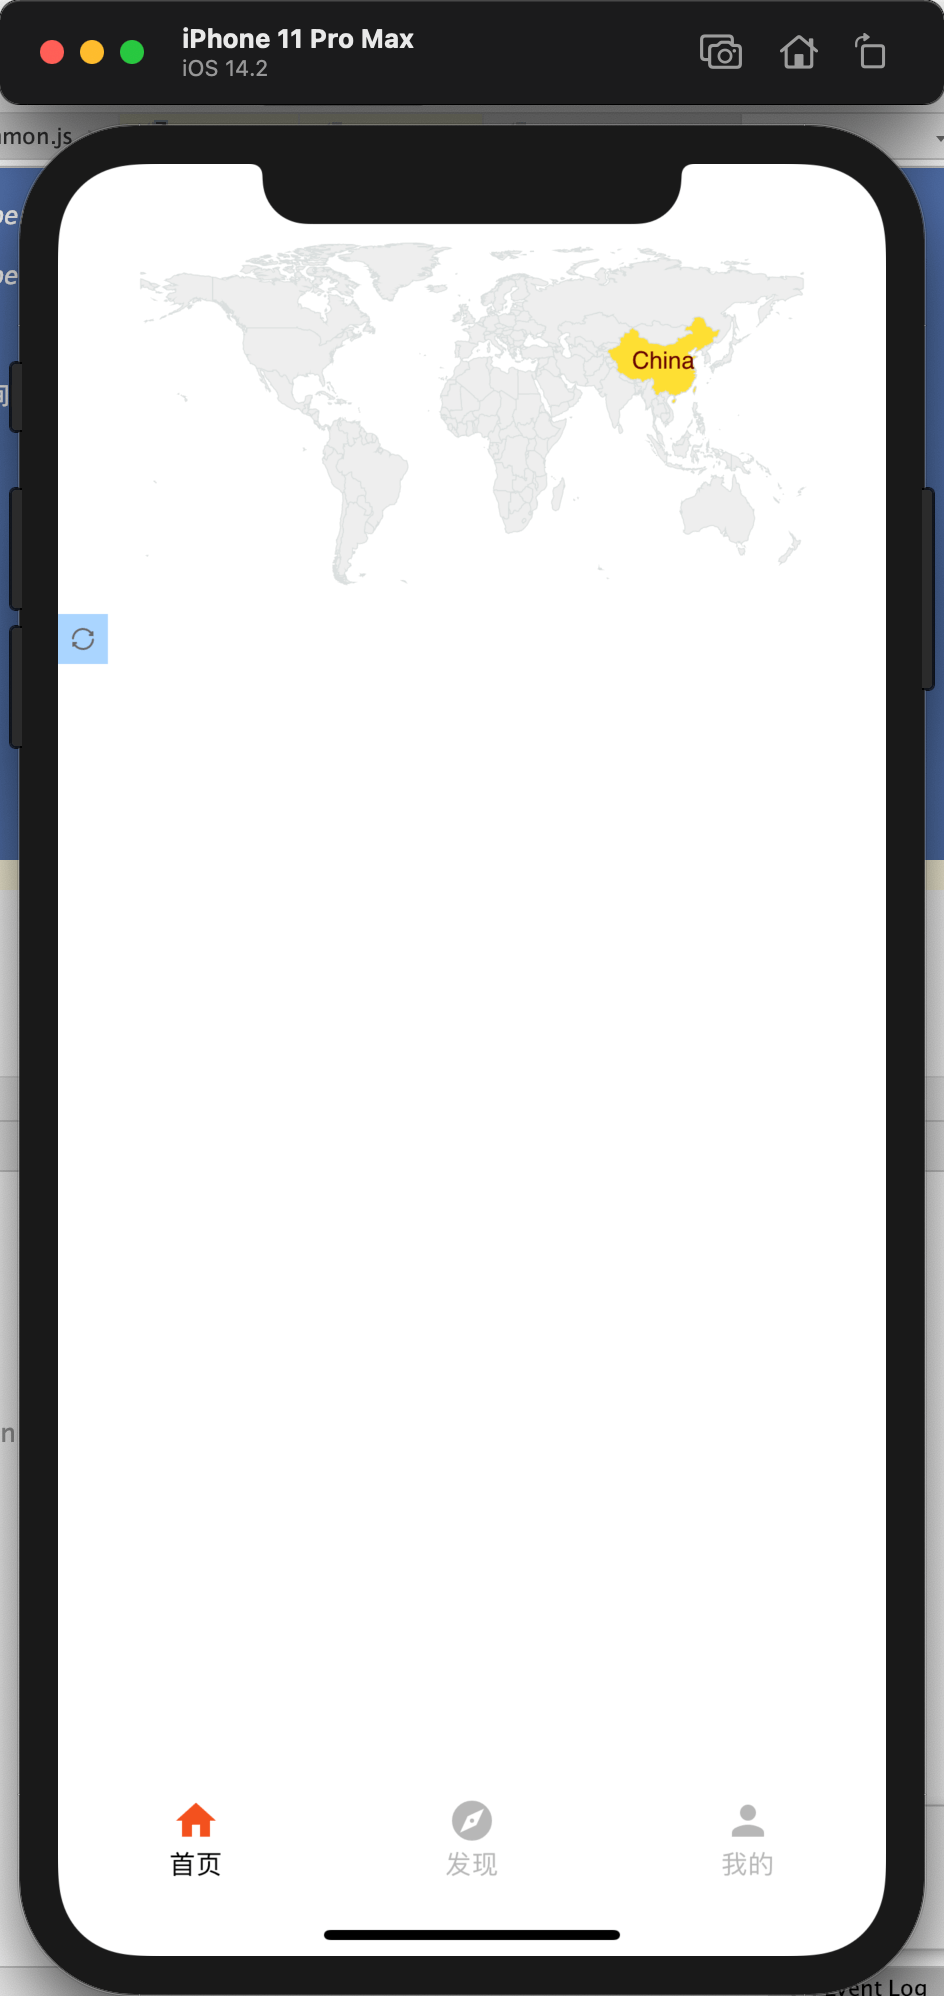
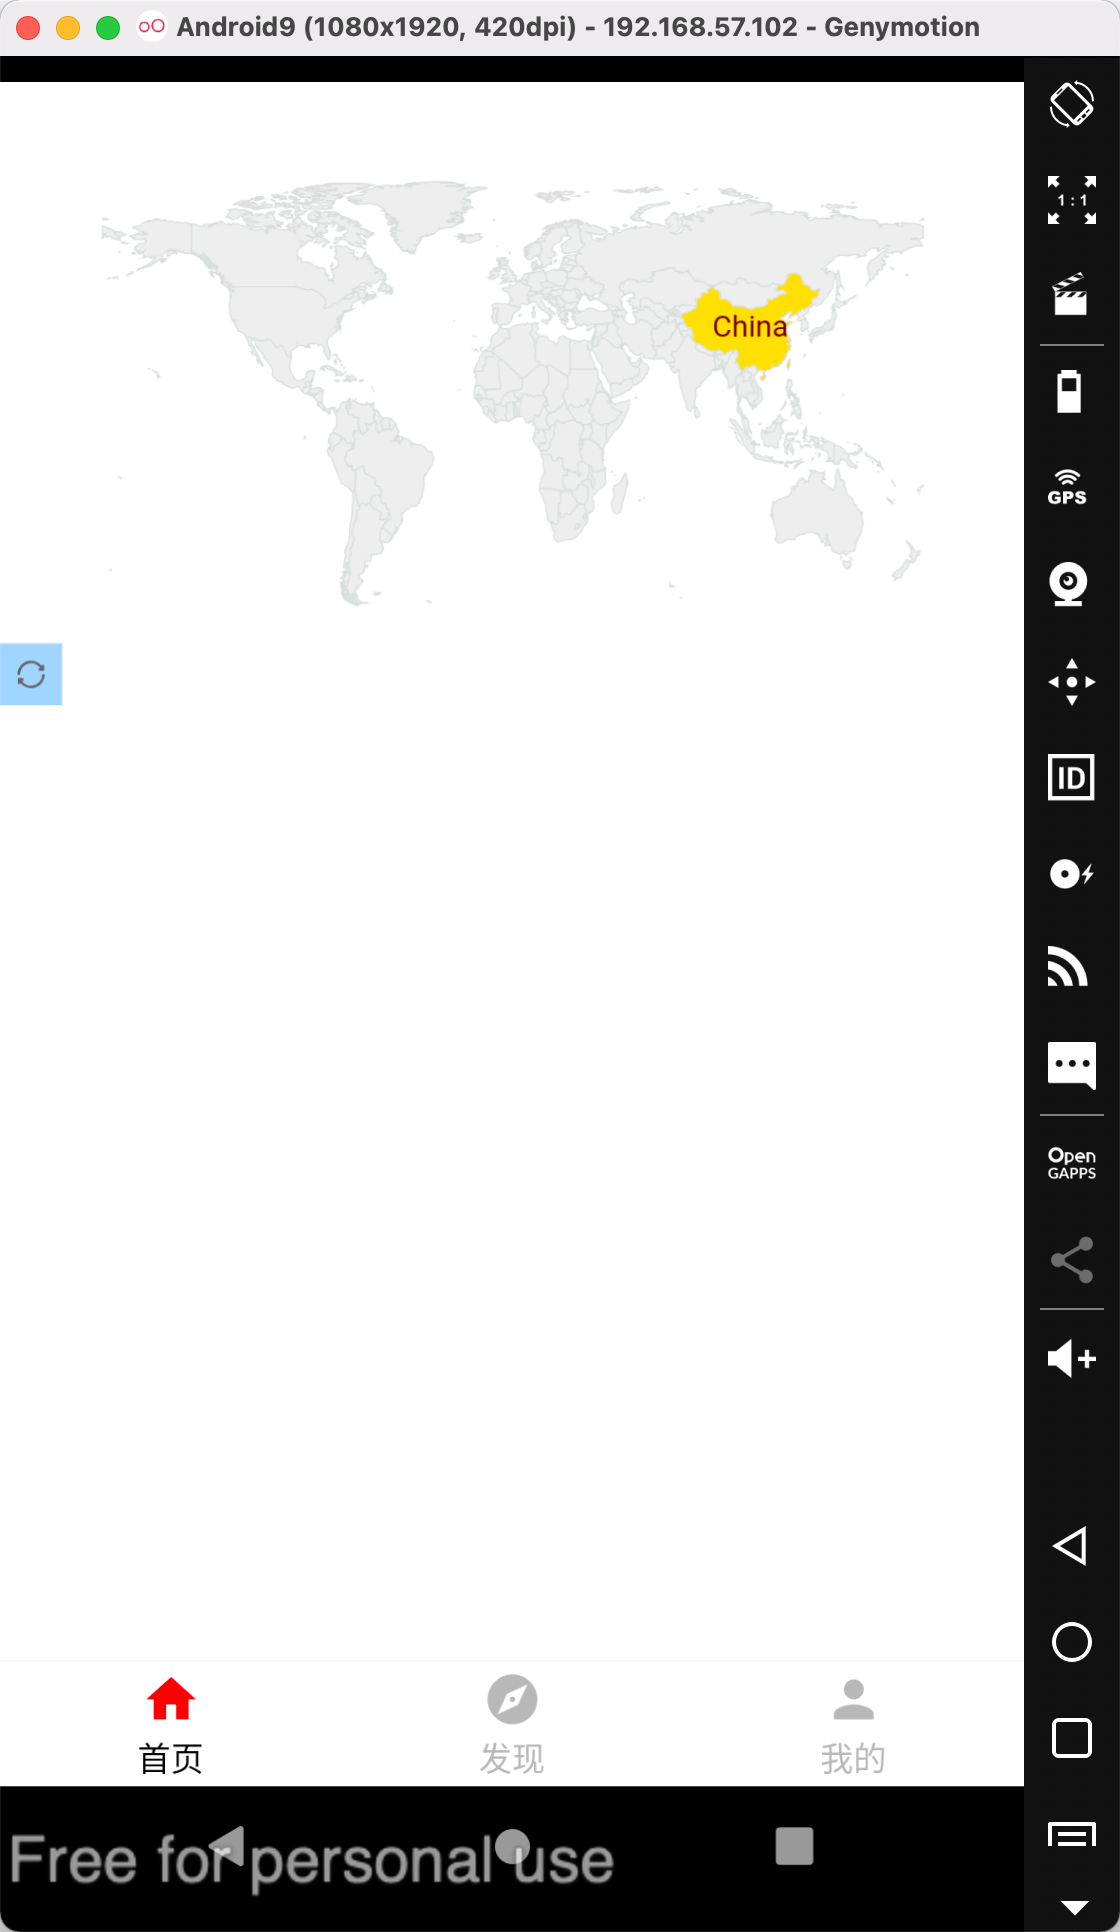
const mapData = {
visualMap: {
show: false,
left: "right",
top: "center",
min: 1,
max: 3,
calculable: true,
},
series: [
{
type: "map",
map: "world",
mapType: "world",
selectedMode: "single",
itemStyle: {
normal: {
areaStyle: { color: "#B1D0EC" },
color: "#B1D0EC",
borderColor: "#dadfde",
},
emphasis: {
//mouse hover style
label: {
show: true,
textStyle: {
color: "#000000",
},
},
},
},
data: [],
roam: true,
},
],
toolbox: {
// According to strategy, optional: true (display) | false (hidden)
show: true,
// Layout, the default value is horizontal layout, optional for: 'horizontal' | 'vertical'
orient: "horizontal",
// Horizontal position, the default for map centered, optional for: 'center' | 'left' | 'right' | {number} (x coordinate, px)
x: "left",
// Vertical position, the default for the top of the map, can be selected as: 'top' | 'bottom' | 'center' | {number} (y, px)
y: "bottom",
// Toolbox background color, transparent by default
backgroundColor: "#1e90ff60",
// The interval between each item (unit: px, default: 10) is horizontal for horizontal layout and vertical for vertical layout
itemGap: 10,
// Toolbox icon size, unit (px)
itemSize: 10,
// Toolbox icon color sequence, recycling, and support to specify a color in a specific feature
color: "#ffffff",
// Whether to display the toolbox text prompt. Enabled by default
showTitle: false,
feature: {
// Restore, reset the original diagram
restore: {
show: true,
title: "还原",
},
},
},
};
return (
<View style={{ height: 300 }}>
<RNEChartsPro height={250} option={mapData} />
</View>
);
}| Prop | Type | Default | Require | Description |
|---|---|---|---|---|
| height | number | 400 | Y | Chart area height |
| option | object | null | Y | Chart data configuration items, see details:https://echarts.apache.org/zh/option.html#title |
| backgroundColor | string | transparent | N | Chart background color |
| themeName | string | - | N | There are only six officially available themes: vintage || dark || macarons || infographic || shine || roma |
| webViewSettings | object | null | N | Customize WebView container properties |
| formatterVariable | object | null | N | If option’formatter function need variable,can use this. |
  return (
    <View style={{ height: 300, paddingTop: 25 }}>
      <RNEChartsPro
        webViewSettings={{ // <==There
          scrollEnabled: true,
          onLoadEnd: () => {
            alert(1);
          },
          style: {
            backgroundColor: "red",
          },
        }}
        onPress={res => alert(JSON.stringify(res))}
        legendSelectChanged={res => alert(res)}
        height={250}
        option={pieOption}
      />
    </View>
); const pieOption = {
yAxis: {
axisLabel: {
formatter(value) {
return value + formatterVariable.unit;
}
}
}
...
}
return (
<View style={{ height: 300, paddingTop: 25 }}>
<RNEChartsPro
...
formatterVariable={{ unit: "dollar" }}
option={pieOption}
/>
</View>
);example(echarts-liquidfill):
const liquidOption = {
    title: {
      text: "水球图",
      left: "center",
    },
    series: [
      {
        type: "liquidFill",
        data: [0.6],
        color: ["#afb11b"],
        itemStyle: {
          opacity: 0.6,
        },
        emphasis: {
          itemStyle: {
            opacity: 0.9,
          },
        },
      },
    ],
  };
	return (
    <View style={{ height: 300, paddingTop: 25 }}>
      <RNEChartsPro
				...
        extension={[ // Dynamically import third-party CDN or import min.js file
          "https://cdn.jsdelivr.net/npm/echarts-liquidfill@3.0.0/dist/echarts-liquidfill.min.js",
        ]}
        option={liquidOption}
      />
    </View>
);| Method name | Params | Description |
|---|---|---|
| setNewOption | option | Reassign and render the chart. |
| onPress | callbackData | Chart click event,callbackData is the clicked data. |
| onDataZoom | callbackData | Chart zoom event. |
<RNEChartsPro ref={(echarts) => (this.echarts = echarts)} option={this.state.options}/>

// use
this.echarts.setNewOption({...})// res is an object :{name:"", value:""}
<RNEChartsPro onPress={res => alert(JSON.stringify(res))} option={this.state.options}/>- Support third-party extension;
- Custom map data;
- Custom theme;