Python 3
Do NOT use conda, create a new environment with venv. Try to install from the requirements.txt file.
If that does not work, follow the manual installation steps without virtual environment.
- install GraphViz - the graph layouting engine on the backend
sudo apt install graphviz
- Install PyGObjects - python library for GUI applications (like this one)
sudo apt install libgirepository1.0-dev gcc libcairo2-dev pkg-config python3-dev gir1.2-gtk-3.0pip3 install pycairopip3 install PyGObjectpip3 install pygraphviz
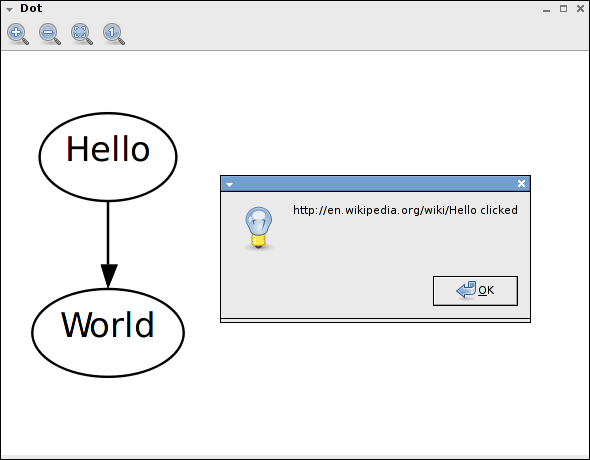
This package was created by my student Daniel Mareda. It is based on the xdot.py library which is explained below.
xdot.py is an interactive viewer for graphs written in Graphviz's dot language.
It uses internally the GraphViz's xdot output format as an intermediate format, Python GTK bindings, and Cairo for rendering.
xdot.py can be used either as a standalone application from command line, or as a library embedded in your Python application.
Download and install:
Run:
apt-get install gir1.2-gtk-3.0 python3-gi python3-gi-cairo graphviz
If you install xdot.py from PyPI or from your Linux distribution package managing system, you should have the xdot somewhere in your PATH automatically.
When running xdot.py from its source tree, you can run it by first setting PYTHONPATH environment variable to the full path of xdot.py's source tree, then running:
python3 -m xdot
You can also pass the following options:
Usage:
	xdot.py [file|-]

Options:
  -h, --help            show this help message and exit
  -f FILTER, --filter=FILTER
                        graphviz filter: dot, neato, twopi, circo, or fdp
                        [default: dot]
  -n, --no-filter       assume input is already filtered into xdot format (use
                        e.g. dot -Txdot)
  -g GEOMETRY           default window size in form WxH

Shortcuts:
  Up, Down, Left, Right     scroll
  PageUp, +, =              zoom in
  PageDown, -               zoom out
  R                         reload dot file
  F                         find
  Q                         quit
  P                         print
  Escape                    halt animation
  Ctrl-drag                 zoom in/out
  Shift-drag                zooms an area
If - is given as input file then xdot.py will read the dot graph from the standard input.
See included sample.py script for an example of how to embedded xdot.py into another application.
-
ZGRViewer -- another superb graphviz/dot viewer
-
dot2tex -- python script to convert xdot output from Graphviz to a series of PSTricks or PGF/TikZ commands.
-
The PyPy project also includes an interactive dot viewer based on graphviz's plain format and the pygame library.